The Folly of Blame: Why Investors Should Care About Their Managers' Culture - March 2015
Research Affiliates


Description
VOLUME 41 NUMBER 3
www.iijpm.com
SPRING 2015
The Voices of Influence | iijournals.com
. The Folly of Blame: Why
Investors Should Care About
Their Managers’ Culture
JASON HSU, JIM WARE, AND CHUCK HEISINGER
JASON HSU
is co-founder and
vice chair of Research
Affiliates, LLC in Newport Beach, CA, and
an adjunct professor of
finance at the UCLA
Anderson School of
Management in Los
Angeles, CA.
hsu@rallc.com
JIM WARE
is the founder of Focus
Consulting Group, Inc.,
in Long Grove, IL.
jware@focuscgroup.com
CHUCK H EISINGER
is a coach at Focus
Consulting Group
in Long Grove, IL.
cheisinger@focuscgroup.com
SPRING 2015
JPM-HSU.indd 23
M
any industry observers would
agree with Charles Ellis’s
assertion that, when it comes
to achieving long-term success for an investment organization, culture
and organizational values are “the only truly
enduring factors” (Ellis [2004]). However,
only a handful of managers have emphasized
culture as an important attribute. Investment
consultants do not appear to systematically
assess managers,1 nor do investors appear
to make hiring or firing decisions based on
the managers’ culture. The business school
finance curriculum does not mention culture
as a key organizational attribute deserving
the attention of firm leaders and manager
selection analysts.
These facts suggest that, by and large, the industry and academia do not believe culture matters in a useful way. The investment industry’s lack of emphasis on culture contrasts interestingly with developments in other industries. According to a 2013 survey conducted by the Katzenbach Center (www.strategyand. pwc.com), 84% of 2,200 respondents from various industries report that “culture is critically important to success,” and 60% believe that “culture is more important to success than strategy and business model,” (Aguirre et al. [2013]). Lyons et al.
[2007] find that culture meaningfully inf luences innovation and client service. Kets de Vries et al. [2009] argue that, even when change is necessary to a firm’s survival, organizational renewal is impeded by a dysfunctional culture and a lack of senior level self-awareness. This contributes to the high failure rate for change initiatives (Beer and Nohria, [2000]) as well as for mergers involving firms with conf licting cultures (Camerer and Weber [2001]).
Killingsworth [2012] maintains that corporate culture has greater inf luence than do explicit rules and policies on ethical behavior and legal compliance. In this article, we adopt two standard operational definitions of culture.2 The first views culture as a manifest pattern of crossindividual behavioral consistency (CIBC), or the coherent way in which employees perform tasks, solve problems, resolve conf licts, and treat customers and colleagues. The second, complementary definition views culture as a set of informal values, norms, and beliefs that underlie the observed CIBC. Both definitions are useful for understanding the survey responses and the empirical results of our study. In our context, a strong corporate culture means a high level of consistency—that is, most employees can clearly articulate “how we do things around here.” A good corporate culture is one in which the members’ values and behavioral consistency are conducive to achieving the firm’s stated objectives. For example, a firm might be deemed to have a strong culture of blame if most people point THE JOURNAL OF PORTFOLIO M ANAGEMENT 3/18/15 1:20:15 PM .
fingers at others and expect colleagues to do the same when problems occur. This culture of blame would be deemed “bad” if the firm’s objective is to foster an environment of shared accountability focused on solving problems and improving results. In some situations, a strong culture of blame might be deemed “good” if the firm’s objective is to screen out thin-skinned individuals unskilled at assigning blame to others and def lecting it from themselves. WHY DID WE CHOOSE TO EXAMINE “BLAME” IN INVESTMENT ORGANIZATIONS? For this study we are specifically interested in examining blame as a cultural behavior in investment organizations, exploring the beliefs which drive it, and identifying the beliefs and behaviors it might induce. Ultimately, we are most interested in discerning links to firm-level outcomes, which matter to owners, as well as to current and prospective employees and clients. Our findings may additionally encourage investment consultants to rethink how they evaluate investment managers. A number of research efforts preceded ours. Dethmer et al. [2015] argue that blame, a powerful human motivator, is often the tool of choice for individuals in a position of power.
This raises the question whether blame, despite its negative connotations, might actually be an effective tool for creating (shortterm?) success for investment organizations. If not, why is blame as widely used as our investment industry data indicate? In an experimental study, Gurdal et al. [2013] find that people regularly assign “unjustified” blame to others for uncontrollable outcomes.
In other words, they blame others for what amounts to f lipping “tails” in a game of coin toss. Unjustified blame is particularly unproductive, because it cannot modify behaviors in a useful way, but has toxic consequences. This tendency intensifies when there is a meaningful stake attached to the random outcome.
In the investment industry, where short-term performance is largely random, yet has significant impact on firm profits and compensation (Goyal and Wahal [2008] and Penfold [2012]), unjustified blame might be particularly prevalent. For asset owners and their consultants, the pertinent question is whether managers with a strong culture of blame might be less successful at producing alpha. Could it be that, although blame is undesirable for rankand-file employees, it is nonetheless an effective device for generating superior returns for clients and, consequently, profits for the business owners? The literature on managing knowledge workers consistently argues for an environment that fosters personal accountability, creativity, and learning (Pink [2009]). The psychology literature amply demonstrates the linkage between blame and fear, on one hand, and defensiveness, on the other. Neuroscience finds that fear shuts down the part of the brain responsible for creative problem solving, while organizational behavior studies find that defensiveness inhibits high-level learning and accountability.3 Summarizing 22 prior studies in a metastudy, Tennen and Aff leck [1990] find that “blaming is ineffective at best, and more likely to be harmful.” Thus, cross-discipline research indicates that a culture of blame could have a significant negative impact on the effectiveness of financial analysts and portfolio managers, leading to poor long-term performance. Indeed, it appears that the market presupposes that a culture of blame is linked to firm performance.
In an event study around earning misses, Lee et al. [2004] find that companies which owned their mistakes suffered less stock price punishment than organizations that blamed external factors. WHAT DID WE FIND? THE PUNCHLINE FIRST We embarked on this research with a prior belief that blame is harmful for the stakeholders of investment organizations. Using a unique and robust dataset, we find that blame induces defensiveness and reduces collaboration, openness, and learning in the culture of investment organizations.
This then results in poor operating performance, poor employee engagement, and poor client experience. We do not have data allowing us to link blame directly with long-term alpha production. The firms in the database do not report excess returns relative to their managed portfolios’ benchmarks and, because most of the survey responses are anonymous, we are unable to extract their investment results from performance databases. However, respondents provide qualitative assessments of their firm’s performance relative to peers.
Additionally, we have variables that are arguably THE FOLLY OF BLAME : WHY I NVESTORS SHOULD CARE ABOUT THEIR M ANAGERS’ CULTURE JPM-HSU.indd 24 SPRING 2015 3/18/15 1:20:15 PM . must-have factors for alpha generation, such as employee loyalty, employee engagement, and the ability to attract talent. These observations and interviews with seasoned employees help us establish that blame has a significant negative effect on expected alpha. OUR SUGGESTION: CULTURE SHOULD BE A FACTOR IN INVESTMENT MANAGER SELECTION Although identifying top quartile managers remains difficult, investment consultants have developed some reliable predictors for poor investment results. Case studies suggest that deficiencies in talent retention, investment philosophy, compensation scheme, ownership structure, and succession planning hurt long-term investment results. Accordingly, some consultants focus on these attributes when conducting due diligence. Asset owners and consultants may wish to explore the culture of investment management firms for additional insights on their alpha prospects. Our findings demonstrate that the fear of being blamed could drive counterproductive behaviors that are potentially harmful to long-term investment results.4 Insofar as a blame culture could be measured during the due diligence process, consultants might be able to help investors win the “loser’s game” (Ellis [2009]). DETAILS OF OUR CROSS-SECTIONAL EMPIRICAL STUDY: DATA, METHODOLOGY, AND RESULTS We are not exclusively interested in understanding whether identifying a culture of blame would be useful in predicting investment performance directly.
We are also interested in the implications of a culture of blame for other dimensions of stakeholder satisfaction. Profitability has a significant effect on organizational resourcing and stability, and employee happiness and client servicing quality also contribute meaningfully to firm success. Beyond manager selection, the analysis would also 1) potentially inform owners/shareholders about how to improve profits and 2) advise current and prospective employees on career choices. In our study we use a proprietary database provided by Focus Consulting Group (FCG), which has been collecting data on investment organizations’ culture and firm level outcomes for more than a decade. Ref lecting SPRING 2015 JPM-HSU.indd 25 the views of 3,245 respondents, the survey covers 70 investment organizations with assets under management ranging from U.S.
$200 million to $124 billion, with an average of $17 billion. We have also been given access to free-form responses from FCG’s annual culture survey, as well as opportunities to interview senior executives at the firms included in the sample. The database allows us to rigorously gauge the strength of blame in the corporate culture and then correlate that characteristic with a variety of measurable firm attributes and outcomes, including self-reported scores on loyalty to the firm, firm attractiveness to outside talent, and success relative to other firms, among others. For every firm, the firm-level score is aggregated from confidential responses of the individual professionals working there.
The response rates are generally around 90%, and we do not detect any obvious bias in the individuals’ anonymous scoring of their own firms.5 The raw FCG data items are either objective firm characteristics such as headcount, number of respondents, and assets under management, or subjective assessments provided by the respondents about their employers. Specifically, there are variables that correspond to firm attributes and firm outcomes. In this article, we use “attribute” to describe the firm’s culture, environment, or character. We use “outcome” to capture a firm’s success (or lack thereof ) along various key dimensions.
Each employee at a participating investment organization was asked to select the ten culture attributes that best describe the firm from a list of 65 options. Some of the negative attributes include blame, gossip, entitlement, and manipulation. Positive attributes include collaboration/teamwork, openness to new ideas, passion, and innovation.
More neutral attributes, such as disciplined, efficient, and independent, were also included. The top 10 attributes selected, however, are not additionally ranked. For example, if 60% of all respondents for firm X select blame as a top 10 attribute, the strength of blame culture for firm X would be recorded as 0.60, on a range of 0.0 to 1.0.
Appendix A contains further information on the FCG data collection methodology and the data items available. Many of the attribute options are related in what they convey. For example, open-minded and curious both capture associated firm culture attributes. Others are correlated because they are two sides of the same coin.
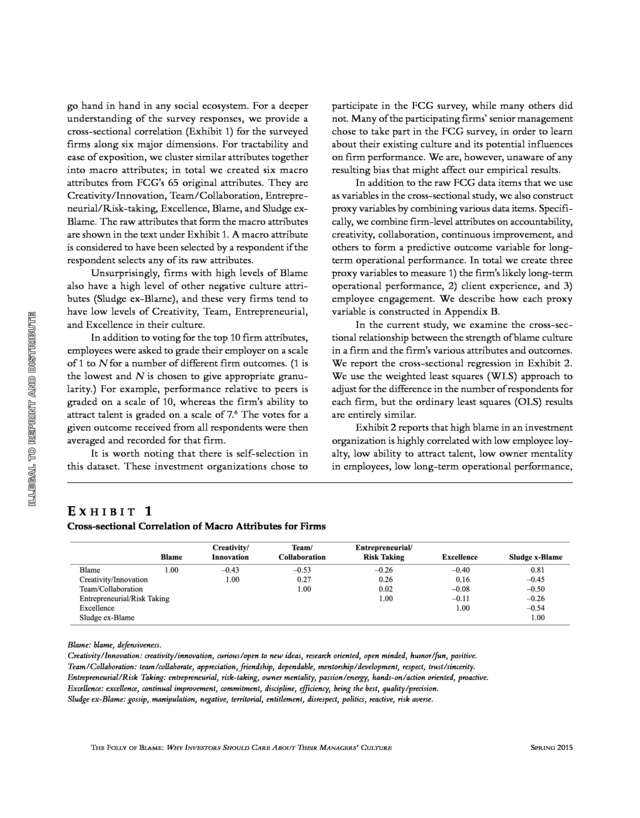
For example, blame and defensiveness generally THE JOURNAL OF PORTFOLIO M ANAGEMENT 3/18/15 1:20:15 PM . go hand in hand in any social ecosystem. For a deeper understanding of the survey responses, we provide a cross-sectional correlation (Exhibit 1) for the surveyed firms along six major dimensions. For tractability and ease of exposition, we cluster similar attributes together into macro attributes; in total we created six macro attributes from FCG’s 65 original attributes. They are Creativity/Innovation, Team/Collaboration, Entrepreneurial/Risk-taking, Excellence, Blame, and Sludge exBlame.
The raw attributes that form the macro attributes are shown in the text under Exhibit 1. A macro attribute is considered to have been selected by a respondent if the respondent selects any of its raw attributes. Unsurprisingly, firms with high levels of Blame also have a high level of other negative culture attributes (Sludge ex-Blame), and these very firms tend to have low levels of Creativity, Team, Entrepreneurial, and Excellence in their culture. In addition to voting for the top 10 firm attributes, employees were asked to grade their employer on a scale of 1 to N for a number of different firm outcomes. (1 is the lowest and N is chosen to give appropriate granularity.) For example, performance relative to peers is graded on a scale of 10, whereas the firm’s ability to attract talent is graded on a scale of 7.6 The votes for a given outcome received from all respondents were then averaged and recorded for that firm. It is worth noting that there is self-selection in this dataset.
These investment organizations chose to participate in the FCG survey, while many others did not. Many of the participating firms’ senior management chose to take part in the FCG survey, in order to learn about their existing culture and its potential inf luences on firm performance. We are, however, unaware of any resulting bias that might affect our empirical results. In addition to the raw FCG data items that we use as variables in the cross-sectional study, we also construct proxy variables by combining various data items.
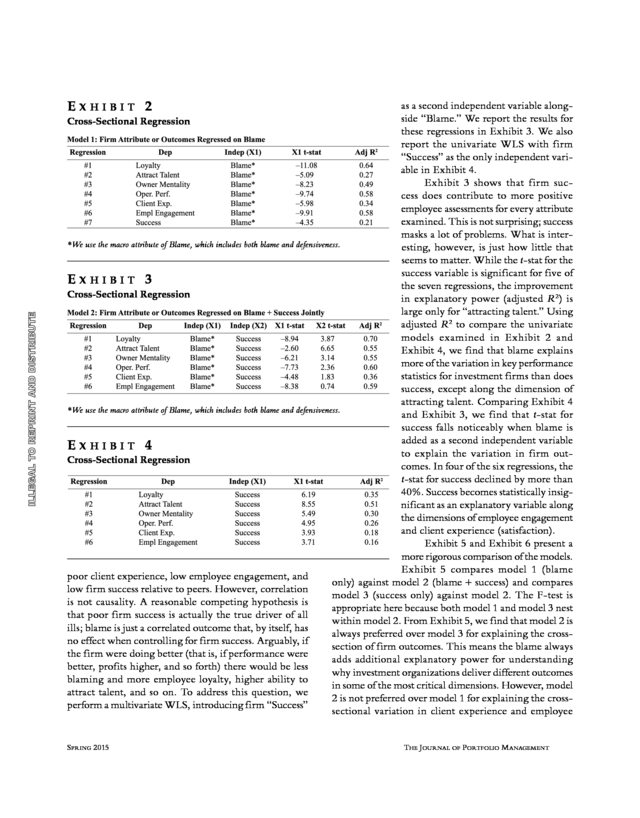
Specifically, we combine firm-level attributes on accountability, creativity, collaboration, continuous improvement, and others to form a predictive outcome variable for longterm operational performance. In total we create three proxy variables to measure 1) the firm’s likely long-term operational performance, 2) client experience, and 3) employee engagement. We describe how each proxy variable is constructed in Appendix B. In the current study, we examine the cross-sectional relationship between the strength of blame culture in a firm and the firm’s various attributes and outcomes. We report the cross-sectional regression in Exhibit 2. We use the weighted least squares (WLS) approach to adjust for the difference in the number of respondents for each firm, but the ordinary least squares (OLS) results are entirely similar. Exhibit 2 reports that high blame in an investment organization is highly correlated with low employee loyalty, low ability to attract talent, low owner mentality in employees, low long-term operational performance, EXHIBIT 1 Cross-sectional Correlation of Macro Attributes for Firms Blame: blame, defensiveness. Creativity/Innovation: creativity/innovation, curious/open to new ideas, research oriented, open minded, humor/fun, positive. Team/Collaboration: team/collaborate, appreciation, friendship, dependable, mentorship/development, respect, trust/sincerity. Entrepreneurial/Risk Taking: entrepreneurial, risk-taking, owner mentality, passion/energy, hands-on/action oriented, proactive. Excellence: excellence, continual improvement, commitment, discipline, efficiency, being the best, quality/precision. Sludge ex-Blame: gossip, manipulation, negative, territorial, entitlement, disrespect, politics, reactive, risk averse. THE FOLLY OF BLAME : WHY I NVESTORS SHOULD CARE ABOUT THEIR M ANAGERS’ CULTURE JPM-HSU.indd 26 SPRING 2015 3/18/15 1:20:15 PM .
EXHIBIT 2 as a second independent variable alongside “Blame.” We report the results for Cross-Sectional Regression these regressions in Exhibit 3. We also report the univariate WLS with firm “Success” as the only independent variable in Exhibit 4. Exhibit 3 shows that firm success does contribute to more positive employee assessments for every attribute examined. This is not surprising; success masks a lot of problems. What is inter*We use the macro attribute of Blame, which includes both blame and defensiveness. esting, however, is just how little that seems to matter.
While the t-stat for the success variable is significant for five of EXHIBIT 3 the seven regressions, the improvement Cross-Sectional Regression in explanatory power (adjusted R 2 ) is large only for “attracting talent.” Using adjusted R 2 to compare the univariate models examined in Exhibit 2 and Exhibit 4, we find that blame explains more of the variation in key performance statistics for investment firms than does success, except along the dimension of attracting talent. Comparing Exhibit 4 *We use the macro attribute of Blame, which includes both blame and defensiveness. and Exhibit 3, we find that t-stat for success falls noticeably when blame is added as a second independent variable EXHIBIT 4 to explain the variation in firm outCross-Sectional Regression comes. In four of the six regressions, the t-stat for success declined by more than 40%.
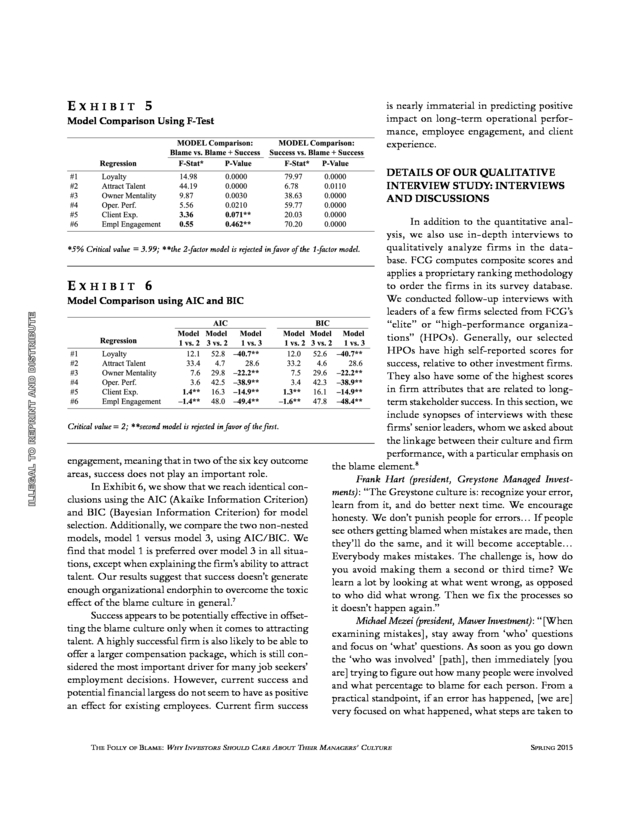
Success becomes statistically insignificant as an explanatory variable along the dimensions of employee engagement and client experience (satisfaction). Exhibit 5 and Exhibit 6 present a more rigorous comparison of the models. Exhibit 5 compares model 1 (blame poor client experience, low employee engagement, and only) against model 2 (blame + success) and compares low firm success relative to peers. However, correlation model 3 (success only) against model 2. The F-test is is not causality.
A reasonable competing hypothesis is appropriate here because both model 1 and model 3 nest that poor firm success is actually the true driver of all within model 2. From Exhibit 5, we find that model 2 is ills; blame is just a correlated outcome that, by itself, has always preferred over model 3 for explaining the crossno effect when controlling for firm success. Arguably, if section of firm outcomes.
This means the blame always the firm were doing better (that is, if performance were adds additional explanatory power for understanding better, profits higher, and so forth) there would be less why investment organizations deliver different outcomes blaming and more employee loyalty, higher ability to in some of the most critical dimensions. However, model attract talent, and so on. To address this question, we 2 is not preferred over model 1 for explaining the crossperform a multivariate WLS, introducing firm “Success” sectional variation in client experience and employee SPRING 2015 JPM-HSU.indd 27 THE JOURNAL OF PORTFOLIO M ANAGEMENT 3/18/15 1:20:16 PM .
EXHIBIT 5 Model Comparison Using F-Test is nearly immaterial in predicting positive impact on long-term operational performance, employee engagement, and client experience. DETAILS OF OUR QUALITATIVE INTERVIEW STUDY: INTERVIEWS AND DISCUSSIONS In addition to the quantitative analysis, we also use in-depth interviews to qualitatively analyze firms in the data*5% Critical value = 3.99; **the 2-factor model is rejected in favor of the 1-factor model. base. FCG computes composite scores and applies a proprietary ranking methodology to order the firms in its survey database. EXHIBIT 6 We conducted follow-up interviews with Model Comparison using AIC and BIC leaders of a few firms selected from FCG’s “elite” or “high-performance organizations” (HPOs). Generally, our selected HPOs have high self-reported scores for success, relative to other investment firms. They also have some of the highest scores in firm attributes that are related to longterm stakeholder success. In this section, we include synopses of interviews with these Critical value = 2; **second model is rejected in favor of the first. firms’ senior leaders, whom we asked about the linkage between their culture and firm performance, with a particular emphasis on engagement, meaning that in two of the six key outcome the blame element.8 areas, success does not play an important role. Frank Hart (president, Greystone Managed InvestIn Exhibit 6, we show that we reach identical conments): “The Greystone culture is: recognize your error, clusions using the AIC (Akaike Information Criterion) learn from it, and do better next time.
We encourage and BIC (Bayesian Information Criterion) for model honesty. We don’t punish people for errors… If people selection. Additionally, we compare the two non-nested see others getting blamed when mistakes are made, then models, model 1 versus model 3, using AIC/BIC.
We they’ll do the same, and it will become acceptable… find that model 1 is preferred over model 3 in all situaEverybody makes mistakes. The challenge is, how do tions, except when explaining the firm’s ability to attract you avoid making them a second or third time? We talent. Our results suggest that success doesn’t generate learn a lot by looking at what went wrong, as opposed enough organizational endorphin to overcome the toxic to who did what wrong.
Then we fix the processes so effect of the blame culture in general.7 it doesn’t happen again.” Success appears to be potentially effective in offsetMichael Mezei (president, Mawer Investment): “[When ting the blame culture only when it comes to attracting examining mistakes], stay away from ‘who’ questions talent. A highly successful firm is also likely to be able to and focus on ‘what’ questions. As soon as you go down offer a larger compensation package, which is still conthe ‘who was involved’ [path], then immediately [you sidered the most important driver for many job seekers’ are] trying to figure out how many people were involved employment decisions.
However, current success and and what percentage to blame for each person. From a potential financial largess do not seem to have as positive practical standpoint, if an error has happened, [we are] an effect for existing employees. Current firm success very focused on what happened, what steps are taken to THE FOLLY OF BLAME : WHY I NVESTORS SHOULD CARE ABOUT THEIR M ANAGERS’ CULTURE JPM-HSU.indd 28 SPRING 2015 3/18/15 1:20:17 PM .
remediate it and what learnings are we going to apply— what are we going to do differently and what process are we going to change for next time.” Fred Martin (president and CIO of Disciplined Growth Investors): “I think if the head of a firm wants to measure the blame factor, he needs to look in the mirror. If he’s engaged in blame, then his firm will be engaged in blame. It starts at the top. The top person has to follow the suggestions of being open, curious, and accountable… I know my guys are smart.
If I beat them up on their mistakes—and we don’t win on all our stocks— they would slowly buy less controversial stocks and it would hurt our long-term numbers. We actively practice forgiving mistakes, just letting go. That is something that really helps us.” Donna Merchant (head of human resources at American Beacon): “[You have] to negate blame to have that entrepreneurial spirit to step out on the line in order to achieve more.
With risk comes reward. We have to foster a culture where our people are not afraid to think outside of the box and try something new.” Paul Gerla (CEO of Kempen Capital): “When you grow the way we have grown, and you get more complexity, [you really need to] spend the time to be open and curious, to celebrate successes but also, when failures come, to foster continual improvement rather than blaming. When we have these moments where we are very defensive, we say, ‘Hey, listen, I think we should become open and curious again.’ It really helps to have this knowledge [on the dynamics between blame and learning].” In addition to interviewing leaders of high performing investment firms, we studied the FCG database of interview transcripts, as well as free responses from the low-performing firms.
The common themes in blame-oriented cultures are fear and low morale. We provide a few anonymous quotes from professionals at these blame-oriented firms.9 First, we focus on responses that touch on leadership and how it contributes to the blame culture. We observe lower selfawareness in the leadership ranks of low-performing organizations. Anonymous response #1: “The company’s culture is in crisis and will require substantial changes. It needs to begin at the level of the CEO.
[It] is common for the CEO to argue against research analysts in meetings, often resulting in somewhat of a public berating. This tends to SPRING 2015 JPM-HSU.indd 29 generate animosity, discourage any open dialogue from occurring, and inherently puts each analyst into defensiveness at meetings. Research analysts have asked about the CEO’s mood prior to meeting with him in order to prepare mentally… [Most] individuals in research would leave if given a reasonable opportunity.” Anonymous response #2: “As far as the senior team goes, most are unapproachable and [when they do get involved as issues arise], they are [blame-oriented]. Instead of building up individuals and teams, there seems to be a process of knocking them down.
This has been going on for quite some time. As far as initiative and risk taking, I believe most employees are happy to just sit in their cubicles [and duck their heads]… Loyalty, firm-wide, has deteriorated. Anonymous response #3: “[The firm has] actually two cultures: employees and management (mostly portfolio managers). PMs take credit when things go well and blame analysts when things go wrong.
[As a result], there is little ‘collaboration’ between PMs and analysts. PMs used to be f lat-out hostile toward the employees, but recent defections have caused them to bite their lips. Very few people are happy here.” The following responses provide additional insights on how blame might create disengagement in professionals, as well as other workplace dysfunctions. Anonymous response #4: “The culture here is very blame-oriented. And after a while, there is a learned helplessness that sets in with people. At my prior job—a hedge fund—the environment was demanding but fair. I felt like I was performing at about 90% of my effectiveness.
Here I am at 30%, tops. I will leave for another job as soon as an opportunity arises.”10 Anonymous response #5: “The regular assignment of blame when things go wrong has led to an environment where many employees operate in fear of making mistakes. Employees are encouraged to ‘throw each other under the bus’ in order to make us collectively better and more efficient, a management style that is effective in some ways but fosters resentment and paranoia. Employees regularly disparage other employees—even at the very highest levels.
[This seems to create] a great deal of territoriality, especially at the highest levels: a “my group is better/smarter/more important” than your group mentality… Morale is generally low.” Anonymous response #6: “There is a lot of gossip around [the] office and everyone is quick to assign blame THE JOURNAL OF PORTFOLIO M ANAGEMENT 3/18/15 1:20:17 PM . instead of pitching in to help each other. It feels like everyone is always trying to uncover someone else’s wrongdoing or mistake, instead of just doing their work. No training or mentoring, [instead wasting time] tracking why someone was out due to bereavement, and so forth. […] [It is] hard to stay motivated.” Anonymous response #7: “I feel the culture at [the firm] encourages the fear of blame.
I feel that people are afraid to be found having made a mistake. No one wants to make a mistake. Instead of using [mistakes] to improve processes and procedures, they simply are black marks on a person.
I don’t feel that employees feel secure in our positions. We feel vulnerable all the time.” In the following responses, we get a glimpse into the experience of potentially unjustified blaming for short-term noise. Anonymous response #8: “While we claim to stand for long-term performance, our PMs are constantly asking about quarterly performance. Sometimes I will get an email the day before an [earnings announcement] asking what I expect for earnings and whether we should trade the stock.
If earnings do surprise and the stock trades up or down, I get blamed for not being on top of it.” Anonymous response #9: “This culture is toxic. When [portfolio managers] have success, it is all due to their brilliance. When they underperform, we analysts get blamed. It even extends to not owning the better stocks.
We [constantly] get drilled in our weekly meetings about why we don’t own a name that is up 20%.” Anonymous response #10: “We have a culture of fear and distrust. There lacks genuine respect for the people and for their intellect. [Instead], the idea that you are only as good as your last call is prevalent.
The comp structure, which rewards short-term outcomes [and ignores long-term contributions], seems to support an unhealthy competition amongst peers and encourage bad-mouthing peers. The investment leadership seems to always be at odds with one another, which makes decisions contentious [with a lot of second guessing].” Although anonymity and confidentiality hinder more substantial discussion regarding firms with highblame cultures, it is nonetheless important to acknowledge that only 12% of the firms in the sample would be classified as having strong, healthy cultures, while a significant percentage would be classified as having meaningful culture dysfunctions, including the strong presence of blame. DISCUSSION We find that blame is strongly associated with a variety of undesirable firm attributes and can be predictive of poor stakeholder outcomes for investment organizations. What we have learned from leaders of selected high-performing investment organizations also confirms that blame inhibits honesty, learning, risk-taking, and the willingness to improve.
In the data as well as the interviews, we find that blame increases defensiveness and fear. Senior managers’ condoning or leading with blame also spurs imitation under the pretense of organizational accountability. When blame and the associated culture elements of fear, defensiveness, and righteousness are dominant, self-reported scores on personal accountability, creativity, and learning in organizations fall substantially below average. Indeed, one could imagine that in an investment organization with a strong blame culture, people could take joy in second-guessing investment decisions after poor short-term performance.
Whether it is the board blaming the investment staff at a pension fund or the client-facing team blaming the portfolio management group at an asset management firm, the logical selfprotective moves are to def lect blame onto others or to hide poor results. People are unlikely to display personal accountability and proactively identify problems where they play a part. Moreover, anecdotal evidence indicates that when blame is high, people can be unwilling to speak out about problems because they don’t want to get other people in trouble or be viewed as grinding an axe.
It is hard to imagine long-term investment success from an organization steeped in blame. On the other hand, evidence suggests that superior long-term investment results arise with higher probability from organizations that 1) do not create fear around identified problems, 2) debate problems with openness and without blame, 3) emphasize fixing problems, and 4) focus on learning to avoid similar mistakes in the future. It then bears asking why a blame culture could persist in an industry that is based on rational decision-making and focused on long-term success. Why might organizations filled with avid learners create a culture that shuts down learning while encouraging defensiveness? We do not find evidence that senior leaders set out to create a culture of blame. What appears to be a driver of the blame culture, in some instances, is actually a bungled attempt to create more accountability by THE FOLLY OF BLAME : WHY I NVESTORS SHOULD CARE ABOUT THEIR M ANAGERS’ CULTURE JPM-HSU.indd 30 SPRING 2015 3/18/15 1:20:17 PM .
defaulting to the age-old formula: find out who messed up and blame them as quickly as possible. In the words of one CEO, “A public hanging is a good thing now and then.” Additionally, highly intelligent and competitive people often have the greatest need to be right (Ware et al. [2006] and Argyris [2008]). Organizations that are plagued with fault-finding probably subconsciously value being right more than learning.
Indeed, perhaps we blame others precisely to satisfy the ego’s need to be right. Debates whose purpose is to prove oneself right and others wrong reduce the possibility for learning and improving. People who focus on appearing to have the truth are implicitly committed to seeing only one side of the issue and looking only for confirming evidence. Unjustified blame is particularly counterproductive.
The investment management industry is one where short-term results provide little or no information on the true quality of the product. Leaders in this or any other industry are simply human and therefore driven by typical human tendencies.11 Nonetheless, a culture of blame in an environment where outcomes are random might engender perverse behaviors, such as closet indexing and year-end window-dressing, as well as nonsensical behaviors such as spending resources on developing coinf lipping skills, rather than a sound grasp of investment science and statistics. This hardly seems like a recipe for creating long-term investment success. CONCLUSION Our objective in this research article is not to provide a prescription for eliminating blame in the corporate culture.12 Rather, it is to provide quantitative analyses using a cross-sectional approach (a technique that is familiar to the finance industry) and qualitative analyses through in-depth interviews with industry professionals (a technique that is widely used in the social sciences) to demonstrate that blame is both prevalent in the investment industry and toxic to the success of investment organizations.
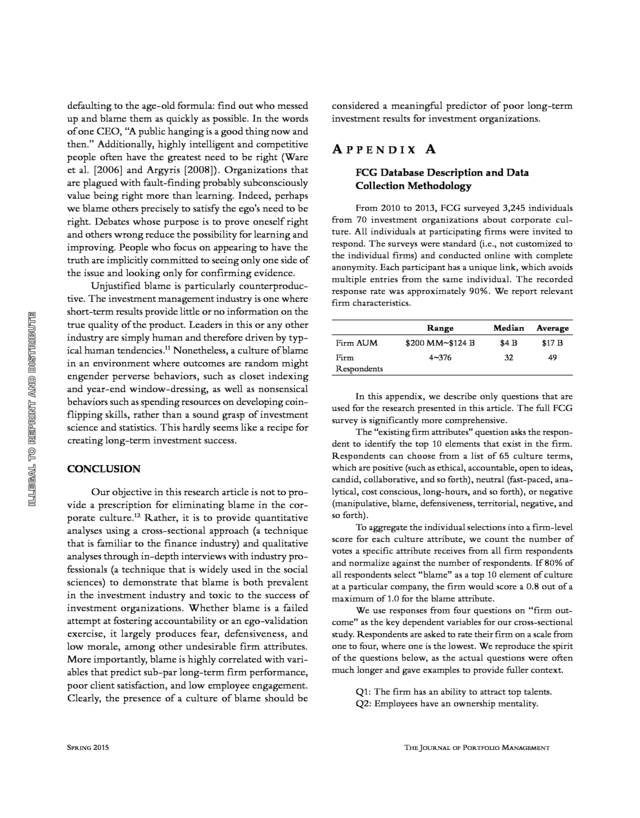
Whether blame is a failed attempt at fostering accountability or an ego-validation exercise, it largely produces fear, defensiveness, and low morale, among other undesirable firm attributes. More importantly, blame is highly correlated with variables that predict sub-par long-term firm performance, poor client satisfaction, and low employee engagement. Clearly, the presence of a culture of blame should be SPRING 2015 JPM-HSU.indd 31 considered a meaningful predictor of poor long-term investment results for investment organizations. APPENDIX A FCG Database Description and Data Collection Methodology From 2010 to 2013, FCG surveyed 3,245 individuals from 70 investment organizations about corporate culture. All individuals at participating firms were invited to respond. The surveys were standard (i.e., not customized to the individual firms) and conducted online with complete anonymity.
Each participant has a unique link, which avoids multiple entries from the same individual. The recorded response rate was approximately 90%. We report relevant firm characteristics. Range Median Average Firm AUM $200 MM~$124 B $4 B $17 B Firm Respondents 4~376 32 49 In this appendix, we describe only questions that are used for the research presented in this article.
The full FCG survey is significantly more comprehensive. The “existing firm attributes” question asks the respondent to identify the top 10 elements that exist in the firm. Respondents can choose from a list of 65 culture terms, which are positive (such as ethical, accountable, open to ideas, candid, collaborative, and so forth), neutral (fast-paced, analytical, cost conscious, long-hours, and so forth), or negative (manipulative, blame, defensiveness, territorial, negative, and so forth). To aggregate the individual selections into a firm-level score for each culture attribute, we count the number of votes a specific attribute receives from all firm respondents and normalize against the number of respondents. If 80% of all respondents select “blame” as a top 10 element of culture at a particular company, the firm would score a 0.8 out of a maximum of 1.0 for the blame attribute. We use responses from four questions on “firm outcome” as the key dependent variables for our cross-sectional study. Respondents are asked to rate their firm on a scale from one to four, where one is the lowest.
We reproduce the spirit of the questions below, as the actual questions were often much longer and gave examples to provide fuller context. Q1: The firm has an ability to attract top talents. Q2: Employees have an ownership mentality. THE JOURNAL OF PORTFOLIO M ANAGEMENT 3/18/15 1:20:18 PM . Q3: I am unlikely to leave the firm for a similar opportunity elsewhere. Q4: The firm is successful relative to other firms. We note that respondents could interpret Q4 as better investment performance or better financial performance, among other possibilities. However, insofar as investment organizations’ financial performance is highly tied to their investment performance, we feel that the question captures a meaningful assessment of investment performance. For each firm, we compute its average scores for the four employee assessment questions. In addition, for each question on the survey, the employees were encouraged to provide additional responses to further explain their answers. This gives us deeper insight into the mechanism that links blame and risk aversion, for instance. Every respondent selects 10 top firm attributes.
We assign a value of +1/−1 if a selected attribute falls into the above +1/−1 categories; otherwise we assigns a value of 0 to the selected attribute. The 10 selections are summed to create a long-term score that is predictive of operational performance assessed by respondent i. Note that the maximum score possible is +10 and the minimum is −4.
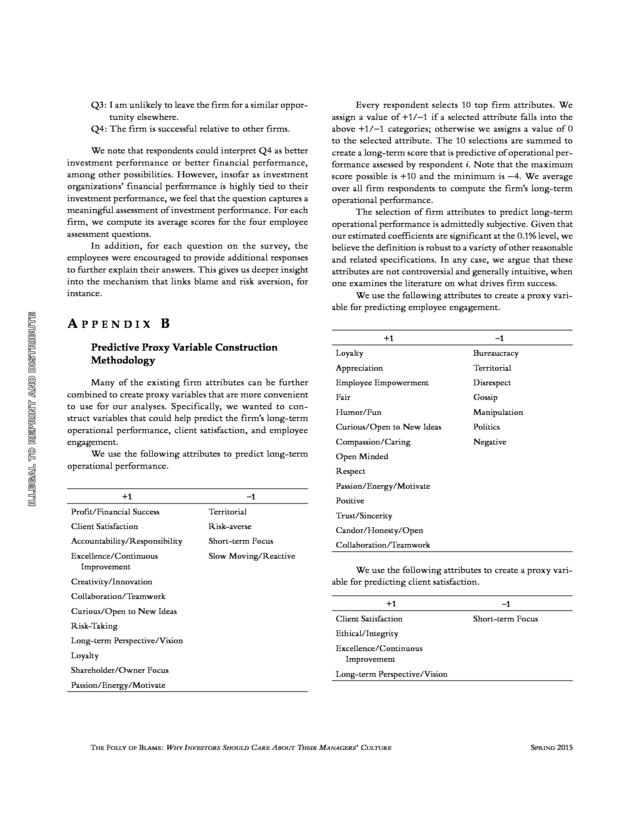
We average over all firm respondents to compute the firm’s long-term operational performance. The selection of firm attributes to predict long-term operational performance is admittedly subjective. Given that our estimated coefficients are significant at the 0.1% level, we believe the definition is robust to a variety of other reasonable and related specifications. In any case, we argue that these attributes are not controversial and generally intuitive, when one examines the literature on what drives firm success. We use the following attributes to create a proxy variable for predicting employee engagement. APPENDIX B +1 Predictive Proxy Variable Construction Methodology Many of the existing firm attributes can be further combined to create proxy variables that are more convenient to use for our analyses.
Specifically, we wanted to construct variables that could help predict the firm’s long-term operational performance, client satisfaction, and employee engagement. We use the following attributes to predict long-term operational performance. −1 Loyalty Bureaucracy Appreciation Territorial Employee Empowerment Disrespect Fair Gossip Humor/Fun Manipulation Curious/Open to New Ideas Politics Compassion/Caring Negative Open Minded Respect Passion/Energy/Motivate −1 +1 Positive Profit/Financial Success Territorial Trust/Sincerity Client Satisfaction Risk-averse Candor/Honesty/Open Accountability/Responsibility Short-term Focus Collaboration/Teamwork Excellence/Continuous Improvement Slow Moving/Reactive Creativity/Innovation Collaboration/Teamwork Curious/Open to New Ideas Risk-Taking Long-term Perspective/Vision We use the following attributes to create a proxy variable for predicting client satisfaction. +1 Client Satisfaction −1 Short-term Focus Ethical/Integrity Loyalty Excellence/Continuous Improvement Shareholder/Owner Focus Long-term Perspective/Vision Passion/Energy/Motivate THE FOLLY OF BLAME : WHY I NVESTORS SHOULD CARE ABOUT THEIR M ANAGERS’ CULTURE JPM-HSU.indd 32 SPRING 2015 3/18/15 1:20:18 PM . Some attributes are used in multiple proxies. However, the three proxy variables are not highly correlated and contain independent information relative to each other. ENDNOTES We thank Limin Xiao and Chris Ariza for their research assistance and Charley Ellis, Philip Lawton, John St. Hill, and anonymous referees for their comments. 1 This assessment is based on our examination of a large number of RFPs and our conversations with investment consultants. 2 Our definitions are adopted from the web encyclopedia provided by the University of Rhode Island’s Schmidt Labor Research Center. www.uri.edu/research/lrc/scholl/ webnotes/Culture.htm. 3 See Goleman [2005] for a comprehensive treatment. 4 Similarly, cases studies have questioned why pension funds and portfolio managers do not rebalance into risk assets after large price declines, given the documented long-term price mean-reversion pattern (Ang and Kjaer [2012]).
Most practitioners would readily acknowledge that the driver of this behavior is based in organizational politics, rather than in investment conviction. In 2009, the investment decision to rebalance into financial stocks and high-yield bonds was arguably sensible ex ante, but simply carried too much risk of ex post blame. 5 There are no obvious benefits or harms to the firm for scoring high or low along the various culture attributes. We also have no reason to believe that respondents had incentives to manipulate the survey; the results are 100% confidential, offering complete individual anonymity within the firm and complete firm anonymity externally. 6 In the survey, the grading scale is additionally associated by descriptive text such as 1 (Strongly disagree) or 7 (Strongly agree) to further help respondents address the various scale-oriented questions. 7 In interviews, FCG executives report having clients who had experienced performance success and financial success but had very blame-oriented cultures, suggesting that success is not the panacea for toxic cultures.
Typically, these clients’ success is not sustained. In each case, the toxic firms lost valuable talent, which led to mediocre subsequent performance. 8 Understandably, low-performing firms are less interested in being interviewed and having their culture dysfunctions publicly analyzed. 9 We edited the negative comments more aggressively and combined some comments from various responses from the same person to related questions. Exposition and specific references are sometimes edited for brevity and confidentiality. SPRING 2015 JPM-HSU.indd 33 10 This person left soon after the interview, without a job prospect. 11 Charley Ellis commented to us, “The investment industry does appear to be rational and intellectual, but we are all human and, under pressure, emotions often dominate.” 12 See Ware et al.
[2006] on ways to reduce blame in organizations. REFERENCES Aguirre, D., R. von Post, and M. Alpern.
“Culture’s Role in Enabling Organizational Change.” Strategy & White Paper (2013). www.strategyand.pwc.com/global/home/what-wethink/reports-white-papers/article-display/cultures-roleorganizational-change. Ang, A., and K.N. Kjaer.
“Investing for the Long Run.” Netspar Discussion Paper No.11/2011-104. Available at SSRN: http://ssrn.com/absract=1976310 ( January 5, 2012). Argyris, C. Teaching Smart People How to Learn.
Cambridge, MA: Harvard Business Classics, 2008. Beer, M., and N. Nohria. “Cracking the Code of Change.” Harvard Business Review, Vol.
78, No. 3 (May 2000), pp. 133-141. Camerer, C., and R. Weber.
“Cultural Conf lict and Merger Failure: An Experimental Approach.” USC CLEO Research Paper No. C01-10, 2001, ssrn.com/abstract=276288 or dx.doi. org/10.2139/ssrn.276288. Dethmer, J., D. Chapman, and K.
Klemp. The 15 Commitments of Conscious Leadership: A New Paradigm for Sustainable Success. (2015). Ellis, C.
Capital: The Story of Long-Term Investment Excellence. Hoboken, NJ: John Wiley & Sons, 2004. ——. Winning the Loser’s Game: Timeless Strategies for Successful Investing. New York: McGraw-Hill, 2009. Goleman, D.
Emotional Intelligence: Why It Can Matter More Than IQ. New York: Bantam Books, 2005. Goyal, A., and S. Wahal.
“The Selection and Termination of Investment Management Firms by Plan Sponsors” Journal of Finance, Vol. 63, No. 4 (August 2008), pp.
1805-1847. Gurdal, M., J. Miller, and A. Rustichini.
“Why Blame?” Working Paper. Coventry, U.K.: University of Warwick, Warwick Economics Research Papers Series (TWERPS), Vol. 2013, No.
1022, 2013. THE JOURNAL OF PORTFOLIO M ANAGEMENT 3/18/15 1:20:18 PM . Kets de Vries, M., L. Guillen, and K. Korotov. “Organizational Culture, Leadership, Change, and Stress.” INSEAD Working Paper No.
2009/10/EFE/IGLC, February, 2009, ssrn.com/ abstract=1338709 or dx.doi.org/10.2139/ssrn.1338709. Killingsworth, S. “Modeling the Message: Communicating Compliance Through Organizational Values and Culture.” Georgetown Journal of Legal Ethics, Vol. 25, No.
4 (Fall 2012), pp. 961-988. Lyons, R., J. Chatman, and C.
Joyce. “Innovation in Services: Corporate Culture and Investment Banking.” California Management Review, Vol. 50, No.
1 (Fall, 2007), pp. 174-191. Penfold, R. “The Cost of Trigger Happy Investing.” Towers Watson Client Letter, June, 2012.
www.towerswatson.com/ en/Insights/IC-Types/Survey-Research-Results/2012/06/ The-cost-of-trigger-happy-investing. Pink, D. Drive: The Surprising Truth About What Motivates Us. New York: Riverhead Books, 2009. Tennen, H., and G. Aff leck.
“Blaming Others for Threatening Events.” Psychological Bulletin, Vol. 108, No. 2 (September, 1990), pp.
209-232. Ware, J., J. Dethmer, J. Ziegler, and F.
Skinner. High Performing Investment Teams: How to Achieve Best Practices of Top Firms. Hoboken, NJ: John Wiley & Sons, 2006. To order reprints of this article, please contact Dewey Palmieri at dpalmieri@ iijournals.com or 212-224-3675. THE FOLLY OF BLAME : WHY I NVESTORS SHOULD CARE ABOUT THEIR M ANAGERS’ CULTURE JPM-HSU.indd 34 SPRING 2015 3/18/15 1:20:18 PM .
These facts suggest that, by and large, the industry and academia do not believe culture matters in a useful way. The investment industry’s lack of emphasis on culture contrasts interestingly with developments in other industries. According to a 2013 survey conducted by the Katzenbach Center (www.strategyand. pwc.com), 84% of 2,200 respondents from various industries report that “culture is critically important to success,” and 60% believe that “culture is more important to success than strategy and business model,” (Aguirre et al. [2013]). Lyons et al.
[2007] find that culture meaningfully inf luences innovation and client service. Kets de Vries et al. [2009] argue that, even when change is necessary to a firm’s survival, organizational renewal is impeded by a dysfunctional culture and a lack of senior level self-awareness. This contributes to the high failure rate for change initiatives (Beer and Nohria, [2000]) as well as for mergers involving firms with conf licting cultures (Camerer and Weber [2001]).
Killingsworth [2012] maintains that corporate culture has greater inf luence than do explicit rules and policies on ethical behavior and legal compliance. In this article, we adopt two standard operational definitions of culture.2 The first views culture as a manifest pattern of crossindividual behavioral consistency (CIBC), or the coherent way in which employees perform tasks, solve problems, resolve conf licts, and treat customers and colleagues. The second, complementary definition views culture as a set of informal values, norms, and beliefs that underlie the observed CIBC. Both definitions are useful for understanding the survey responses and the empirical results of our study. In our context, a strong corporate culture means a high level of consistency—that is, most employees can clearly articulate “how we do things around here.” A good corporate culture is one in which the members’ values and behavioral consistency are conducive to achieving the firm’s stated objectives. For example, a firm might be deemed to have a strong culture of blame if most people point THE JOURNAL OF PORTFOLIO M ANAGEMENT 3/18/15 1:20:15 PM .
fingers at others and expect colleagues to do the same when problems occur. This culture of blame would be deemed “bad” if the firm’s objective is to foster an environment of shared accountability focused on solving problems and improving results. In some situations, a strong culture of blame might be deemed “good” if the firm’s objective is to screen out thin-skinned individuals unskilled at assigning blame to others and def lecting it from themselves. WHY DID WE CHOOSE TO EXAMINE “BLAME” IN INVESTMENT ORGANIZATIONS? For this study we are specifically interested in examining blame as a cultural behavior in investment organizations, exploring the beliefs which drive it, and identifying the beliefs and behaviors it might induce. Ultimately, we are most interested in discerning links to firm-level outcomes, which matter to owners, as well as to current and prospective employees and clients. Our findings may additionally encourage investment consultants to rethink how they evaluate investment managers. A number of research efforts preceded ours. Dethmer et al. [2015] argue that blame, a powerful human motivator, is often the tool of choice for individuals in a position of power.
This raises the question whether blame, despite its negative connotations, might actually be an effective tool for creating (shortterm?) success for investment organizations. If not, why is blame as widely used as our investment industry data indicate? In an experimental study, Gurdal et al. [2013] find that people regularly assign “unjustified” blame to others for uncontrollable outcomes.
In other words, they blame others for what amounts to f lipping “tails” in a game of coin toss. Unjustified blame is particularly unproductive, because it cannot modify behaviors in a useful way, but has toxic consequences. This tendency intensifies when there is a meaningful stake attached to the random outcome.
In the investment industry, where short-term performance is largely random, yet has significant impact on firm profits and compensation (Goyal and Wahal [2008] and Penfold [2012]), unjustified blame might be particularly prevalent. For asset owners and their consultants, the pertinent question is whether managers with a strong culture of blame might be less successful at producing alpha. Could it be that, although blame is undesirable for rankand-file employees, it is nonetheless an effective device for generating superior returns for clients and, consequently, profits for the business owners? The literature on managing knowledge workers consistently argues for an environment that fosters personal accountability, creativity, and learning (Pink [2009]). The psychology literature amply demonstrates the linkage between blame and fear, on one hand, and defensiveness, on the other. Neuroscience finds that fear shuts down the part of the brain responsible for creative problem solving, while organizational behavior studies find that defensiveness inhibits high-level learning and accountability.3 Summarizing 22 prior studies in a metastudy, Tennen and Aff leck [1990] find that “blaming is ineffective at best, and more likely to be harmful.” Thus, cross-discipline research indicates that a culture of blame could have a significant negative impact on the effectiveness of financial analysts and portfolio managers, leading to poor long-term performance. Indeed, it appears that the market presupposes that a culture of blame is linked to firm performance.
In an event study around earning misses, Lee et al. [2004] find that companies which owned their mistakes suffered less stock price punishment than organizations that blamed external factors. WHAT DID WE FIND? THE PUNCHLINE FIRST We embarked on this research with a prior belief that blame is harmful for the stakeholders of investment organizations. Using a unique and robust dataset, we find that blame induces defensiveness and reduces collaboration, openness, and learning in the culture of investment organizations.
This then results in poor operating performance, poor employee engagement, and poor client experience. We do not have data allowing us to link blame directly with long-term alpha production. The firms in the database do not report excess returns relative to their managed portfolios’ benchmarks and, because most of the survey responses are anonymous, we are unable to extract their investment results from performance databases. However, respondents provide qualitative assessments of their firm’s performance relative to peers.
Additionally, we have variables that are arguably THE FOLLY OF BLAME : WHY I NVESTORS SHOULD CARE ABOUT THEIR M ANAGERS’ CULTURE JPM-HSU.indd 24 SPRING 2015 3/18/15 1:20:15 PM . must-have factors for alpha generation, such as employee loyalty, employee engagement, and the ability to attract talent. These observations and interviews with seasoned employees help us establish that blame has a significant negative effect on expected alpha. OUR SUGGESTION: CULTURE SHOULD BE A FACTOR IN INVESTMENT MANAGER SELECTION Although identifying top quartile managers remains difficult, investment consultants have developed some reliable predictors for poor investment results. Case studies suggest that deficiencies in talent retention, investment philosophy, compensation scheme, ownership structure, and succession planning hurt long-term investment results. Accordingly, some consultants focus on these attributes when conducting due diligence. Asset owners and consultants may wish to explore the culture of investment management firms for additional insights on their alpha prospects. Our findings demonstrate that the fear of being blamed could drive counterproductive behaviors that are potentially harmful to long-term investment results.4 Insofar as a blame culture could be measured during the due diligence process, consultants might be able to help investors win the “loser’s game” (Ellis [2009]). DETAILS OF OUR CROSS-SECTIONAL EMPIRICAL STUDY: DATA, METHODOLOGY, AND RESULTS We are not exclusively interested in understanding whether identifying a culture of blame would be useful in predicting investment performance directly.
We are also interested in the implications of a culture of blame for other dimensions of stakeholder satisfaction. Profitability has a significant effect on organizational resourcing and stability, and employee happiness and client servicing quality also contribute meaningfully to firm success. Beyond manager selection, the analysis would also 1) potentially inform owners/shareholders about how to improve profits and 2) advise current and prospective employees on career choices. In our study we use a proprietary database provided by Focus Consulting Group (FCG), which has been collecting data on investment organizations’ culture and firm level outcomes for more than a decade. Ref lecting SPRING 2015 JPM-HSU.indd 25 the views of 3,245 respondents, the survey covers 70 investment organizations with assets under management ranging from U.S.
$200 million to $124 billion, with an average of $17 billion. We have also been given access to free-form responses from FCG’s annual culture survey, as well as opportunities to interview senior executives at the firms included in the sample. The database allows us to rigorously gauge the strength of blame in the corporate culture and then correlate that characteristic with a variety of measurable firm attributes and outcomes, including self-reported scores on loyalty to the firm, firm attractiveness to outside talent, and success relative to other firms, among others. For every firm, the firm-level score is aggregated from confidential responses of the individual professionals working there.
The response rates are generally around 90%, and we do not detect any obvious bias in the individuals’ anonymous scoring of their own firms.5 The raw FCG data items are either objective firm characteristics such as headcount, number of respondents, and assets under management, or subjective assessments provided by the respondents about their employers. Specifically, there are variables that correspond to firm attributes and firm outcomes. In this article, we use “attribute” to describe the firm’s culture, environment, or character. We use “outcome” to capture a firm’s success (or lack thereof ) along various key dimensions.
Each employee at a participating investment organization was asked to select the ten culture attributes that best describe the firm from a list of 65 options. Some of the negative attributes include blame, gossip, entitlement, and manipulation. Positive attributes include collaboration/teamwork, openness to new ideas, passion, and innovation.
More neutral attributes, such as disciplined, efficient, and independent, were also included. The top 10 attributes selected, however, are not additionally ranked. For example, if 60% of all respondents for firm X select blame as a top 10 attribute, the strength of blame culture for firm X would be recorded as 0.60, on a range of 0.0 to 1.0.
Appendix A contains further information on the FCG data collection methodology and the data items available. Many of the attribute options are related in what they convey. For example, open-minded and curious both capture associated firm culture attributes. Others are correlated because they are two sides of the same coin.
For example, blame and defensiveness generally THE JOURNAL OF PORTFOLIO M ANAGEMENT 3/18/15 1:20:15 PM . go hand in hand in any social ecosystem. For a deeper understanding of the survey responses, we provide a cross-sectional correlation (Exhibit 1) for the surveyed firms along six major dimensions. For tractability and ease of exposition, we cluster similar attributes together into macro attributes; in total we created six macro attributes from FCG’s 65 original attributes. They are Creativity/Innovation, Team/Collaboration, Entrepreneurial/Risk-taking, Excellence, Blame, and Sludge exBlame.
The raw attributes that form the macro attributes are shown in the text under Exhibit 1. A macro attribute is considered to have been selected by a respondent if the respondent selects any of its raw attributes. Unsurprisingly, firms with high levels of Blame also have a high level of other negative culture attributes (Sludge ex-Blame), and these very firms tend to have low levels of Creativity, Team, Entrepreneurial, and Excellence in their culture. In addition to voting for the top 10 firm attributes, employees were asked to grade their employer on a scale of 1 to N for a number of different firm outcomes. (1 is the lowest and N is chosen to give appropriate granularity.) For example, performance relative to peers is graded on a scale of 10, whereas the firm’s ability to attract talent is graded on a scale of 7.6 The votes for a given outcome received from all respondents were then averaged and recorded for that firm. It is worth noting that there is self-selection in this dataset.
These investment organizations chose to participate in the FCG survey, while many others did not. Many of the participating firms’ senior management chose to take part in the FCG survey, in order to learn about their existing culture and its potential inf luences on firm performance. We are, however, unaware of any resulting bias that might affect our empirical results. In addition to the raw FCG data items that we use as variables in the cross-sectional study, we also construct proxy variables by combining various data items.
Specifically, we combine firm-level attributes on accountability, creativity, collaboration, continuous improvement, and others to form a predictive outcome variable for longterm operational performance. In total we create three proxy variables to measure 1) the firm’s likely long-term operational performance, 2) client experience, and 3) employee engagement. We describe how each proxy variable is constructed in Appendix B. In the current study, we examine the cross-sectional relationship between the strength of blame culture in a firm and the firm’s various attributes and outcomes. We report the cross-sectional regression in Exhibit 2. We use the weighted least squares (WLS) approach to adjust for the difference in the number of respondents for each firm, but the ordinary least squares (OLS) results are entirely similar. Exhibit 2 reports that high blame in an investment organization is highly correlated with low employee loyalty, low ability to attract talent, low owner mentality in employees, low long-term operational performance, EXHIBIT 1 Cross-sectional Correlation of Macro Attributes for Firms Blame: blame, defensiveness. Creativity/Innovation: creativity/innovation, curious/open to new ideas, research oriented, open minded, humor/fun, positive. Team/Collaboration: team/collaborate, appreciation, friendship, dependable, mentorship/development, respect, trust/sincerity. Entrepreneurial/Risk Taking: entrepreneurial, risk-taking, owner mentality, passion/energy, hands-on/action oriented, proactive. Excellence: excellence, continual improvement, commitment, discipline, efficiency, being the best, quality/precision. Sludge ex-Blame: gossip, manipulation, negative, territorial, entitlement, disrespect, politics, reactive, risk averse. THE FOLLY OF BLAME : WHY I NVESTORS SHOULD CARE ABOUT THEIR M ANAGERS’ CULTURE JPM-HSU.indd 26 SPRING 2015 3/18/15 1:20:15 PM .
EXHIBIT 2 as a second independent variable alongside “Blame.” We report the results for Cross-Sectional Regression these regressions in Exhibit 3. We also report the univariate WLS with firm “Success” as the only independent variable in Exhibit 4. Exhibit 3 shows that firm success does contribute to more positive employee assessments for every attribute examined. This is not surprising; success masks a lot of problems. What is inter*We use the macro attribute of Blame, which includes both blame and defensiveness. esting, however, is just how little that seems to matter.
While the t-stat for the success variable is significant for five of EXHIBIT 3 the seven regressions, the improvement Cross-Sectional Regression in explanatory power (adjusted R 2 ) is large only for “attracting talent.” Using adjusted R 2 to compare the univariate models examined in Exhibit 2 and Exhibit 4, we find that blame explains more of the variation in key performance statistics for investment firms than does success, except along the dimension of attracting talent. Comparing Exhibit 4 *We use the macro attribute of Blame, which includes both blame and defensiveness. and Exhibit 3, we find that t-stat for success falls noticeably when blame is added as a second independent variable EXHIBIT 4 to explain the variation in firm outCross-Sectional Regression comes. In four of the six regressions, the t-stat for success declined by more than 40%.
Success becomes statistically insignificant as an explanatory variable along the dimensions of employee engagement and client experience (satisfaction). Exhibit 5 and Exhibit 6 present a more rigorous comparison of the models. Exhibit 5 compares model 1 (blame poor client experience, low employee engagement, and only) against model 2 (blame + success) and compares low firm success relative to peers. However, correlation model 3 (success only) against model 2. The F-test is is not causality.
A reasonable competing hypothesis is appropriate here because both model 1 and model 3 nest that poor firm success is actually the true driver of all within model 2. From Exhibit 5, we find that model 2 is ills; blame is just a correlated outcome that, by itself, has always preferred over model 3 for explaining the crossno effect when controlling for firm success. Arguably, if section of firm outcomes.
This means the blame always the firm were doing better (that is, if performance were adds additional explanatory power for understanding better, profits higher, and so forth) there would be less why investment organizations deliver different outcomes blaming and more employee loyalty, higher ability to in some of the most critical dimensions. However, model attract talent, and so on. To address this question, we 2 is not preferred over model 1 for explaining the crossperform a multivariate WLS, introducing firm “Success” sectional variation in client experience and employee SPRING 2015 JPM-HSU.indd 27 THE JOURNAL OF PORTFOLIO M ANAGEMENT 3/18/15 1:20:16 PM .
EXHIBIT 5 Model Comparison Using F-Test is nearly immaterial in predicting positive impact on long-term operational performance, employee engagement, and client experience. DETAILS OF OUR QUALITATIVE INTERVIEW STUDY: INTERVIEWS AND DISCUSSIONS In addition to the quantitative analysis, we also use in-depth interviews to qualitatively analyze firms in the data*5% Critical value = 3.99; **the 2-factor model is rejected in favor of the 1-factor model. base. FCG computes composite scores and applies a proprietary ranking methodology to order the firms in its survey database. EXHIBIT 6 We conducted follow-up interviews with Model Comparison using AIC and BIC leaders of a few firms selected from FCG’s “elite” or “high-performance organizations” (HPOs). Generally, our selected HPOs have high self-reported scores for success, relative to other investment firms. They also have some of the highest scores in firm attributes that are related to longterm stakeholder success. In this section, we include synopses of interviews with these Critical value = 2; **second model is rejected in favor of the first. firms’ senior leaders, whom we asked about the linkage between their culture and firm performance, with a particular emphasis on engagement, meaning that in two of the six key outcome the blame element.8 areas, success does not play an important role. Frank Hart (president, Greystone Managed InvestIn Exhibit 6, we show that we reach identical conments): “The Greystone culture is: recognize your error, clusions using the AIC (Akaike Information Criterion) learn from it, and do better next time.
We encourage and BIC (Bayesian Information Criterion) for model honesty. We don’t punish people for errors… If people selection. Additionally, we compare the two non-nested see others getting blamed when mistakes are made, then models, model 1 versus model 3, using AIC/BIC.
We they’ll do the same, and it will become acceptable… find that model 1 is preferred over model 3 in all situaEverybody makes mistakes. The challenge is, how do tions, except when explaining the firm’s ability to attract you avoid making them a second or third time? We talent. Our results suggest that success doesn’t generate learn a lot by looking at what went wrong, as opposed enough organizational endorphin to overcome the toxic to who did what wrong.
Then we fix the processes so effect of the blame culture in general.7 it doesn’t happen again.” Success appears to be potentially effective in offsetMichael Mezei (president, Mawer Investment): “[When ting the blame culture only when it comes to attracting examining mistakes], stay away from ‘who’ questions talent. A highly successful firm is also likely to be able to and focus on ‘what’ questions. As soon as you go down offer a larger compensation package, which is still conthe ‘who was involved’ [path], then immediately [you sidered the most important driver for many job seekers’ are] trying to figure out how many people were involved employment decisions.
However, current success and and what percentage to blame for each person. From a potential financial largess do not seem to have as positive practical standpoint, if an error has happened, [we are] an effect for existing employees. Current firm success very focused on what happened, what steps are taken to THE FOLLY OF BLAME : WHY I NVESTORS SHOULD CARE ABOUT THEIR M ANAGERS’ CULTURE JPM-HSU.indd 28 SPRING 2015 3/18/15 1:20:17 PM .
remediate it and what learnings are we going to apply— what are we going to do differently and what process are we going to change for next time.” Fred Martin (president and CIO of Disciplined Growth Investors): “I think if the head of a firm wants to measure the blame factor, he needs to look in the mirror. If he’s engaged in blame, then his firm will be engaged in blame. It starts at the top. The top person has to follow the suggestions of being open, curious, and accountable… I know my guys are smart.
If I beat them up on their mistakes—and we don’t win on all our stocks— they would slowly buy less controversial stocks and it would hurt our long-term numbers. We actively practice forgiving mistakes, just letting go. That is something that really helps us.” Donna Merchant (head of human resources at American Beacon): “[You have] to negate blame to have that entrepreneurial spirit to step out on the line in order to achieve more.
With risk comes reward. We have to foster a culture where our people are not afraid to think outside of the box and try something new.” Paul Gerla (CEO of Kempen Capital): “When you grow the way we have grown, and you get more complexity, [you really need to] spend the time to be open and curious, to celebrate successes but also, when failures come, to foster continual improvement rather than blaming. When we have these moments where we are very defensive, we say, ‘Hey, listen, I think we should become open and curious again.’ It really helps to have this knowledge [on the dynamics between blame and learning].” In addition to interviewing leaders of high performing investment firms, we studied the FCG database of interview transcripts, as well as free responses from the low-performing firms.
The common themes in blame-oriented cultures are fear and low morale. We provide a few anonymous quotes from professionals at these blame-oriented firms.9 First, we focus on responses that touch on leadership and how it contributes to the blame culture. We observe lower selfawareness in the leadership ranks of low-performing organizations. Anonymous response #1: “The company’s culture is in crisis and will require substantial changes. It needs to begin at the level of the CEO.
[It] is common for the CEO to argue against research analysts in meetings, often resulting in somewhat of a public berating. This tends to SPRING 2015 JPM-HSU.indd 29 generate animosity, discourage any open dialogue from occurring, and inherently puts each analyst into defensiveness at meetings. Research analysts have asked about the CEO’s mood prior to meeting with him in order to prepare mentally… [Most] individuals in research would leave if given a reasonable opportunity.” Anonymous response #2: “As far as the senior team goes, most are unapproachable and [when they do get involved as issues arise], they are [blame-oriented]. Instead of building up individuals and teams, there seems to be a process of knocking them down.
This has been going on for quite some time. As far as initiative and risk taking, I believe most employees are happy to just sit in their cubicles [and duck their heads]… Loyalty, firm-wide, has deteriorated. Anonymous response #3: “[The firm has] actually two cultures: employees and management (mostly portfolio managers). PMs take credit when things go well and blame analysts when things go wrong.
[As a result], there is little ‘collaboration’ between PMs and analysts. PMs used to be f lat-out hostile toward the employees, but recent defections have caused them to bite their lips. Very few people are happy here.” The following responses provide additional insights on how blame might create disengagement in professionals, as well as other workplace dysfunctions. Anonymous response #4: “The culture here is very blame-oriented. And after a while, there is a learned helplessness that sets in with people. At my prior job—a hedge fund—the environment was demanding but fair. I felt like I was performing at about 90% of my effectiveness.
Here I am at 30%, tops. I will leave for another job as soon as an opportunity arises.”10 Anonymous response #5: “The regular assignment of blame when things go wrong has led to an environment where many employees operate in fear of making mistakes. Employees are encouraged to ‘throw each other under the bus’ in order to make us collectively better and more efficient, a management style that is effective in some ways but fosters resentment and paranoia. Employees regularly disparage other employees—even at the very highest levels.
[This seems to create] a great deal of territoriality, especially at the highest levels: a “my group is better/smarter/more important” than your group mentality… Morale is generally low.” Anonymous response #6: “There is a lot of gossip around [the] office and everyone is quick to assign blame THE JOURNAL OF PORTFOLIO M ANAGEMENT 3/18/15 1:20:17 PM . instead of pitching in to help each other. It feels like everyone is always trying to uncover someone else’s wrongdoing or mistake, instead of just doing their work. No training or mentoring, [instead wasting time] tracking why someone was out due to bereavement, and so forth. […] [It is] hard to stay motivated.” Anonymous response #7: “I feel the culture at [the firm] encourages the fear of blame.
I feel that people are afraid to be found having made a mistake. No one wants to make a mistake. Instead of using [mistakes] to improve processes and procedures, they simply are black marks on a person.
I don’t feel that employees feel secure in our positions. We feel vulnerable all the time.” In the following responses, we get a glimpse into the experience of potentially unjustified blaming for short-term noise. Anonymous response #8: “While we claim to stand for long-term performance, our PMs are constantly asking about quarterly performance. Sometimes I will get an email the day before an [earnings announcement] asking what I expect for earnings and whether we should trade the stock.
If earnings do surprise and the stock trades up or down, I get blamed for not being on top of it.” Anonymous response #9: “This culture is toxic. When [portfolio managers] have success, it is all due to their brilliance. When they underperform, we analysts get blamed. It even extends to not owning the better stocks.
We [constantly] get drilled in our weekly meetings about why we don’t own a name that is up 20%.” Anonymous response #10: “We have a culture of fear and distrust. There lacks genuine respect for the people and for their intellect. [Instead], the idea that you are only as good as your last call is prevalent.
The comp structure, which rewards short-term outcomes [and ignores long-term contributions], seems to support an unhealthy competition amongst peers and encourage bad-mouthing peers. The investment leadership seems to always be at odds with one another, which makes decisions contentious [with a lot of second guessing].” Although anonymity and confidentiality hinder more substantial discussion regarding firms with highblame cultures, it is nonetheless important to acknowledge that only 12% of the firms in the sample would be classified as having strong, healthy cultures, while a significant percentage would be classified as having meaningful culture dysfunctions, including the strong presence of blame. DISCUSSION We find that blame is strongly associated with a variety of undesirable firm attributes and can be predictive of poor stakeholder outcomes for investment organizations. What we have learned from leaders of selected high-performing investment organizations also confirms that blame inhibits honesty, learning, risk-taking, and the willingness to improve.
In the data as well as the interviews, we find that blame increases defensiveness and fear. Senior managers’ condoning or leading with blame also spurs imitation under the pretense of organizational accountability. When blame and the associated culture elements of fear, defensiveness, and righteousness are dominant, self-reported scores on personal accountability, creativity, and learning in organizations fall substantially below average. Indeed, one could imagine that in an investment organization with a strong blame culture, people could take joy in second-guessing investment decisions after poor short-term performance.
Whether it is the board blaming the investment staff at a pension fund or the client-facing team blaming the portfolio management group at an asset management firm, the logical selfprotective moves are to def lect blame onto others or to hide poor results. People are unlikely to display personal accountability and proactively identify problems where they play a part. Moreover, anecdotal evidence indicates that when blame is high, people can be unwilling to speak out about problems because they don’t want to get other people in trouble or be viewed as grinding an axe.
It is hard to imagine long-term investment success from an organization steeped in blame. On the other hand, evidence suggests that superior long-term investment results arise with higher probability from organizations that 1) do not create fear around identified problems, 2) debate problems with openness and without blame, 3) emphasize fixing problems, and 4) focus on learning to avoid similar mistakes in the future. It then bears asking why a blame culture could persist in an industry that is based on rational decision-making and focused on long-term success. Why might organizations filled with avid learners create a culture that shuts down learning while encouraging defensiveness? We do not find evidence that senior leaders set out to create a culture of blame. What appears to be a driver of the blame culture, in some instances, is actually a bungled attempt to create more accountability by THE FOLLY OF BLAME : WHY I NVESTORS SHOULD CARE ABOUT THEIR M ANAGERS’ CULTURE JPM-HSU.indd 30 SPRING 2015 3/18/15 1:20:17 PM .
defaulting to the age-old formula: find out who messed up and blame them as quickly as possible. In the words of one CEO, “A public hanging is a good thing now and then.” Additionally, highly intelligent and competitive people often have the greatest need to be right (Ware et al. [2006] and Argyris [2008]). Organizations that are plagued with fault-finding probably subconsciously value being right more than learning.
Indeed, perhaps we blame others precisely to satisfy the ego’s need to be right. Debates whose purpose is to prove oneself right and others wrong reduce the possibility for learning and improving. People who focus on appearing to have the truth are implicitly committed to seeing only one side of the issue and looking only for confirming evidence. Unjustified blame is particularly counterproductive.
The investment management industry is one where short-term results provide little or no information on the true quality of the product. Leaders in this or any other industry are simply human and therefore driven by typical human tendencies.11 Nonetheless, a culture of blame in an environment where outcomes are random might engender perverse behaviors, such as closet indexing and year-end window-dressing, as well as nonsensical behaviors such as spending resources on developing coinf lipping skills, rather than a sound grasp of investment science and statistics. This hardly seems like a recipe for creating long-term investment success. CONCLUSION Our objective in this research article is not to provide a prescription for eliminating blame in the corporate culture.12 Rather, it is to provide quantitative analyses using a cross-sectional approach (a technique that is familiar to the finance industry) and qualitative analyses through in-depth interviews with industry professionals (a technique that is widely used in the social sciences) to demonstrate that blame is both prevalent in the investment industry and toxic to the success of investment organizations.
Whether blame is a failed attempt at fostering accountability or an ego-validation exercise, it largely produces fear, defensiveness, and low morale, among other undesirable firm attributes. More importantly, blame is highly correlated with variables that predict sub-par long-term firm performance, poor client satisfaction, and low employee engagement. Clearly, the presence of a culture of blame should be SPRING 2015 JPM-HSU.indd 31 considered a meaningful predictor of poor long-term investment results for investment organizations. APPENDIX A FCG Database Description and Data Collection Methodology From 2010 to 2013, FCG surveyed 3,245 individuals from 70 investment organizations about corporate culture. All individuals at participating firms were invited to respond. The surveys were standard (i.e., not customized to the individual firms) and conducted online with complete anonymity.
Each participant has a unique link, which avoids multiple entries from the same individual. The recorded response rate was approximately 90%. We report relevant firm characteristics. Range Median Average Firm AUM $200 MM~$124 B $4 B $17 B Firm Respondents 4~376 32 49 In this appendix, we describe only questions that are used for the research presented in this article.
The full FCG survey is significantly more comprehensive. The “existing firm attributes” question asks the respondent to identify the top 10 elements that exist in the firm. Respondents can choose from a list of 65 culture terms, which are positive (such as ethical, accountable, open to ideas, candid, collaborative, and so forth), neutral (fast-paced, analytical, cost conscious, long-hours, and so forth), or negative (manipulative, blame, defensiveness, territorial, negative, and so forth). To aggregate the individual selections into a firm-level score for each culture attribute, we count the number of votes a specific attribute receives from all firm respondents and normalize against the number of respondents. If 80% of all respondents select “blame” as a top 10 element of culture at a particular company, the firm would score a 0.8 out of a maximum of 1.0 for the blame attribute. We use responses from four questions on “firm outcome” as the key dependent variables for our cross-sectional study. Respondents are asked to rate their firm on a scale from one to four, where one is the lowest.
We reproduce the spirit of the questions below, as the actual questions were often much longer and gave examples to provide fuller context. Q1: The firm has an ability to attract top talents. Q2: Employees have an ownership mentality. THE JOURNAL OF PORTFOLIO M ANAGEMENT 3/18/15 1:20:18 PM . Q3: I am unlikely to leave the firm for a similar opportunity elsewhere. Q4: The firm is successful relative to other firms. We note that respondents could interpret Q4 as better investment performance or better financial performance, among other possibilities. However, insofar as investment organizations’ financial performance is highly tied to their investment performance, we feel that the question captures a meaningful assessment of investment performance. For each firm, we compute its average scores for the four employee assessment questions. In addition, for each question on the survey, the employees were encouraged to provide additional responses to further explain their answers. This gives us deeper insight into the mechanism that links blame and risk aversion, for instance. Every respondent selects 10 top firm attributes.
We assign a value of +1/−1 if a selected attribute falls into the above +1/−1 categories; otherwise we assigns a value of 0 to the selected attribute. The 10 selections are summed to create a long-term score that is predictive of operational performance assessed by respondent i. Note that the maximum score possible is +10 and the minimum is −4.
We average over all firm respondents to compute the firm’s long-term operational performance. The selection of firm attributes to predict long-term operational performance is admittedly subjective. Given that our estimated coefficients are significant at the 0.1% level, we believe the definition is robust to a variety of other reasonable and related specifications. In any case, we argue that these attributes are not controversial and generally intuitive, when one examines the literature on what drives firm success. We use the following attributes to create a proxy variable for predicting employee engagement. APPENDIX B +1 Predictive Proxy Variable Construction Methodology Many of the existing firm attributes can be further combined to create proxy variables that are more convenient to use for our analyses.
Specifically, we wanted to construct variables that could help predict the firm’s long-term operational performance, client satisfaction, and employee engagement. We use the following attributes to predict long-term operational performance. −1 Loyalty Bureaucracy Appreciation Territorial Employee Empowerment Disrespect Fair Gossip Humor/Fun Manipulation Curious/Open to New Ideas Politics Compassion/Caring Negative Open Minded Respect Passion/Energy/Motivate −1 +1 Positive Profit/Financial Success Territorial Trust/Sincerity Client Satisfaction Risk-averse Candor/Honesty/Open Accountability/Responsibility Short-term Focus Collaboration/Teamwork Excellence/Continuous Improvement Slow Moving/Reactive Creativity/Innovation Collaboration/Teamwork Curious/Open to New Ideas Risk-Taking Long-term Perspective/Vision We use the following attributes to create a proxy variable for predicting client satisfaction. +1 Client Satisfaction −1 Short-term Focus Ethical/Integrity Loyalty Excellence/Continuous Improvement Shareholder/Owner Focus Long-term Perspective/Vision Passion/Energy/Motivate THE FOLLY OF BLAME : WHY I NVESTORS SHOULD CARE ABOUT THEIR M ANAGERS’ CULTURE JPM-HSU.indd 32 SPRING 2015 3/18/15 1:20:18 PM . Some attributes are used in multiple proxies. However, the three proxy variables are not highly correlated and contain independent information relative to each other. ENDNOTES We thank Limin Xiao and Chris Ariza for their research assistance and Charley Ellis, Philip Lawton, John St. Hill, and anonymous referees for their comments. 1 This assessment is based on our examination of a large number of RFPs and our conversations with investment consultants. 2 Our definitions are adopted from the web encyclopedia provided by the University of Rhode Island’s Schmidt Labor Research Center. www.uri.edu/research/lrc/scholl/ webnotes/Culture.htm. 3 See Goleman [2005] for a comprehensive treatment. 4 Similarly, cases studies have questioned why pension funds and portfolio managers do not rebalance into risk assets after large price declines, given the documented long-term price mean-reversion pattern (Ang and Kjaer [2012]).
Most practitioners would readily acknowledge that the driver of this behavior is based in organizational politics, rather than in investment conviction. In 2009, the investment decision to rebalance into financial stocks and high-yield bonds was arguably sensible ex ante, but simply carried too much risk of ex post blame. 5 There are no obvious benefits or harms to the firm for scoring high or low along the various culture attributes. We also have no reason to believe that respondents had incentives to manipulate the survey; the results are 100% confidential, offering complete individual anonymity within the firm and complete firm anonymity externally. 6 In the survey, the grading scale is additionally associated by descriptive text such as 1 (Strongly disagree) or 7 (Strongly agree) to further help respondents address the various scale-oriented questions. 7 In interviews, FCG executives report having clients who had experienced performance success and financial success but had very blame-oriented cultures, suggesting that success is not the panacea for toxic cultures.
Typically, these clients’ success is not sustained. In each case, the toxic firms lost valuable talent, which led to mediocre subsequent performance. 8 Understandably, low-performing firms are less interested in being interviewed and having their culture dysfunctions publicly analyzed. 9 We edited the negative comments more aggressively and combined some comments from various responses from the same person to related questions. Exposition and specific references are sometimes edited for brevity and confidentiality. SPRING 2015 JPM-HSU.indd 33 10 This person left soon after the interview, without a job prospect. 11 Charley Ellis commented to us, “The investment industry does appear to be rational and intellectual, but we are all human and, under pressure, emotions often dominate.” 12 See Ware et al.
[2006] on ways to reduce blame in organizations. REFERENCES Aguirre, D., R. von Post, and M. Alpern.
“Culture’s Role in Enabling Organizational Change.” Strategy & White Paper (2013). www.strategyand.pwc.com/global/home/what-wethink/reports-white-papers/article-display/cultures-roleorganizational-change. Ang, A., and K.N. Kjaer.
“Investing for the Long Run.” Netspar Discussion Paper No.11/2011-104. Available at SSRN: http://ssrn.com/absract=1976310 ( January 5, 2012). Argyris, C. Teaching Smart People How to Learn.
Cambridge, MA: Harvard Business Classics, 2008. Beer, M., and N. Nohria. “Cracking the Code of Change.” Harvard Business Review, Vol.
78, No. 3 (May 2000), pp. 133-141. Camerer, C., and R. Weber.
“Cultural Conf lict and Merger Failure: An Experimental Approach.” USC CLEO Research Paper No. C01-10, 2001, ssrn.com/abstract=276288 or dx.doi. org/10.2139/ssrn.276288. Dethmer, J., D. Chapman, and K.
Klemp. The 15 Commitments of Conscious Leadership: A New Paradigm for Sustainable Success. (2015). Ellis, C.
Capital: The Story of Long-Term Investment Excellence. Hoboken, NJ: John Wiley & Sons, 2004. ——. Winning the Loser’s Game: Timeless Strategies for Successful Investing. New York: McGraw-Hill, 2009. Goleman, D.
Emotional Intelligence: Why It Can Matter More Than IQ. New York: Bantam Books, 2005. Goyal, A., and S. Wahal.
“The Selection and Termination of Investment Management Firms by Plan Sponsors” Journal of Finance, Vol. 63, No. 4 (August 2008), pp.
1805-1847. Gurdal, M., J. Miller, and A. Rustichini.
“Why Blame?” Working Paper. Coventry, U.K.: University of Warwick, Warwick Economics Research Papers Series (TWERPS), Vol. 2013, No.
1022, 2013. THE JOURNAL OF PORTFOLIO M ANAGEMENT 3/18/15 1:20:18 PM . Kets de Vries, M., L. Guillen, and K. Korotov. “Organizational Culture, Leadership, Change, and Stress.” INSEAD Working Paper No.
2009/10/EFE/IGLC, February, 2009, ssrn.com/ abstract=1338709 or dx.doi.org/10.2139/ssrn.1338709. Killingsworth, S. “Modeling the Message: Communicating Compliance Through Organizational Values and Culture.” Georgetown Journal of Legal Ethics, Vol. 25, No.
4 (Fall 2012), pp. 961-988. Lyons, R., J. Chatman, and C.
Joyce. “Innovation in Services: Corporate Culture and Investment Banking.” California Management Review, Vol. 50, No.
1 (Fall, 2007), pp. 174-191. Penfold, R. “The Cost of Trigger Happy Investing.” Towers Watson Client Letter, June, 2012.
www.towerswatson.com/ en/Insights/IC-Types/Survey-Research-Results/2012/06/ The-cost-of-trigger-happy-investing. Pink, D. Drive: The Surprising Truth About What Motivates Us. New York: Riverhead Books, 2009. Tennen, H., and G. Aff leck.
“Blaming Others for Threatening Events.” Psychological Bulletin, Vol. 108, No. 2 (September, 1990), pp.
209-232. Ware, J., J. Dethmer, J. Ziegler, and F.
Skinner. High Performing Investment Teams: How to Achieve Best Practices of Top Firms. Hoboken, NJ: John Wiley & Sons, 2006. To order reprints of this article, please contact Dewey Palmieri at dpalmieri@ iijournals.com or 212-224-3675. THE FOLLY OF BLAME : WHY I NVESTORS SHOULD CARE ABOUT THEIR M ANAGERS’ CULTURE JPM-HSU.indd 34 SPRING 2015 3/18/15 1:20:18 PM .


