


Description
FUNDAMENTALS
™
November 2015
Elegant Design
Chris Brightman, CFA, Vitali Kalesnik, Ph.D., and Engin Kose, Ph.D.
Chris Brightman, CFA
“
We believe the
quality–yield
“
trade-off is largely
unnecessary.
KEY POINTS
1.
2.
3.
The AND principle holds that
creative product design can
surmount some trade-offs that
conventional thinking considers
unavoidable.
Simple investment strategies are
easier to govern than complex
ones and may be less likely to
result in catastrophic outcomes.
A simple new design demonstrates that income-oriented
indices need not trade off yield
for capacity and quality.
“When you first start off trying to
solve a problem, the first solutions
you come up with are very complex,
and most people stop there. But if you
keep going, and live with the problem
and peel more layers of the onion off,
you can often times arrive at some
very elegant and simple solutions.”
—Steve Jobs1
elements in product design: structure and
implementation.
The Challenge of Simplicity
“That’s been one of my mantras—
focus and simplicity. Simple can be
harder than complex.”
—Steve Jobs2
Structure is essential to product design.
In January 2007 Steve Jobs announced a
revolutionary product: the iPhone. Before
that, phones were either easy to use
but only had a single function, or multifunctional (“smartphones”) but hard to
use.
The conventional wisdom in phones, as in many areas of product design, was that trade-offs are inescapable: the consumer simply cannot have everything she wants delivered in one appealing product. But with the historic unveiling of the iPhone, Jobs proved the conventional thinkers wrong. The iconoclastic iPhone design showed that the consumer can enjoy a product with rich functionality and ease of use.
We call this the AND principle. It guides all of our new product designs. Instead of accepting unnecessary tradeoffs, we seek to combine the qualities investors desire in a single vehicle. But before we explore the AND principle in more depth, let’s review two important Structure can be simple. Structure can be complex. We agree with Steve Jobs that simplicity is often the more difficult to achieve, but we believe it improves on complexity in two major ways.
Simple solutions 1) lead to more predictable outcomes, and 2) allow cleaner and easier oversight. In the investment world, complexity leads to crises, crashes, and fund collapses. A short list of events over the last three decades in which complexity played some role includes the 1987 stock market crash, the late 1990s Long-Term Capital Management collapse, the 2000 bursting of the dot-com bubble, the 2007 quant meltdown, the 2008 global financial crisis, and the 2010 flash crash, among others. Simple strategies are exposed to unpredictable events—especially those with systemic effects—but, compared to more intricate structures, the way they will react under stress may be easier to grasp, transactions easier to unwind, assets easier Media Contacts United States and Canada Hewes Communications + 1 (212) 207-9450 hewesteam@hewescomm.com Europe JPES Partners (London) +44 (0) 20 7520 7620 ra@jpespartners.com .
FUNDAMENTALS to locate, and ownership easier to establish. (Recall the difficulties Lehman’s counterparties encountered when they tried to claim derivatives collateral after the firm filed for bankruptcy in 2008.3) Simple strategies may be less likely to result in catastrophic outcomes. The second important advantage of simplicity is easier governance. For institutional investors, it means that an officer can understand and coherently explain to the board what the strategy is doing. Also, during periods of underperformance (let’s not kid ourselves, periods of underperformance are inevitable for any strategy), this ability to understand what the strategy is doing helps investors stay with the strategy. For individual investors, simplicity means that at the next BBQ party they will be able to explain why they are staying with the strategy instead of switching to some new “bright and shiny” magical stock that their neighbor just bought. 4 November 2015 A Design That Works “Some people think design means how it looks.
But of course, if you dig deeper, it’s really how it works.” — Steve Jobs5 Designers charged with developing a new product should start by focusing on how that product can work best. For an investment product, that means they should focus on the components of return most valued by a particular type of investor. For many investors, total return is what matters, but some investors prefer to maximize the income component relative to the capital appreciation, or growth, component. Individual investors, for example, use portfolio income to meet their living expenses; defined benefit pension funds use current income to discharge their obligations to beneficiaries; university endowments need income to pay the institutions’ operating expenses; and charitable trusts dispense investment income to support their particular cause. Many investors with an income preference turn to high-yield equity products, those with relatively high dividend distributions. Currently, investors with a greater preference for income have two product options to choose from: dividend yield– oriented products and dividend grower products.
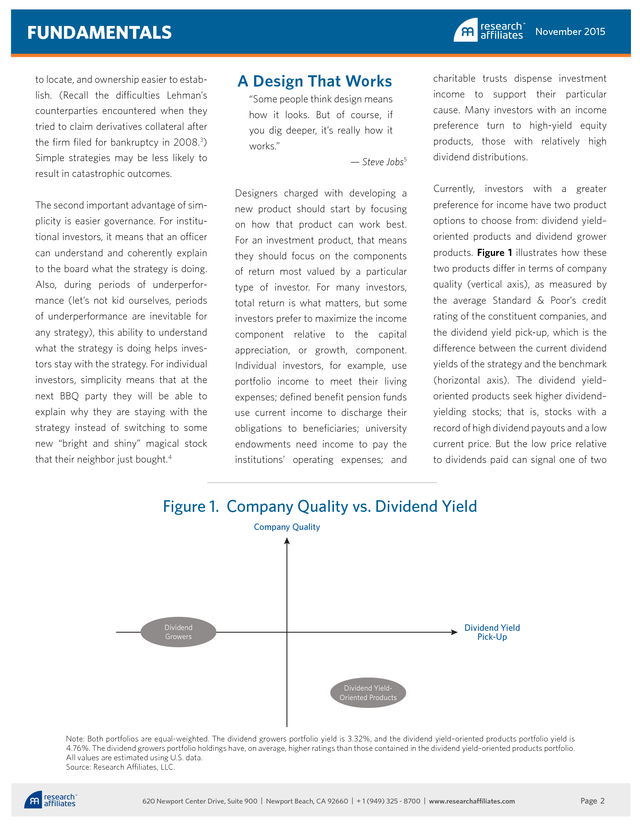
Figure 1 illustrates how these two products differ in terms of company quality (vertical axis), as measured by the average Standard & Poor’s credit rating of the constituent companies, and the dividend yield pick-up, which is the difference between the current dividend yields of the strategy and the benchmark (horizontal axis). The dividend yield– oriented products seek higher dividend– yielding stocks; that is, stocks with a record of high dividend payouts and a low current price. But the low price relative to dividends paid can signal one of two Figure 1.
Company Quality vs. Dividend Yield Company Quality Dividend Yield Pick-Up Dividend Growers Dividend YieldOriented Products Note: Both portfolios are equal-weighted. The dividend growers portfolio yield is 3.32%, and the dividend yield–oriented products portfolio yield is 4.76%.
The dividend growers portfolio holdings have, on average, higher ratings than those contained in the dividend yield–oriented products portfolio. All values are estimated using U.S. data. Source: Research Affiliates, LLC. 620 Newport Center Drive, Suite 900 | Newport Beach, CA 92660 | + 1 (949) 325 - 8700 | www.researchaffiliates.com Page 2 . FUNDAMENTALS The dividend grower products seek stocks that have a lengthy history of positive, steady dividend growth. This strong historical record is an indirect proxy for quality and typically signals a healthy company. As a result, dividend grower products generally own higher quality companies than dividend yield– oriented products. But because a stock’s history of dividend growth is unrelated to its dividend yield (i.e., no bias exists toward higher yielding stocks), the stocks in this category typically have a lower dividend yield, as indicated in Figure 1, than dividend yield–oriented products. The consequence is that dividendoriented investors often must make a trade-off between quality and yield. Both high- and low-quality companies can have the same dividend yield.
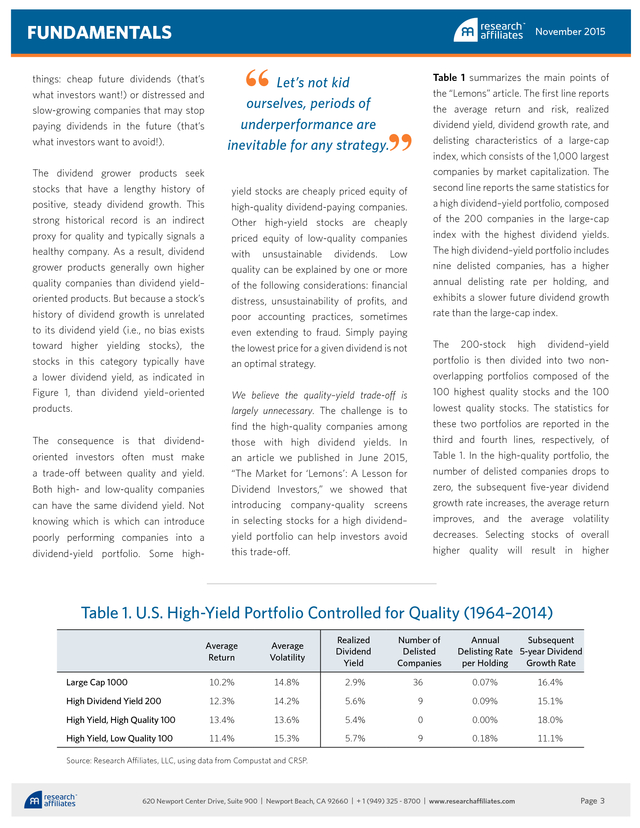
Not knowing which is which can introduce poorly performing companies into a dividend-yield portfolio. Some high- “ Table 1 summarizes the main points of the “Lemons” article. The first line reports the average return and risk, realized dividend yield, dividend growth rate, and delisting characteristics of a large-cap index, which consists of the 1,000 largest companies by market capitalization.
The second line reports the same statistics for a high dividend–yield portfolio, composed of the 200 companies in the large-cap index with the highest dividend yields. The high dividend–yield portfolio includes nine delisted companies, has a higher annual delisting rate per holding, and exhibits a slower future dividend growth rate than the large-cap index. Let’s not kid ourselves, periods of underperformance are inevitable for any strategy. “ things: cheap future dividends (that’s what investors want!) or distressed and slow-growing companies that may stop paying dividends in the future (that’s what investors want to avoid!). November 2015 yield stocks are cheaply priced equity of high-quality dividend-paying companies. Other high-yield stocks are cheaply priced equity of low-quality companies with unsustainable dividends. Low quality can be explained by one or more of the following considerations: financial distress, unsustainability of profits, and poor accounting practices, sometimes even extending to fraud. Simply paying the lowest price for a given dividend is not an optimal strategy. The 200-stock high dividend–yield portfolio is then divided into two nonoverlapping portfolios composed of the 100 highest quality stocks and the 100 We believe the quality–yield trade-off is largely unnecessary.
The challenge is to find the high-quality companies among those with high dividend yields. In an article we published in June 2015, “The Market for ‘Lemons’: A Lesson for Dividend Investors,” we showed that introducing company-quality screens in selecting stocks for a high dividend– yield portfolio can help investors avoid this trade-off. lowest quality stocks. The statistics for these two portfolios are reported in the third and fourth lines, respectively, of Table 1.
In the high-quality portfolio, the number of delisted companies drops to zero, the subsequent five-year dividend growth rate increases, the average return improves, and the average volatility decreases. Selecting stocks of overall higher quality will result in higher Table 1. U.S.
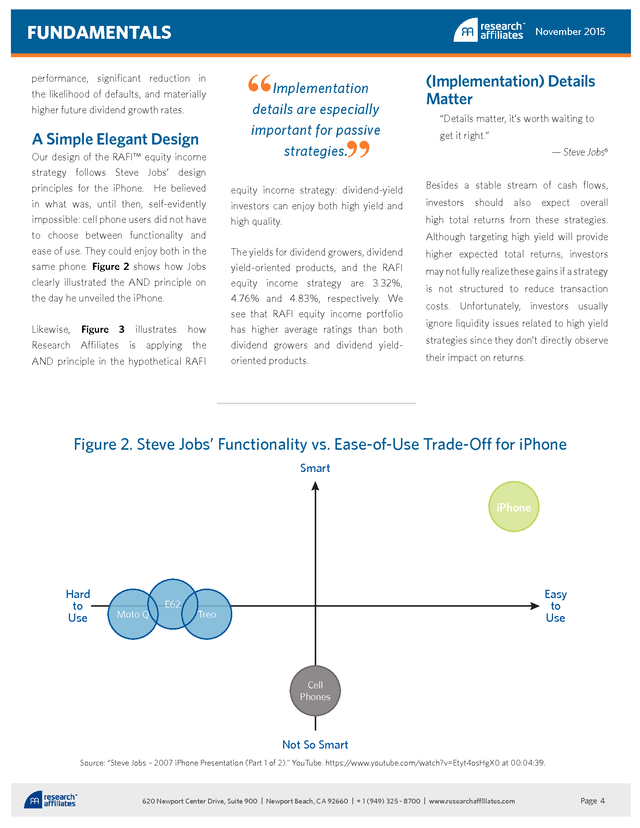
High-Yield Portfolio Controlled for Quality (1964–2014) Average Return Average Volatility Realized Dividend Yield Number of Delisted Companies Annual Subsequent Delisting Rate 5-year Dividend per Holding Growth Rate Large Cap 1000 10.2% 14.8% 2.9% 36 0.07% 16.4% High Dividend Yield 200 12.3% 14.2% 5.6% 9 0.09% 15.1% High Yield, High Quality 100 13.4% 13.6% 5.4% 0 0.00% 18.0% High Yield, Low Quality 100 11.4% 15.3% 5.7% 9 0.18% 11.1% Source: Research Affiliates, LLC, using data from Compustat and CRSP. 620 Newport Center Drive, Suite 900 | Newport Beach, CA 92660 | + 1 (949) 325 - 8700 | www.researchaffiliates.com Page 3 . FUNDAMENTALS November 2015 A Simple Elegant Design Our design of the RAFI™ equity income strategy follows Steve Jobs’ design principles for the iPhone. He believed in what was, until then, self-evidently impossible: cell phone users did not have to choose between functionality and ease of use. They could enjoy both in the same phone. Figure 2 shows how Jobs clearly illustrated the AND principle on the day he unveiled the iPhone. Likewise, Figure 3 illustrates how Research Affiliates is applying the AND principle in the hypothetical RAFI “ Implementation details are especially important for passive strategies. “ performance, significant reduction in the likelihood of defaults, and materially higher future dividend growth rates. equity income strategy: dividend-yield investors can enjoy both high yield and high quality. (Implementation) Details Matter “Details matter, it’s worth waiting to get it right.” — Steve Jobs6 Besides a stable stream of cash flows, investors should also expect overall high total returns from these strategies. Although targeting high yield will provide The yields for dividend growers, dividend yield-oriented products, and the RAFI equity income strategy are 3.32%, 4.76% and 4.83%, respectively.
We see that RAFI equity income portfolio has higher average ratings than both dividend growers and dividend yieldoriented products. higher expected total returns, investors may not fully realize these gains if a strategy is not structured to reduce transaction costs. Unfortunately, investors usually ignore liquidity issues related to high yield strategies since they don’t directly observe their impact on returns. Figure 2. Steve Jobs’ Functionality vs.
Ease-of-Use Trade-Off for iPhone Smart iPhone Hard to Use Moto Q E62 Easy to Use Treo Cell Phones Not So Smart Source: “Steve Jobs – 2007 iPhone Presentation (Part 1 of 2).” YouTube. https:/ /www.youtube.com/watch?v=Etyt4osHgX0 at 00:04:39. 620 Newport Center Drive, Suite 900 | Newport Beach, CA 92660 | + 1 (949) 325 - 8700 | www.researchaffiliates.com Page 4 . FUNDAMENTALS November 2015 Figure 3. Quality vs. Yield Trade-Offs in Dividend-Yield Products Company Quality RAFI™ Equity Income Dividend Yield Pick-Up Dividend Growers Dividend YieldOriented Products Source: Research Affiliates, LLC. Implementation details weighting implicitly assigns weights proportional both active and passive strategies, approaches through the lens of a high to prices and, as a result, inversely but they are especially important for dividend–yielding strategy. At the present proportional to yields.
Not surprisingly, passive strategies. Active managers time, investors who seek large dividend the have inherent advantages over passive distributions have three options in how has the lowest yield pick-up of the three managers. have a product assigns weights to stocks: 1) discretion over when to trade. They proportional to capitalization weights, 2) also are free from the front running that equal weighting, and 3) proportional to often arises when they inform the rest of dividend yields.
Each weighting scheme the world what they will be trading—as has a unique implication for the liquidity index fund managers typically have to characteristics of the strategy and its do. Consequently, in order to transcend investment outcomes. Given these three the inherent implementation drawbacks options, investors are faced with a trade- associated with passive strategies, they off between capacity and dividend yield should be constructed to ensure the pick-up. Active matter managers for implications of different securities being traded are highly liquid and to minimize their turnover. capitalization-weighted strategy weighting schemes. The equally weighted strategy allocates identical 1/n weights to all stocks with no consideration given to the size of the company or the liquidity of its common stock.
Although this removes the negative correlation between yield and weight (i.e., its yield is higher than that of the cap-weighted strategy), it also lowers the liquidity of the strategy. On the one hand, assigning weights The third strategy, the dividend yield– proportional to market capitalization weighted strategy, allocates weights A prime determinant of the amount of allocates more weight to the companies proportional to yield. As a result, its liquidity available in the implementation with larger volumes traded. This results yield is higher than the yield of the process is the weighting mechanism in very high liquidity.
That’s good. On equally weighted strategy, but without a of the strategy. Let’s investigate the the other hand, capitalization weighting commensurate gain in liquidity. 620 Newport Center Drive, Suite 900 | Newport Beach, CA 92660 | + 1 (949) 325 - 8700 | www.researchaffiliates.com Page 5 .
FUNDAMENTALS November 2015 So, where does this leave investors? weighting, the fundamental weighting product ideas that meet investors’ With limited options, investors find approach is not inversely proportional to financial needs; products that are themselves between the proverbial rock company yield. genuinely useful should additionally be designed for simplicity and cost- and a hard place, forced to prioritize two equally valued characteristics of yield The RAFI equity income strategy first and liquidity. weights sectors by fundamental weights; then, within sectors, it multiplies the Under the AND principle, however, weight of each company by dividend this trade-off between capacity and yield to increase the future yield of the yield is largely unnecessary. We believe strategy. As Figure 4 illustrates, this investors can have both preferences in weighting scheme provides investors one product by applying a fundamental with both high capacity and high weighting approach that intrinsically dividend yield pick-up. provides an excellent proxy of liquidity efficient implementation. (We shouldn’t have to add that they should also be priced fairly, with most of the excess return passed along to the investor.) Drawing inspiration from Steve Jobs, we further apply the AND principle to our index design initiatives: we look for ways to build in desirable features that might, at first glance, appear to require compromises. The simulated RAFI equity income index described here is (it assigns larger weights to larger In Closing companies on the basis of accounting In our view, it is not enough for the capacity, quality, and yield without measures).
And unlike capitalization investment industry to come up with trading one off against the other. a case in point: it is designed to provide Figure 4. Capacity vs. Yield Pick-Up of Four Dividend-Yield Strategies Capacity CapitalizationWeighted RAFI™ Equity Income Dividend Yield Pick-Up EqualWeighted Dividend YieldWeighted Note: The WAMCs are $114,429 billion, $32,406 billion, $33,685 billion, and $108,905 billion for the cap-weighted, equal-weighted, dividend yield–weighted, and RAFI equity income portfolios, respectively.
The corresponding yield pickup numbers are 3.82%, 3.84%, 4.24%, and 4.83%. All values are estimated using U.S. data. Source: Research Affiliates, LLC. 620 Newport Center Drive, Suite 900 | Newport Beach, CA 92660 | + 1 (949) 325 - 8700 | www.researchaffiliates.com Page 6 . FUNDAMENTALS November 2015 Endnotes References 1. Quoted in Levy (2006). 2. Quoted in Reinhardt (1998). 3. See Goldstein and Henry (2008). DeMarzo, Peter M., Ron Kaniel, and Ilan Kremer. 2008. “Relative Wealth Concerns and Financial Bubbles.” Review of Financial Studies, vol. 21, no.
1 (January):19–50. 4. Contrarian investing—trading against the crowd—is socially difficult. Meir Statman writes that investing has expressive as well as utilitarian and emotional benefits. “Expressive benefits convey to us and to others our values, tastes, and status. They answer the question, What does it say about me to others and to me?” Citing DeMarzo, Kaniel, and Kremer (2008), Statman further observes that status-conscious investors tend to inflate bubbles by crowding into similar investments for fear of falling behind the herd.
(Statman 2011, Introduction.) 5. Quoted in Wolf (1996). 6. Quoted by Apple CEO Tim Cook on Twitter (@tim_cook) on February 24, 2014. Goldstein, Matthew, and David Henry. 2008. “Lehman: One Big Derivatives Mess.” Bloomberg Business (October 7). Kalesnik, Vitali, Engin Kose, and Chris Brightman.
2015. “The Market for ‘Lemons’: A Lesson for Dividend Investors.” Research Affiliates (June). Levy, Steven. 2006.
“Good for the Soul.” Newsweek (October 16). Available at http:/ /allaboutstevejobs.com/sayings/stevejobsinterviews/newsweek06.php Reinhardt, Andy. 1998.
“Steve Jobs: ‘There’s Sanity Returning.” Business Week (May 25). Available at http:/ /www.businessweek.com/datedtoc/1998/980525.htm. Statman, Meir. 2011.
What Investors Really Want: Discover What Drives Investor Behavior and Make Smarter Financial Decisions. New York: McGraw-Hill. Wolf, Gary. 1996.
“Steve Jobs: The Next Insanely Great Thing.” Wired Magazine (February). Available at http:/ /archive.wired.com/wired/archive/4.02/jobs.html. Disclosures The material contained in this document is for general information purposes only. It is not intended as an offer or a solicitation for the purchase and/or sale of any security, derivative, commodity, or financial instrument, nor is it advice or a recommendation to enter into any transaction.
Research results relate only to a hypothetical model of past performance (i.e., a simulation) and not to an asset management product. No allowance has been made for trading costs or management fees, which would reduce investment performance. Actual results may differ.
Index returns represent back-tested performance based on rules used in the creation of the index, are not a guarantee of future performance, and are not indicative of any specific investment. Indexes are not managed investment products and cannot be invested in directly. This material is based on information that is considered to be reliable, but Research Affiliates™ and its related entities (collectively “Research Affiliates”) make this information available on an “as is” basis without a duty to update, make warranties, express or implied, regarding the accuracy of the information contained herein.
Research Affiliates is not responsible for any errors or omissions or for results obtained from the use of this information. Nothing contained in this material is intended to constitute legal, tax, securities, financial or investment advice, nor an opinion regarding the appropriateness of any investment. The information contained in this material should not be acted upon without obtaining advice from a licensed professional.
Research Affiliates, LLC, is an investment adviser registered under the Investment Advisors Act of 1940 with the U.S. Securities and Exchange Commission (SEC). Our registration as an investment adviser does not imply a certain level of skill or training. Investors should be aware of the risks associated with data sources and quantitative processes used in our investment management process.
Errors may exist in data acquired from third party vendors, the construction of model portfolios, and in coding related to the index and portfolio construction process. While Research Affiliates takes steps to identify data and process errors so as to minimize the potential impact of such errors on index and portfolio performance, we cannot guarantee that such errors will not occur. The trademarks Fundamental Index™, RAFI™, Research Affiliates Equity™, RAE™, and the Research Affiliates™ trademark and corporate name and all related logos are the exclusive intellectual property of Research Affiliates, LLC and in some cases are registered trademarks in the U.S. and other countries. Various features of the Fundamental Index™ methodology, including an accounting data-based non-capitalization data processing system and method for creating and weighting an index of securities, are protected by various patents, and patent-pending intellectual property of Research Affiliates, LLC. (See all applicable US Patents, Patent Publications, Patent Pending intellectual property and protected trademarks located at http:/ /www.researchaffiliates.com/ Pages/ legal.aspx#d, which are fully incorporated herein.) Any use of these trademarks, logos, patented or patent pending methodologies without the prior written permission of Research Affiliates, LLC, is expressly prohibited.
Research Affiliates, LLC, reserves the right to take any and all necessary action to preserve all of its rights, title, and interest in and to these marks, patents or pending patents. The views and opinions expressed are those of the author and not necessarily those of Research Affiliates, LLC. The opinions are subject to change without notice. ©2015 Research Affiliates, LLC. All rights reserved. 620 Newport Center Drive, Suite 900 | Newport Beach, CA 92660 | + 1 (949) 325 - 8700 | www.researchaffiliates.com Page 7 .
The conventional wisdom in phones, as in many areas of product design, was that trade-offs are inescapable: the consumer simply cannot have everything she wants delivered in one appealing product. But with the historic unveiling of the iPhone, Jobs proved the conventional thinkers wrong. The iconoclastic iPhone design showed that the consumer can enjoy a product with rich functionality and ease of use.
We call this the AND principle. It guides all of our new product designs. Instead of accepting unnecessary tradeoffs, we seek to combine the qualities investors desire in a single vehicle. But before we explore the AND principle in more depth, let’s review two important Structure can be simple. Structure can be complex. We agree with Steve Jobs that simplicity is often the more difficult to achieve, but we believe it improves on complexity in two major ways.
Simple solutions 1) lead to more predictable outcomes, and 2) allow cleaner and easier oversight. In the investment world, complexity leads to crises, crashes, and fund collapses. A short list of events over the last three decades in which complexity played some role includes the 1987 stock market crash, the late 1990s Long-Term Capital Management collapse, the 2000 bursting of the dot-com bubble, the 2007 quant meltdown, the 2008 global financial crisis, and the 2010 flash crash, among others. Simple strategies are exposed to unpredictable events—especially those with systemic effects—but, compared to more intricate structures, the way they will react under stress may be easier to grasp, transactions easier to unwind, assets easier Media Contacts United States and Canada Hewes Communications + 1 (212) 207-9450 hewesteam@hewescomm.com Europe JPES Partners (London) +44 (0) 20 7520 7620 ra@jpespartners.com .
FUNDAMENTALS to locate, and ownership easier to establish. (Recall the difficulties Lehman’s counterparties encountered when they tried to claim derivatives collateral after the firm filed for bankruptcy in 2008.3) Simple strategies may be less likely to result in catastrophic outcomes. The second important advantage of simplicity is easier governance. For institutional investors, it means that an officer can understand and coherently explain to the board what the strategy is doing. Also, during periods of underperformance (let’s not kid ourselves, periods of underperformance are inevitable for any strategy), this ability to understand what the strategy is doing helps investors stay with the strategy. For individual investors, simplicity means that at the next BBQ party they will be able to explain why they are staying with the strategy instead of switching to some new “bright and shiny” magical stock that their neighbor just bought. 4 November 2015 A Design That Works “Some people think design means how it looks.
But of course, if you dig deeper, it’s really how it works.” — Steve Jobs5 Designers charged with developing a new product should start by focusing on how that product can work best. For an investment product, that means they should focus on the components of return most valued by a particular type of investor. For many investors, total return is what matters, but some investors prefer to maximize the income component relative to the capital appreciation, or growth, component. Individual investors, for example, use portfolio income to meet their living expenses; defined benefit pension funds use current income to discharge their obligations to beneficiaries; university endowments need income to pay the institutions’ operating expenses; and charitable trusts dispense investment income to support their particular cause. Many investors with an income preference turn to high-yield equity products, those with relatively high dividend distributions. Currently, investors with a greater preference for income have two product options to choose from: dividend yield– oriented products and dividend grower products.
Figure 1 illustrates how these two products differ in terms of company quality (vertical axis), as measured by the average Standard & Poor’s credit rating of the constituent companies, and the dividend yield pick-up, which is the difference between the current dividend yields of the strategy and the benchmark (horizontal axis). The dividend yield– oriented products seek higher dividend– yielding stocks; that is, stocks with a record of high dividend payouts and a low current price. But the low price relative to dividends paid can signal one of two Figure 1.
Company Quality vs. Dividend Yield Company Quality Dividend Yield Pick-Up Dividend Growers Dividend YieldOriented Products Note: Both portfolios are equal-weighted. The dividend growers portfolio yield is 3.32%, and the dividend yield–oriented products portfolio yield is 4.76%.
The dividend growers portfolio holdings have, on average, higher ratings than those contained in the dividend yield–oriented products portfolio. All values are estimated using U.S. data. Source: Research Affiliates, LLC. 620 Newport Center Drive, Suite 900 | Newport Beach, CA 92660 | + 1 (949) 325 - 8700 | www.researchaffiliates.com Page 2 . FUNDAMENTALS The dividend grower products seek stocks that have a lengthy history of positive, steady dividend growth. This strong historical record is an indirect proxy for quality and typically signals a healthy company. As a result, dividend grower products generally own higher quality companies than dividend yield– oriented products. But because a stock’s history of dividend growth is unrelated to its dividend yield (i.e., no bias exists toward higher yielding stocks), the stocks in this category typically have a lower dividend yield, as indicated in Figure 1, than dividend yield–oriented products. The consequence is that dividendoriented investors often must make a trade-off between quality and yield. Both high- and low-quality companies can have the same dividend yield.
Not knowing which is which can introduce poorly performing companies into a dividend-yield portfolio. Some high- “ Table 1 summarizes the main points of the “Lemons” article. The first line reports the average return and risk, realized dividend yield, dividend growth rate, and delisting characteristics of a large-cap index, which consists of the 1,000 largest companies by market capitalization.
The second line reports the same statistics for a high dividend–yield portfolio, composed of the 200 companies in the large-cap index with the highest dividend yields. The high dividend–yield portfolio includes nine delisted companies, has a higher annual delisting rate per holding, and exhibits a slower future dividend growth rate than the large-cap index. Let’s not kid ourselves, periods of underperformance are inevitable for any strategy. “ things: cheap future dividends (that’s what investors want!) or distressed and slow-growing companies that may stop paying dividends in the future (that’s what investors want to avoid!). November 2015 yield stocks are cheaply priced equity of high-quality dividend-paying companies. Other high-yield stocks are cheaply priced equity of low-quality companies with unsustainable dividends. Low quality can be explained by one or more of the following considerations: financial distress, unsustainability of profits, and poor accounting practices, sometimes even extending to fraud. Simply paying the lowest price for a given dividend is not an optimal strategy. The 200-stock high dividend–yield portfolio is then divided into two nonoverlapping portfolios composed of the 100 highest quality stocks and the 100 We believe the quality–yield trade-off is largely unnecessary.
The challenge is to find the high-quality companies among those with high dividend yields. In an article we published in June 2015, “The Market for ‘Lemons’: A Lesson for Dividend Investors,” we showed that introducing company-quality screens in selecting stocks for a high dividend– yield portfolio can help investors avoid this trade-off. lowest quality stocks. The statistics for these two portfolios are reported in the third and fourth lines, respectively, of Table 1.
In the high-quality portfolio, the number of delisted companies drops to zero, the subsequent five-year dividend growth rate increases, the average return improves, and the average volatility decreases. Selecting stocks of overall higher quality will result in higher Table 1. U.S.
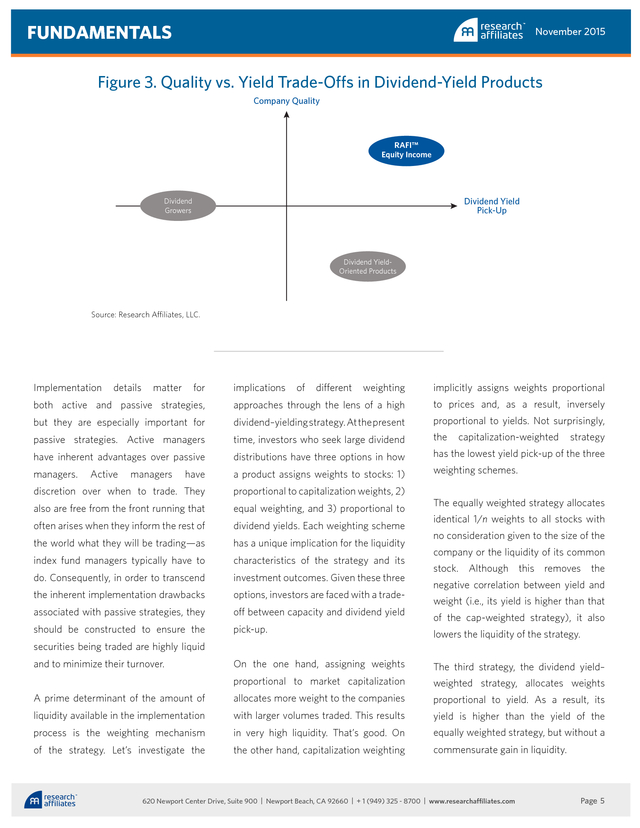
High-Yield Portfolio Controlled for Quality (1964–2014) Average Return Average Volatility Realized Dividend Yield Number of Delisted Companies Annual Subsequent Delisting Rate 5-year Dividend per Holding Growth Rate Large Cap 1000 10.2% 14.8% 2.9% 36 0.07% 16.4% High Dividend Yield 200 12.3% 14.2% 5.6% 9 0.09% 15.1% High Yield, High Quality 100 13.4% 13.6% 5.4% 0 0.00% 18.0% High Yield, Low Quality 100 11.4% 15.3% 5.7% 9 0.18% 11.1% Source: Research Affiliates, LLC, using data from Compustat and CRSP. 620 Newport Center Drive, Suite 900 | Newport Beach, CA 92660 | + 1 (949) 325 - 8700 | www.researchaffiliates.com Page 3 . FUNDAMENTALS November 2015 A Simple Elegant Design Our design of the RAFI™ equity income strategy follows Steve Jobs’ design principles for the iPhone. He believed in what was, until then, self-evidently impossible: cell phone users did not have to choose between functionality and ease of use. They could enjoy both in the same phone. Figure 2 shows how Jobs clearly illustrated the AND principle on the day he unveiled the iPhone. Likewise, Figure 3 illustrates how Research Affiliates is applying the AND principle in the hypothetical RAFI “ Implementation details are especially important for passive strategies. “ performance, significant reduction in the likelihood of defaults, and materially higher future dividend growth rates. equity income strategy: dividend-yield investors can enjoy both high yield and high quality. (Implementation) Details Matter “Details matter, it’s worth waiting to get it right.” — Steve Jobs6 Besides a stable stream of cash flows, investors should also expect overall high total returns from these strategies. Although targeting high yield will provide The yields for dividend growers, dividend yield-oriented products, and the RAFI equity income strategy are 3.32%, 4.76% and 4.83%, respectively.
We see that RAFI equity income portfolio has higher average ratings than both dividend growers and dividend yieldoriented products. higher expected total returns, investors may not fully realize these gains if a strategy is not structured to reduce transaction costs. Unfortunately, investors usually ignore liquidity issues related to high yield strategies since they don’t directly observe their impact on returns. Figure 2. Steve Jobs’ Functionality vs.
Ease-of-Use Trade-Off for iPhone Smart iPhone Hard to Use Moto Q E62 Easy to Use Treo Cell Phones Not So Smart Source: “Steve Jobs – 2007 iPhone Presentation (Part 1 of 2).” YouTube. https:/ /www.youtube.com/watch?v=Etyt4osHgX0 at 00:04:39. 620 Newport Center Drive, Suite 900 | Newport Beach, CA 92660 | + 1 (949) 325 - 8700 | www.researchaffiliates.com Page 4 . FUNDAMENTALS November 2015 Figure 3. Quality vs. Yield Trade-Offs in Dividend-Yield Products Company Quality RAFI™ Equity Income Dividend Yield Pick-Up Dividend Growers Dividend YieldOriented Products Source: Research Affiliates, LLC. Implementation details weighting implicitly assigns weights proportional both active and passive strategies, approaches through the lens of a high to prices and, as a result, inversely but they are especially important for dividend–yielding strategy. At the present proportional to yields.
Not surprisingly, passive strategies. Active managers time, investors who seek large dividend the have inherent advantages over passive distributions have three options in how has the lowest yield pick-up of the three managers. have a product assigns weights to stocks: 1) discretion over when to trade. They proportional to capitalization weights, 2) also are free from the front running that equal weighting, and 3) proportional to often arises when they inform the rest of dividend yields.
Each weighting scheme the world what they will be trading—as has a unique implication for the liquidity index fund managers typically have to characteristics of the strategy and its do. Consequently, in order to transcend investment outcomes. Given these three the inherent implementation drawbacks options, investors are faced with a trade- associated with passive strategies, they off between capacity and dividend yield should be constructed to ensure the pick-up. Active matter managers for implications of different securities being traded are highly liquid and to minimize their turnover. capitalization-weighted strategy weighting schemes. The equally weighted strategy allocates identical 1/n weights to all stocks with no consideration given to the size of the company or the liquidity of its common stock.
Although this removes the negative correlation between yield and weight (i.e., its yield is higher than that of the cap-weighted strategy), it also lowers the liquidity of the strategy. On the one hand, assigning weights The third strategy, the dividend yield– proportional to market capitalization weighted strategy, allocates weights A prime determinant of the amount of allocates more weight to the companies proportional to yield. As a result, its liquidity available in the implementation with larger volumes traded. This results yield is higher than the yield of the process is the weighting mechanism in very high liquidity.
That’s good. On equally weighted strategy, but without a of the strategy. Let’s investigate the the other hand, capitalization weighting commensurate gain in liquidity. 620 Newport Center Drive, Suite 900 | Newport Beach, CA 92660 | + 1 (949) 325 - 8700 | www.researchaffiliates.com Page 5 .
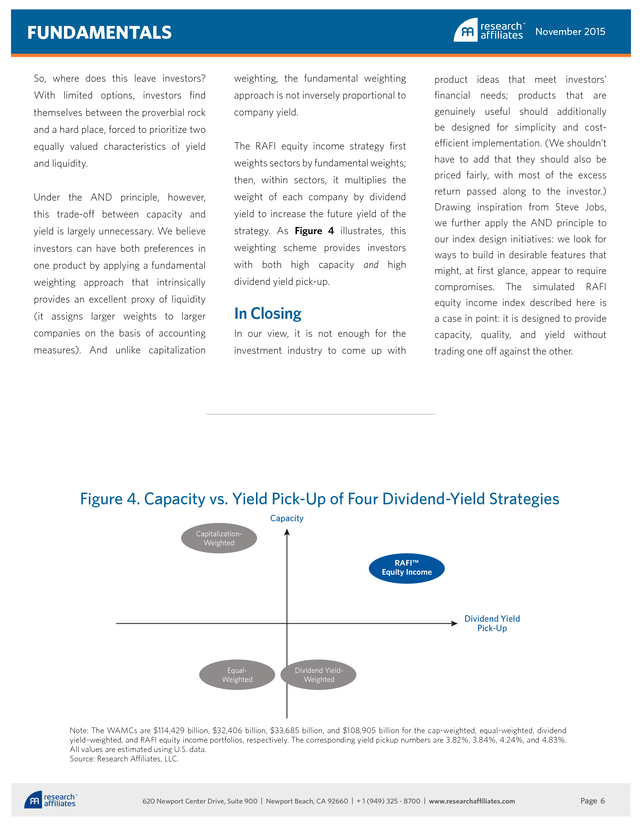
FUNDAMENTALS November 2015 So, where does this leave investors? weighting, the fundamental weighting product ideas that meet investors’ With limited options, investors find approach is not inversely proportional to financial needs; products that are themselves between the proverbial rock company yield. genuinely useful should additionally be designed for simplicity and cost- and a hard place, forced to prioritize two equally valued characteristics of yield The RAFI equity income strategy first and liquidity. weights sectors by fundamental weights; then, within sectors, it multiplies the Under the AND principle, however, weight of each company by dividend this trade-off between capacity and yield to increase the future yield of the yield is largely unnecessary. We believe strategy. As Figure 4 illustrates, this investors can have both preferences in weighting scheme provides investors one product by applying a fundamental with both high capacity and high weighting approach that intrinsically dividend yield pick-up. provides an excellent proxy of liquidity efficient implementation. (We shouldn’t have to add that they should also be priced fairly, with most of the excess return passed along to the investor.) Drawing inspiration from Steve Jobs, we further apply the AND principle to our index design initiatives: we look for ways to build in desirable features that might, at first glance, appear to require compromises. The simulated RAFI equity income index described here is (it assigns larger weights to larger In Closing companies on the basis of accounting In our view, it is not enough for the capacity, quality, and yield without measures).
And unlike capitalization investment industry to come up with trading one off against the other. a case in point: it is designed to provide Figure 4. Capacity vs. Yield Pick-Up of Four Dividend-Yield Strategies Capacity CapitalizationWeighted RAFI™ Equity Income Dividend Yield Pick-Up EqualWeighted Dividend YieldWeighted Note: The WAMCs are $114,429 billion, $32,406 billion, $33,685 billion, and $108,905 billion for the cap-weighted, equal-weighted, dividend yield–weighted, and RAFI equity income portfolios, respectively.
The corresponding yield pickup numbers are 3.82%, 3.84%, 4.24%, and 4.83%. All values are estimated using U.S. data. Source: Research Affiliates, LLC. 620 Newport Center Drive, Suite 900 | Newport Beach, CA 92660 | + 1 (949) 325 - 8700 | www.researchaffiliates.com Page 6 . FUNDAMENTALS November 2015 Endnotes References 1. Quoted in Levy (2006). 2. Quoted in Reinhardt (1998). 3. See Goldstein and Henry (2008). DeMarzo, Peter M., Ron Kaniel, and Ilan Kremer. 2008. “Relative Wealth Concerns and Financial Bubbles.” Review of Financial Studies, vol. 21, no.
1 (January):19–50. 4. Contrarian investing—trading against the crowd—is socially difficult. Meir Statman writes that investing has expressive as well as utilitarian and emotional benefits. “Expressive benefits convey to us and to others our values, tastes, and status. They answer the question, What does it say about me to others and to me?” Citing DeMarzo, Kaniel, and Kremer (2008), Statman further observes that status-conscious investors tend to inflate bubbles by crowding into similar investments for fear of falling behind the herd.
(Statman 2011, Introduction.) 5. Quoted in Wolf (1996). 6. Quoted by Apple CEO Tim Cook on Twitter (@tim_cook) on February 24, 2014. Goldstein, Matthew, and David Henry. 2008. “Lehman: One Big Derivatives Mess.” Bloomberg Business (October 7). Kalesnik, Vitali, Engin Kose, and Chris Brightman.
2015. “The Market for ‘Lemons’: A Lesson for Dividend Investors.” Research Affiliates (June). Levy, Steven. 2006.
“Good for the Soul.” Newsweek (October 16). Available at http:/ /allaboutstevejobs.com/sayings/stevejobsinterviews/newsweek06.php Reinhardt, Andy. 1998.
“Steve Jobs: ‘There’s Sanity Returning.” Business Week (May 25). Available at http:/ /www.businessweek.com/datedtoc/1998/980525.htm. Statman, Meir. 2011.
What Investors Really Want: Discover What Drives Investor Behavior and Make Smarter Financial Decisions. New York: McGraw-Hill. Wolf, Gary. 1996.
“Steve Jobs: The Next Insanely Great Thing.” Wired Magazine (February). Available at http:/ /archive.wired.com/wired/archive/4.02/jobs.html. Disclosures The material contained in this document is for general information purposes only. It is not intended as an offer or a solicitation for the purchase and/or sale of any security, derivative, commodity, or financial instrument, nor is it advice or a recommendation to enter into any transaction.
Research results relate only to a hypothetical model of past performance (i.e., a simulation) and not to an asset management product. No allowance has been made for trading costs or management fees, which would reduce investment performance. Actual results may differ.
Index returns represent back-tested performance based on rules used in the creation of the index, are not a guarantee of future performance, and are not indicative of any specific investment. Indexes are not managed investment products and cannot be invested in directly. This material is based on information that is considered to be reliable, but Research Affiliates™ and its related entities (collectively “Research Affiliates”) make this information available on an “as is” basis without a duty to update, make warranties, express or implied, regarding the accuracy of the information contained herein.
Research Affiliates is not responsible for any errors or omissions or for results obtained from the use of this information. Nothing contained in this material is intended to constitute legal, tax, securities, financial or investment advice, nor an opinion regarding the appropriateness of any investment. The information contained in this material should not be acted upon without obtaining advice from a licensed professional.
Research Affiliates, LLC, is an investment adviser registered under the Investment Advisors Act of 1940 with the U.S. Securities and Exchange Commission (SEC). Our registration as an investment adviser does not imply a certain level of skill or training. Investors should be aware of the risks associated with data sources and quantitative processes used in our investment management process.
Errors may exist in data acquired from third party vendors, the construction of model portfolios, and in coding related to the index and portfolio construction process. While Research Affiliates takes steps to identify data and process errors so as to minimize the potential impact of such errors on index and portfolio performance, we cannot guarantee that such errors will not occur. The trademarks Fundamental Index™, RAFI™, Research Affiliates Equity™, RAE™, and the Research Affiliates™ trademark and corporate name and all related logos are the exclusive intellectual property of Research Affiliates, LLC and in some cases are registered trademarks in the U.S. and other countries. Various features of the Fundamental Index™ methodology, including an accounting data-based non-capitalization data processing system and method for creating and weighting an index of securities, are protected by various patents, and patent-pending intellectual property of Research Affiliates, LLC. (See all applicable US Patents, Patent Publications, Patent Pending intellectual property and protected trademarks located at http:/ /www.researchaffiliates.com/ Pages/ legal.aspx#d, which are fully incorporated herein.) Any use of these trademarks, logos, patented or patent pending methodologies without the prior written permission of Research Affiliates, LLC, is expressly prohibited.
Research Affiliates, LLC, reserves the right to take any and all necessary action to preserve all of its rights, title, and interest in and to these marks, patents or pending patents. The views and opinions expressed are those of the author and not necessarily those of Research Affiliates, LLC. The opinions are subject to change without notice. ©2015 Research Affiliates, LLC. All rights reserved. 620 Newport Center Drive, Suite 900 | Newport Beach, CA 92660 | + 1 (949) 325 - 8700 | www.researchaffiliates.com Page 7 .


