


Description
January 2016
EXECUTIVE SUMMARY
•
•
International equities were not immune to the selloff in December as the MSCI
EAFE dropped 1.4%, and the MSCI EM slipped 2.2%.
•
Most fixed income indices lost ground last month, with the exception of
municipal bonds. The Barclays Aggregate lost 0.3% for the month as yields
moved higher along the short and intermediate end of the curve, though the
index managed a modestly positive return for 2015.
•
CPA, CFP®, CIMA®
Partner,
Chief Investment Officer
Domestic stocks were broadly negative for the month of December as volatility
increased, led by declines in the energy sector. Large caps held on to a small
gain for 2015, while mid and small caps ended the year in negative territory.
•
JIM BAIRD
In one of the most telegraphed and anticipated developments of last year, the
Federal Reserve raised the target federal funds rate by 0.25% in December,
clarifying a significant source of uncertainty in recent years.
The third-quarter U.S. GDP estimate was revised slightly downward to 2.0%,
while job market conditions and the overall economic outlook remain positive.
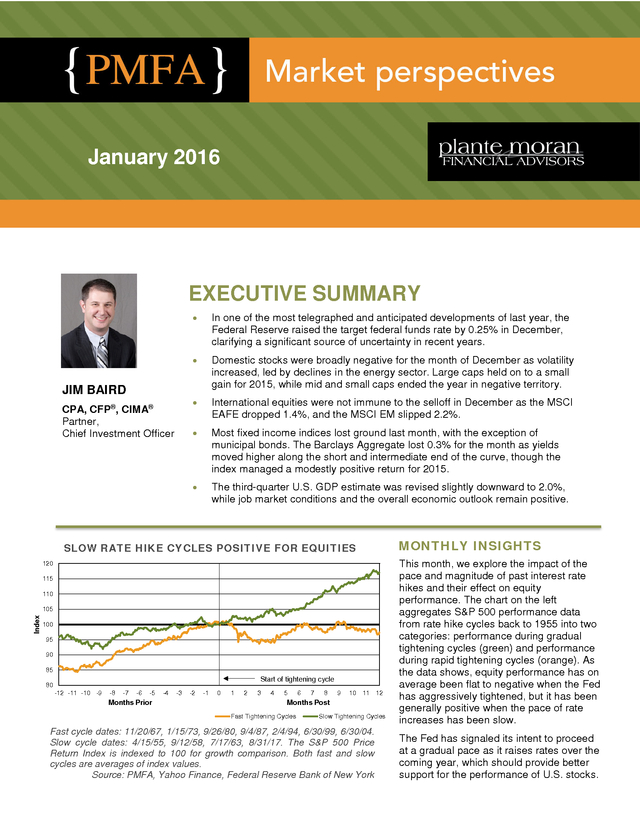
SLOW RATE HIKE CYCLES POSITIVE FOR EQUITIES
120
115
110
Index
105
100
95
90
85
Start of tightening cycle
80
-12 -11 -10 -9
-8
-7
-6
-5
Months Prior
-4
-3
-2
-1
0
1
2
3
4
5
6
7
8
9
10 11 12
Months Post
Fast Tightening Cycles
Slow Tightening Cycles
Fast cycle dates: 11/20/67, 1/15/73, 9/26/80, 9/4/87, 2/4/94, 6/30/99, 6/30/04.
Slow cycle dates: 4/15/55, 9/12/58, 7/17/63, 8/31/17.
The S&P 500 Price Return Index is indexed to 100 for growth comparison. Both fast and slow cycles are averages of index values. Source: PMFA, Yahoo Finance, Federal Reserve Bank of New York MONTHLY INSIGHTS This month, we explore the impact of the pace and magnitude of past interest rate hikes and their effect on equity performance. The chart on the left aggregates S&P 500 performance data from rate hike cycles back to 1955 into two categories: performance during gradual tightening cycles (green) and performance during rapid tightening cycles (orange).
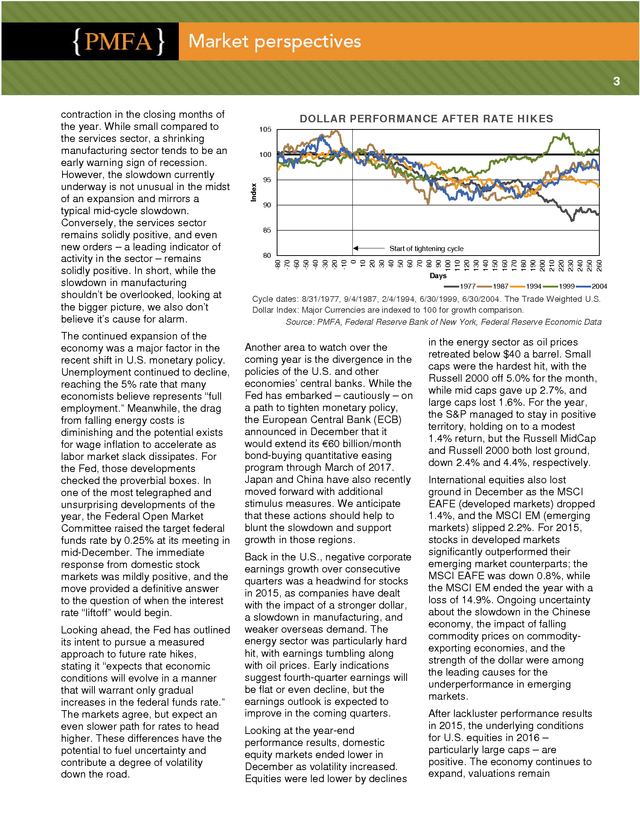
As the data shows, equity performance has on average been flat to negative when the Fed has aggressively tightened, but it has been generally positive when the pace of rate increases has been slow. The Fed has signaled its intent to proceed at a gradual pace as it raises rates over the coming year, which should provide better support for the performance of U.S. stocks. . 2 Checking the mirror, moving forward Note: This commentary was prepared before the recent market volatility since the beginning of the year. As such, we have not addressed that here, but would encourage you to visit the All the Wiser section of our website (wealth.plantemoran.com) for timely commentary on events and developments as they occur. For many, learning to drive is an adolescent rite of passage, as a driver’s license brings the prospect of freedom and new destinations. Whether it’s on a highway traveling at high speeds or pulling out into Performance Overview - As of 12/31/2015 Fixed Income MTD Barclays 1-3 Yr Govt -0.10% Barclays 3 Yr Muni -0.06% 0.57% 1.18% -0.32% Barclays Aggregate YTD 0.55% 0.34% Barclays 1-10 Yr Muni Blend 2.45% -0.79% -1.44% Barclays US TIPS -2.52% Barclays High Yield -4.47% Barclays Global Credit -3.39% -0.52% -5.00% 0.00% 5.00% Equity MTD -1.58% S&P 500 1.38% -2.05% Russell 3000 0.48% -2.68% -2.44% Russell MidCap -5.02% -4.41% Russell 2000 -1.35% -0.81% MSCI EAFE MSCI EM Alternatives YTD -2.23% -14.92% -20.00% -15.00% -10.00% -5.00% 0.00% MTD Alternatives YTD -1.33% HFRX Global Hedge Fund Bloomberg Commodity 5.00% -3.64% -3.09% -24.66% -30.00% -20.00% -10.00% 0.00% Source: PMFA local traffic, drivers are taught early on how to check their rearview mirrors briefly and regularly to see what’s behind them, even as they focus on the way ahead. For investors, checking the rearview mirror from time to time helps us understand the route we have traveled, but it can also help us orient ourselves for the road ahead. The January edition of Market Perspectives is our last chance to look back on 2015’s key market drivers and performance results, but it’s also our first chance to survey the year ahead, mapping the way forward in the new year. Are there lessons we can learn from prior years and apply in the one to come? It’s certainly reasonable to expect that economic performance, monetary policy, and corporate earnings will continue to exert influence over the markets in the year ahead. As such, meaningful changes in either expectations – or actual results – in these factors should be expected to affect the markets as well. The U.S.
economy experienced inconsistent growth during 2015, but ended the year advancing at roughly a 2.0% pace, similar to that which has defined the past several years. As 2015 drew to a close, the picture was somewhat mixed, but still largely positive. Though thirdquarter GDP was revised slightly downward to 2.0% in the most recent estimate, employment gains remain solid, while the jobless rate has held steady and wages grew. Retail sales and consumer sentiment both edged higher, and core inflation (excluding the more volatile food and energy components) increased 0.2%, hitting the 2.0% mark year over year. Perhaps the most notable area of concern was a clear weakening in the manufacturing sector, which by certain measures slipped into . 3 The continued expansion of the economy was a major factor in the recent shift in U.S. monetary policy. Unemployment continued to decline, reaching the 5% rate that many economists believe represents “full employment.” Meanwhile, the drag from falling energy costs is diminishing and the potential exists for wage inflation to accelerate as labor market slack dissipates. For the Fed, those developments checked the proverbial boxes. In one of the most telegraphed and unsurprising developments of the year, the Federal Open Market Committee raised the target federal funds rate by 0.25% at its meeting in mid-December.
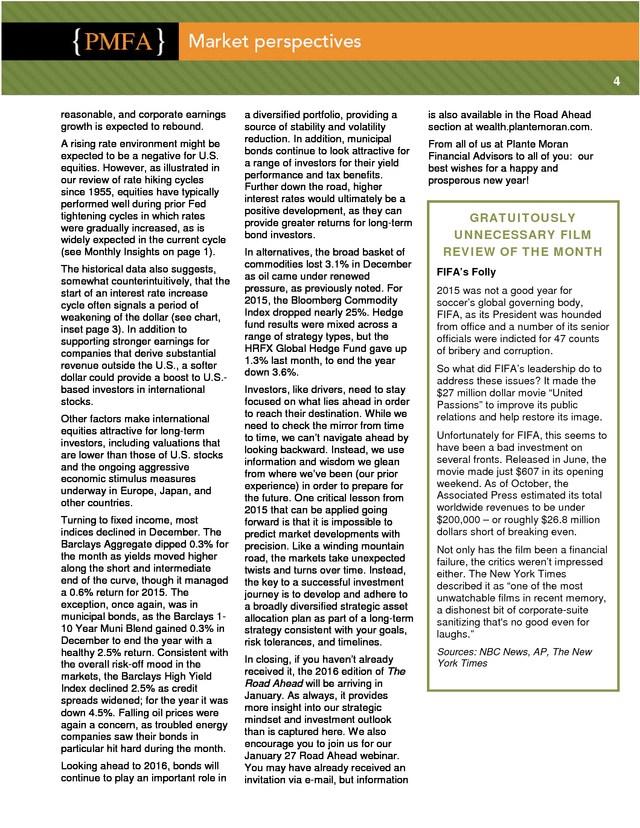
The immediate response from domestic stock markets was mildly positive, and the move provided a definitive answer to the question of when the interest rate “liftoff” would begin. Looking ahead, the Fed has outlined its intent to pursue a measured approach to future rate hikes, stating it “expects that economic conditions will evolve in a manner that will warrant only gradual increases in the federal funds rate.” The markets agree, but expect an even slower path for rates to head higher. These differences have the potential to fuel uncertainty and contribute a degree of volatility down the road. DOLLAR PERFORMANCE AFTER RATE HIKES 105 100 Index 95 90 85 Start of tightening cycle 80 -80 -70 -60 -50 -40 -30 -20 -10 0 10 20 30 40 50 60 70 80 90 100 110 120 130 140 150 160 170 180 190 200 210 220 230 240 250 260 contraction in the closing months of the year. While small compared to the services sector, a shrinking manufacturing sector tends to be an early warning sign of recession. However, the slowdown currently underway is not unusual in the midst of an expansion and mirrors a typical mid-cycle slowdown. Conversely, the services sector remains solidly positive, and even new orders – a leading indicator of activity in the sector – remains solidly positive.
In short, while the slowdown in manufacturing shouldn’t be overlooked, looking at the bigger picture, we also don’t believe it’s cause for alarm. Days 1977 1987 1994 1999 2004 Cycle dates: 8/31/1977, 9/4/1987, 2/4/1994, 6/30/1999, 6/30/2004. The Trade Weighted U.S. Dollar Index: Major Currencies are indexed to 100 for growth comparison. Source: PMFA, Federal Reserve Bank of New York, Federal Reserve Economic Data Another area to watch over the coming year is the divergence in the policies of the U.S. and other economies’ central banks.
While the Fed has embarked – cautiously – on a path to tighten monetary policy, the European Central Bank (ECB) announced in December that it would extend its €60 billion/month bond-buying quantitative easing program through March of 2017. Japan and China have also recently moved forward with additional stimulus measures. We anticipate that these actions should help to blunt the slowdown and support growth in those regions. Back in the U.S., negative corporate earnings growth over consecutive quarters was a headwind for stocks in 2015, as companies have dealt with the impact of a stronger dollar, a slowdown in manufacturing, and weaker overseas demand. The energy sector was particularly hard hit, with earnings tumbling along with oil prices.
Early indications suggest fourth-quarter earnings will be flat or even decline, but the earnings outlook is expected to improve in the coming quarters. Looking at the year-end performance results, domestic equity markets ended lower in December as volatility increased. Equities were led lower by declines in the energy sector as oil prices retreated below $40 a barrel. Small caps were the hardest hit, with the Russell 2000 off 5.0% for the month, while mid caps gave up 2.7%, and large caps lost 1.6%. For the year, the S&P managed to stay in positive territory, holding on to a modest 1.4% return, but the Russell MidCap and Russell 2000 both lost ground, down 2.4% and 4.4%, respectively. International equities also lost ground in December as the MSCI EAFE (developed markets) dropped 1.4%, and the MSCI EM (emerging markets) slipped 2.2%.
For 2015, stocks in developed markets significantly outperformed their emerging market counterparts; the MSCI EAFE was down 0.8%, while the MSCI EM ended the year with a loss of 14.9%. Ongoing uncertainty about the slowdown in the Chinese economy, the impact of falling commodity prices on commodityexporting economies, and the strength of the dollar were among the leading causes for the underperformance in emerging markets. After lackluster performance results in 2015, the underlying conditions for U.S. equities in 2016 – particularly large caps – are positive.
The economy continues to expand, valuations remain . 4 reasonable, and corporate earnings growth is expected to rebound. A rising rate environment might be expected to be a negative for U.S. equities. However, as illustrated in our review of rate hiking cycles since 1955, equities have typically performed well during prior Fed tightening cycles in which rates were gradually increased, as is widely expected in the current cycle (see Monthly Insights on page 1). The historical data also suggests, somewhat counterintuitively, that the start of an interest rate increase cycle often signals a period of weakening of the dollar (see chart, inset page 3). In addition to supporting stronger earnings for companies that derive substantial revenue outside the U.S., a softer dollar could provide a boost to U.S.based investors in international stocks. Other factors make international equities attractive for long-term investors, including valuations that are lower than those of U.S. stocks and the ongoing aggressive economic stimulus measures underway in Europe, Japan, and other countries. Turning to fixed income, most indices declined in December.
The Barclays Aggregate dipped 0.3% for the month as yields moved higher along the short and intermediate end of the curve, though it managed a 0.6% return for 2015. The exception, once again, was in municipal bonds, as the Barclays 110 Year Muni Blend gained 0.3% in December to end the year with a healthy 2.5% return. Consistent with the overall risk-off mood in the markets, the Barclays High Yield Index declined 2.5% as credit spreads widened; for the year it was down 4.5%.
Falling oil prices were again a concern, as troubled energy companies saw their bonds in particular hit hard during the month. Looking ahead to 2016, bonds will continue to play an important role in a diversified portfolio, providing a source of stability and volatility reduction. In addition, municipal bonds continue to look attractive for a range of investors for their yield performance and tax benefits. Further down the road, higher interest rates would ultimately be a positive development, as they can provide greater returns for long-term bond investors. In alternatives, the broad basket of commodities lost 3.1% in December as oil came under renewed pressure, as previously noted. For 2015, the Bloomberg Commodity Index dropped nearly 25%.
Hedge fund results were mixed across a range of strategy types, but the HRFX Global Hedge Fund gave up 1.3% last month, to end the year down 3.6%. Investors, like drivers, need to stay focused on what lies ahead in order to reach their destination. While we need to check the mirror from time to time, we can’t navigate ahead by looking backward. Instead, we use information and wisdom we glean from where we’ve been (our prior experience) in order to prepare for the future.
One critical lesson from 2015 that can be applied going forward is that it is impossible to predict market developments with precision. Like a winding mountain road, the markets take unexpected twists and turns over time. Instead, the key to a successful investment journey is to develop and adhere to a broadly diversified strategic asset allocation plan as part of a long-term strategy consistent with your goals, risk tolerances, and timelines. In closing, if you haven’t already received it, the 2016 edition of The Road Ahead will be arriving in January.
As always, it provides more insight into our strategic mindset and investment outlook than is captured here. We also encourage you to join us for our January 27 Road Ahead webinar. You may have already received an invitation via e-mail, but information is also available in the Road Ahead section at wealth.plantemoran.com. From all of us at Plante Moran Financial Advisors to all of you: our best wishes for a happy and prosperous new year! GRATUITOUSLY UNNECESSARY FILM REVIEW OF THE MONTH FIFA’s Folly 2015 was not a good year for soccer’s global governing body, FIFA, as its President was hounded from office and a number of its senior officials were indicted for 47 counts of bribery and corruption. So what did FIFA’s leadership do to address these issues? It made the $27 million dollar movie “United Passions” to improve its public relations and help restore its image. Unfortunately for FIFA, this seems to have been a bad investment on several fronts. Released in June, the movie made just $607 in its opening weekend.
As of October, the Associated Press estimated its total worldwide revenues to be under $200,000 – or roughly $26.8 million dollars short of breaking even. Not only has the film been a financial failure, the critics weren’t impressed either. The New York Times described it as “one of the most unwatchable films in recent memory, a dishonest bit of corporate-suite sanitizing that's no good even for laughs.” Sources: NBC News, AP, The New York Times . 5 BLOG For other up-to-date economic briefs, visit PMFA’s Market Perspectives Blog at marketperspectives-blog.pmfa.com. PODCAST “Perspectives,” our monthly podcast, offers an abridged version of our monthly Market Perspectives. To listen, please visit iTunes or wealth.plantemoran.com. Past performance does not guarantee future results. All investments include risk and have the potential for loss as well as gain. Data sources for peer group comparisons, returns, and standard statistical data are provided by the sources referenced and are based on data obtained from recognized statistical services or other sources believed to be reliable. However, some or all of the information has not been verified prior to the analysis, and we do not make any representations as to its accuracy or completeness.
Any analysis nonfactual in nature constitutes only current opinions, which are subject to change. Benchmarks or indices are included for information purposes only to reflect the current market environment; no index is a directly tradable investment. There may be instances when consultant opinions regarding any fundamental or quantitative analysis may not agree. Plante Moran Financial Advisors (PMFA) publishes this update to convey general information about market conditions and not for the purpose of providing investment advice.
Investment in any of the companies or sectors mentioned herein may not be appropriate for you. You should consult a representative from PMFA for investment advice regarding your own situation. .
The S&P 500 Price Return Index is indexed to 100 for growth comparison. Both fast and slow cycles are averages of index values. Source: PMFA, Yahoo Finance, Federal Reserve Bank of New York MONTHLY INSIGHTS This month, we explore the impact of the pace and magnitude of past interest rate hikes and their effect on equity performance. The chart on the left aggregates S&P 500 performance data from rate hike cycles back to 1955 into two categories: performance during gradual tightening cycles (green) and performance during rapid tightening cycles (orange).
As the data shows, equity performance has on average been flat to negative when the Fed has aggressively tightened, but it has been generally positive when the pace of rate increases has been slow. The Fed has signaled its intent to proceed at a gradual pace as it raises rates over the coming year, which should provide better support for the performance of U.S. stocks. . 2 Checking the mirror, moving forward Note: This commentary was prepared before the recent market volatility since the beginning of the year. As such, we have not addressed that here, but would encourage you to visit the All the Wiser section of our website (wealth.plantemoran.com) for timely commentary on events and developments as they occur. For many, learning to drive is an adolescent rite of passage, as a driver’s license brings the prospect of freedom and new destinations. Whether it’s on a highway traveling at high speeds or pulling out into Performance Overview - As of 12/31/2015 Fixed Income MTD Barclays 1-3 Yr Govt -0.10% Barclays 3 Yr Muni -0.06% 0.57% 1.18% -0.32% Barclays Aggregate YTD 0.55% 0.34% Barclays 1-10 Yr Muni Blend 2.45% -0.79% -1.44% Barclays US TIPS -2.52% Barclays High Yield -4.47% Barclays Global Credit -3.39% -0.52% -5.00% 0.00% 5.00% Equity MTD -1.58% S&P 500 1.38% -2.05% Russell 3000 0.48% -2.68% -2.44% Russell MidCap -5.02% -4.41% Russell 2000 -1.35% -0.81% MSCI EAFE MSCI EM Alternatives YTD -2.23% -14.92% -20.00% -15.00% -10.00% -5.00% 0.00% MTD Alternatives YTD -1.33% HFRX Global Hedge Fund Bloomberg Commodity 5.00% -3.64% -3.09% -24.66% -30.00% -20.00% -10.00% 0.00% Source: PMFA local traffic, drivers are taught early on how to check their rearview mirrors briefly and regularly to see what’s behind them, even as they focus on the way ahead. For investors, checking the rearview mirror from time to time helps us understand the route we have traveled, but it can also help us orient ourselves for the road ahead. The January edition of Market Perspectives is our last chance to look back on 2015’s key market drivers and performance results, but it’s also our first chance to survey the year ahead, mapping the way forward in the new year. Are there lessons we can learn from prior years and apply in the one to come? It’s certainly reasonable to expect that economic performance, monetary policy, and corporate earnings will continue to exert influence over the markets in the year ahead. As such, meaningful changes in either expectations – or actual results – in these factors should be expected to affect the markets as well. The U.S.
economy experienced inconsistent growth during 2015, but ended the year advancing at roughly a 2.0% pace, similar to that which has defined the past several years. As 2015 drew to a close, the picture was somewhat mixed, but still largely positive. Though thirdquarter GDP was revised slightly downward to 2.0% in the most recent estimate, employment gains remain solid, while the jobless rate has held steady and wages grew. Retail sales and consumer sentiment both edged higher, and core inflation (excluding the more volatile food and energy components) increased 0.2%, hitting the 2.0% mark year over year. Perhaps the most notable area of concern was a clear weakening in the manufacturing sector, which by certain measures slipped into . 3 The continued expansion of the economy was a major factor in the recent shift in U.S. monetary policy. Unemployment continued to decline, reaching the 5% rate that many economists believe represents “full employment.” Meanwhile, the drag from falling energy costs is diminishing and the potential exists for wage inflation to accelerate as labor market slack dissipates. For the Fed, those developments checked the proverbial boxes. In one of the most telegraphed and unsurprising developments of the year, the Federal Open Market Committee raised the target federal funds rate by 0.25% at its meeting in mid-December.
The immediate response from domestic stock markets was mildly positive, and the move provided a definitive answer to the question of when the interest rate “liftoff” would begin. Looking ahead, the Fed has outlined its intent to pursue a measured approach to future rate hikes, stating it “expects that economic conditions will evolve in a manner that will warrant only gradual increases in the federal funds rate.” The markets agree, but expect an even slower path for rates to head higher. These differences have the potential to fuel uncertainty and contribute a degree of volatility down the road. DOLLAR PERFORMANCE AFTER RATE HIKES 105 100 Index 95 90 85 Start of tightening cycle 80 -80 -70 -60 -50 -40 -30 -20 -10 0 10 20 30 40 50 60 70 80 90 100 110 120 130 140 150 160 170 180 190 200 210 220 230 240 250 260 contraction in the closing months of the year. While small compared to the services sector, a shrinking manufacturing sector tends to be an early warning sign of recession. However, the slowdown currently underway is not unusual in the midst of an expansion and mirrors a typical mid-cycle slowdown. Conversely, the services sector remains solidly positive, and even new orders – a leading indicator of activity in the sector – remains solidly positive.
In short, while the slowdown in manufacturing shouldn’t be overlooked, looking at the bigger picture, we also don’t believe it’s cause for alarm. Days 1977 1987 1994 1999 2004 Cycle dates: 8/31/1977, 9/4/1987, 2/4/1994, 6/30/1999, 6/30/2004. The Trade Weighted U.S. Dollar Index: Major Currencies are indexed to 100 for growth comparison. Source: PMFA, Federal Reserve Bank of New York, Federal Reserve Economic Data Another area to watch over the coming year is the divergence in the policies of the U.S. and other economies’ central banks.
While the Fed has embarked – cautiously – on a path to tighten monetary policy, the European Central Bank (ECB) announced in December that it would extend its €60 billion/month bond-buying quantitative easing program through March of 2017. Japan and China have also recently moved forward with additional stimulus measures. We anticipate that these actions should help to blunt the slowdown and support growth in those regions. Back in the U.S., negative corporate earnings growth over consecutive quarters was a headwind for stocks in 2015, as companies have dealt with the impact of a stronger dollar, a slowdown in manufacturing, and weaker overseas demand. The energy sector was particularly hard hit, with earnings tumbling along with oil prices.
Early indications suggest fourth-quarter earnings will be flat or even decline, but the earnings outlook is expected to improve in the coming quarters. Looking at the year-end performance results, domestic equity markets ended lower in December as volatility increased. Equities were led lower by declines in the energy sector as oil prices retreated below $40 a barrel. Small caps were the hardest hit, with the Russell 2000 off 5.0% for the month, while mid caps gave up 2.7%, and large caps lost 1.6%. For the year, the S&P managed to stay in positive territory, holding on to a modest 1.4% return, but the Russell MidCap and Russell 2000 both lost ground, down 2.4% and 4.4%, respectively. International equities also lost ground in December as the MSCI EAFE (developed markets) dropped 1.4%, and the MSCI EM (emerging markets) slipped 2.2%.
For 2015, stocks in developed markets significantly outperformed their emerging market counterparts; the MSCI EAFE was down 0.8%, while the MSCI EM ended the year with a loss of 14.9%. Ongoing uncertainty about the slowdown in the Chinese economy, the impact of falling commodity prices on commodityexporting economies, and the strength of the dollar were among the leading causes for the underperformance in emerging markets. After lackluster performance results in 2015, the underlying conditions for U.S. equities in 2016 – particularly large caps – are positive.
The economy continues to expand, valuations remain . 4 reasonable, and corporate earnings growth is expected to rebound. A rising rate environment might be expected to be a negative for U.S. equities. However, as illustrated in our review of rate hiking cycles since 1955, equities have typically performed well during prior Fed tightening cycles in which rates were gradually increased, as is widely expected in the current cycle (see Monthly Insights on page 1). The historical data also suggests, somewhat counterintuitively, that the start of an interest rate increase cycle often signals a period of weakening of the dollar (see chart, inset page 3). In addition to supporting stronger earnings for companies that derive substantial revenue outside the U.S., a softer dollar could provide a boost to U.S.based investors in international stocks. Other factors make international equities attractive for long-term investors, including valuations that are lower than those of U.S. stocks and the ongoing aggressive economic stimulus measures underway in Europe, Japan, and other countries. Turning to fixed income, most indices declined in December.
The Barclays Aggregate dipped 0.3% for the month as yields moved higher along the short and intermediate end of the curve, though it managed a 0.6% return for 2015. The exception, once again, was in municipal bonds, as the Barclays 110 Year Muni Blend gained 0.3% in December to end the year with a healthy 2.5% return. Consistent with the overall risk-off mood in the markets, the Barclays High Yield Index declined 2.5% as credit spreads widened; for the year it was down 4.5%.
Falling oil prices were again a concern, as troubled energy companies saw their bonds in particular hit hard during the month. Looking ahead to 2016, bonds will continue to play an important role in a diversified portfolio, providing a source of stability and volatility reduction. In addition, municipal bonds continue to look attractive for a range of investors for their yield performance and tax benefits. Further down the road, higher interest rates would ultimately be a positive development, as they can provide greater returns for long-term bond investors. In alternatives, the broad basket of commodities lost 3.1% in December as oil came under renewed pressure, as previously noted. For 2015, the Bloomberg Commodity Index dropped nearly 25%.
Hedge fund results were mixed across a range of strategy types, but the HRFX Global Hedge Fund gave up 1.3% last month, to end the year down 3.6%. Investors, like drivers, need to stay focused on what lies ahead in order to reach their destination. While we need to check the mirror from time to time, we can’t navigate ahead by looking backward. Instead, we use information and wisdom we glean from where we’ve been (our prior experience) in order to prepare for the future.
One critical lesson from 2015 that can be applied going forward is that it is impossible to predict market developments with precision. Like a winding mountain road, the markets take unexpected twists and turns over time. Instead, the key to a successful investment journey is to develop and adhere to a broadly diversified strategic asset allocation plan as part of a long-term strategy consistent with your goals, risk tolerances, and timelines. In closing, if you haven’t already received it, the 2016 edition of The Road Ahead will be arriving in January.
As always, it provides more insight into our strategic mindset and investment outlook than is captured here. We also encourage you to join us for our January 27 Road Ahead webinar. You may have already received an invitation via e-mail, but information is also available in the Road Ahead section at wealth.plantemoran.com. From all of us at Plante Moran Financial Advisors to all of you: our best wishes for a happy and prosperous new year! GRATUITOUSLY UNNECESSARY FILM REVIEW OF THE MONTH FIFA’s Folly 2015 was not a good year for soccer’s global governing body, FIFA, as its President was hounded from office and a number of its senior officials were indicted for 47 counts of bribery and corruption. So what did FIFA’s leadership do to address these issues? It made the $27 million dollar movie “United Passions” to improve its public relations and help restore its image. Unfortunately for FIFA, this seems to have been a bad investment on several fronts. Released in June, the movie made just $607 in its opening weekend.
As of October, the Associated Press estimated its total worldwide revenues to be under $200,000 – or roughly $26.8 million dollars short of breaking even. Not only has the film been a financial failure, the critics weren’t impressed either. The New York Times described it as “one of the most unwatchable films in recent memory, a dishonest bit of corporate-suite sanitizing that's no good even for laughs.” Sources: NBC News, AP, The New York Times . 5 BLOG For other up-to-date economic briefs, visit PMFA’s Market Perspectives Blog at marketperspectives-blog.pmfa.com. PODCAST “Perspectives,” our monthly podcast, offers an abridged version of our monthly Market Perspectives. To listen, please visit iTunes or wealth.plantemoran.com. Past performance does not guarantee future results. All investments include risk and have the potential for loss as well as gain. Data sources for peer group comparisons, returns, and standard statistical data are provided by the sources referenced and are based on data obtained from recognized statistical services or other sources believed to be reliable. However, some or all of the information has not been verified prior to the analysis, and we do not make any representations as to its accuracy or completeness.
Any analysis nonfactual in nature constitutes only current opinions, which are subject to change. Benchmarks or indices are included for information purposes only to reflect the current market environment; no index is a directly tradable investment. There may be instances when consultant opinions regarding any fundamental or quantitative analysis may not agree. Plante Moran Financial Advisors (PMFA) publishes this update to convey general information about market conditions and not for the purpose of providing investment advice.
Investment in any of the companies or sectors mentioned herein may not be appropriate for you. You should consult a representative from PMFA for investment advice regarding your own situation. .


