California’s Other Carbon Market: The LCFS, and its Interplay with Cap-and-Trade - April 23, 2015
Latham & Watkins LLP


Description
Thursday, April 23, 2015
9:00 a.m. Pacific | 11:00 a.m. Central | Noon Eastern
California’s Other Carbon
Market: The LCFS, and its
Interplay with Cap-andTrade
. Agenda
•
Overview of LCFS, Litigation, and Program
Re-Adoption
•
Modeling Insights
•
Policy and Technical Questions Moving
Forward
2
. LCFS Background
•
Low Carbon Fuel Standard (LCFS) is a core
component of California’s climate change strategy
•
Adopted pursuant to the Global Warming Solutions
Act of 2006 (aka “AB 32”)
•
LCFS requires fuel suppliers to reduce Carbon
Intensity (CI) of certain transportation fuels 10
percent below 2010 levels by 2020
•
•
Alternative fuel market value significantly affected by
approved CI
ARB Wish List
•
•
Program Extension to 2030
Linkage with Pacific Coast governments
3
. LCFS Challenge in Federal Court
•
December 2011: United States District Court
for the Eastern District of California held that
LCFS violates the Dormant Commerce Clause
of the United States Constitution
•
September 2013: Ninth Circuit upheld the
LCFS, reversing the lower court decision, and in
January 2014, denied a rehearing en banc
(Rocky Mountain Farmers Union v. Corey, 730
F.3d 1070)
•
June 30, 2014: US Supreme Court denied
Plaintiffs’ Petition for Certiorari
4
. Implications of Supreme Court Denial
•
LCFS does not facially discriminate against out of state commerce,
which would violate dormant Commerce Clause
•
Case remanded to District Court for “Pike balancing test,” which is
generally viewed as less stringent than test for facial discrimination,
requiring only that a statute’s burdens on interstate commerce not be
clearly excessive in relation to in-state benefits
•
In First Update to Climate Change Scoping Plan,
ARB signals extension of LCFS to 2030
•
Cap-and-Trade Program less vulnerable
5
. LCFS Challenge in State Court
•
2009: POET, an out-of-state ethanol
company, files lawsuit against ARB
•
November 2011: Fresno County Superior
Court ruled against POET
•
July 15, 2013: California Court of Appeal for
the Fifth Appellate District reversed trial court
•
November 20, 2013: California Supreme
Court denied petition for review submitted by
Air Resources Board (ARB)
6
. POET v. ARB: Holding and Disposition
•
ARB violated the California Environmental Quality Act (CEQA) and
California’s Administrative Procedures Act (APA) in adopting LCFS
•
ARB must set aside its approval of LCFS
•
LCFS remains in effect while ARB reapproves regulations – Fresno
County Superior Court retained jurisdiction to supervise re-adoption
•
Technically a ruling against ARB; nevertheless, a significant win for
ARB because it avoided market disruption and confusion of injunction
(so far)
7
. POET v. ARB: Takeaways
•
LCFS survived the state court challenge
•
But ARB must fix CEQA and APA deficiencies
and reapprove LCFS
•
LCFS CI standards frozen at 2013 levels
pending ARB’s re-adoption of LCFS
•
If ARB fails to “proceed in good faith and
without delay,” LCFS will be suspended
8
. Re-Adoption Process
•
ARB must readopt the LCFS to comply with the state
court ruling in POET
•
In connection with re-adoption process, ARB has
proposed significant changes to LCFS program
•
Timeline
•
March 2014: Initial Workshop on Re-adoption
•
•
•
•
•
11 other workshops held in 2014
December 30, 2014: Proposed Regulation Order posted
February 17, 2015: Deadline for Comments
February 19, 2015: Board Public Hearing
Summer 2015: Board vote on re-adoption
9
. Proposed Changes to Program
•
Modified Compliance Schedule
•
•
Back-loaded CI reductions
Cost Containment – Credit Clearance Market (CCM)
•
•
$200 credit price ceiling (inflation-adjusted)
“5×5” rule
•
Credit Invalidation and Enforcement Mechanisms
•
Revised Indirect Land Use Change Values
•
CA-GREET model update
•
Two-tiered Fuel Pathway Approvals
•
Recordkeeping
•
Credits for GHG Emission Reductions at Oil Refineries
•
Innovative Technologies for Crude Oil Production
•
Electric Vehicles
10
. Hot Topics
•
Policy Debates
•
•
•
•
•
Overlap with Cap-and-Trade Program
Catalyst for low-CI fuel development?
High cost of GHG emission reductions
Truly Fuel Neutral?
Design Issues
•
•
•
•
•
Low-CI fuel availability (electricity 10x; CNG 32x)
Credit bank growth projections
Unintended impacts of CCM
Credit invalidation and traceability
Metering of EV Charging
11
. Environmental Market Models (EM2) –
About Us
•
Environmental Market Models, LLC (EM2) is a third-party
research firm that operates as a one-stop shop for all your
environmental market research needs.
•
Our Quarterly Outlooks provide insight into the perceptions,
policies, and economics that drive market fundamentals and
prices of the key environmental markets across North America.
•
We offer full model access to clients. Our models are simple to
use and include a multitude of various market and policy usercontrols that impact model outcomes.
12
. Environmental Market Models (EM2) –
Market Coverage
• Analyst
Access
California LCFS
Federal RFS2
California RPS
PJM RPS
• Full Model
Access
Clean Fuel
Markets
REC Markets
NEPOOL RPS
• Data
Downloads
RGGI
• Quarterly
Outlooks
Carbon
Markets
California-Quebec ETS
Products &
Services
13
. California LCFS – Executive Summary
•
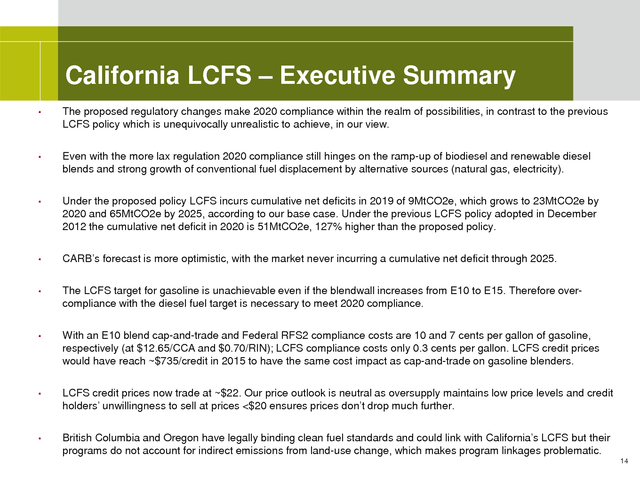
The proposed regulatory changes make 2020 compliance within the realm of possibilities, in contrast to the previous
LCFS policy which is unequivocally unrealistic to achieve, in our view.
•
Even with the more lax regulation 2020 compliance still hinges on the ramp-up of biodiesel and renewable diesel
blends and strong growth of conventional fuel displacement by alternative sources (natural gas, electricity).
•
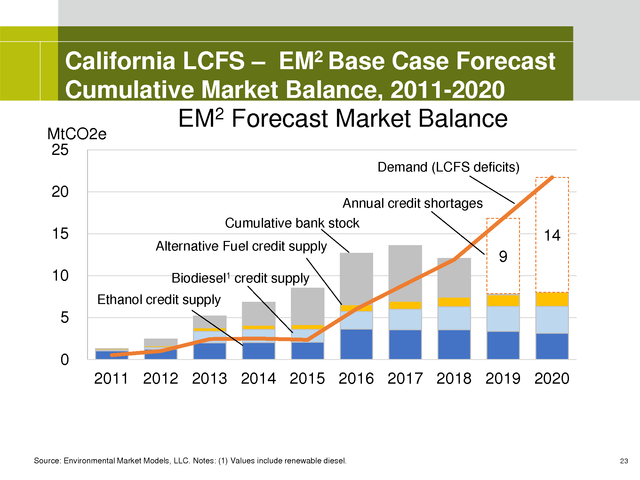
Under the proposed policy LCFS incurs cumulative net deficits in 2019 of 9MtCO2e, which grows to 23MtCO2e by
2020 and 65MtCO2e by 2025, according to our base case. Under the previous LCFS policy adopted in December
2012 the cumulative net deficit in 2020 is 51MtCO2e, 127% higher than the proposed policy.
•
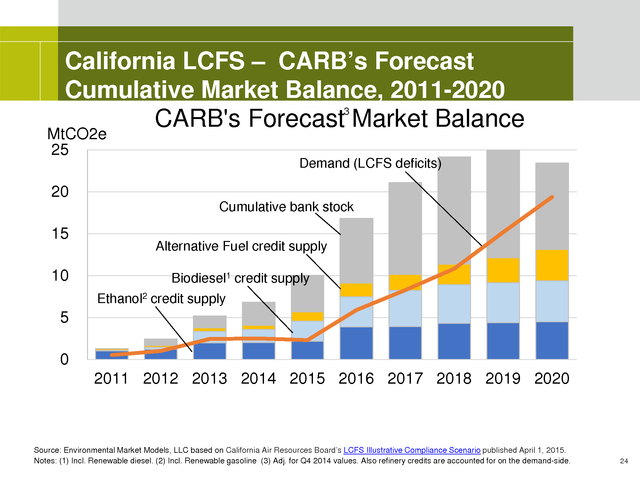
CARB’s forecast is more optimistic, with the market never incurring a cumulative net deficit through 2025.
•
The LCFS target for gasoline is unachievable even if the blendwall increases from E10 to E15. Therefore overcompliance with the diesel fuel target is necessary to meet 2020 compliance.
•
With an E10 blend cap-and-trade and Federal RFS2 compliance costs are 10 and 7 cents per gallon of gasoline,
respectively (at $12.65/CCA and $0.70/RIN); LCFS compliance costs only 0.3 cents per gallon. LCFS credit prices
would have reach ~$735/credit in 2015 to have the same cost impact as cap-and-trade on gasoline blenders.
•
LCFS credit prices now trade at ~$22.
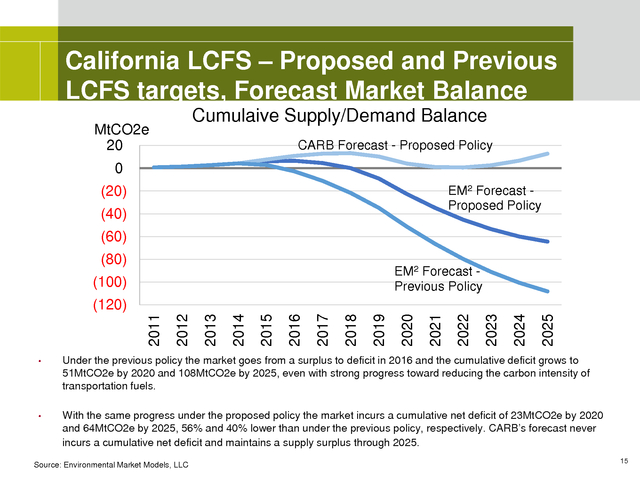
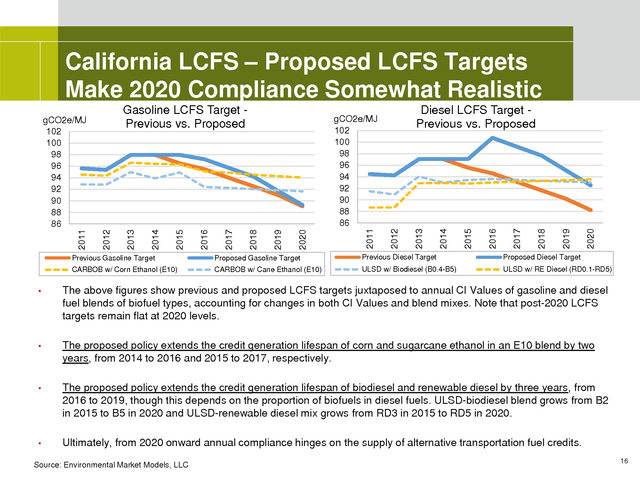
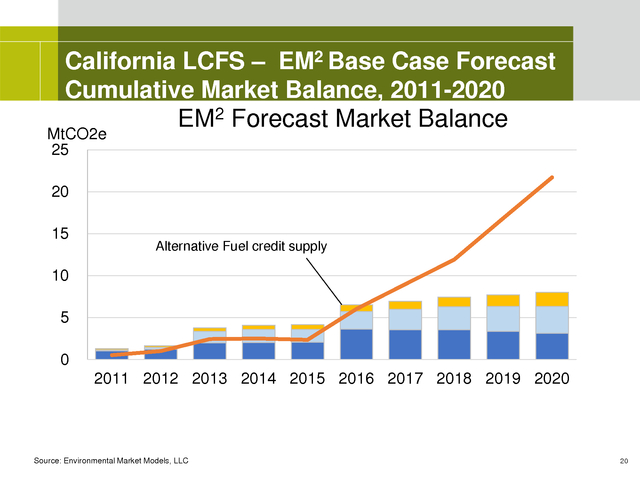
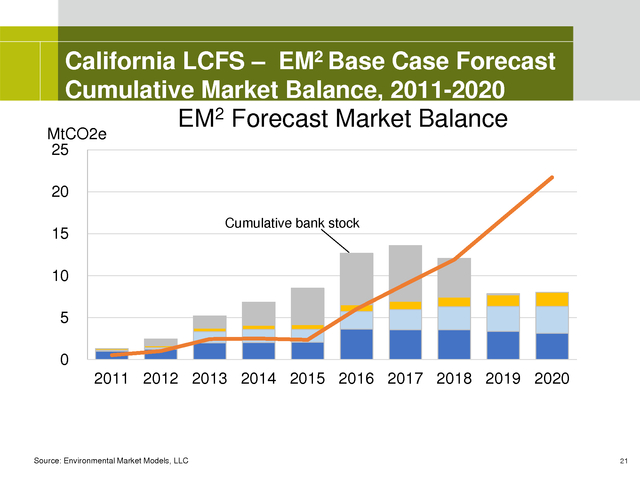
Our price outlook is neutral as oversupply maintains low price levels and credit holders’ unwillingness to sell at prices <$20 ensures prices don’t drop much further. • British Columbia and Oregon have legally binding clean fuel standards and could link with California’s LCFS but their programs do not account for indirect emissions from land-use change, which makes program linkages problematic. 14 . California LCFS – Proposed and Previous LCFS targets, Forecast Market Balance Cumulaive Supply/Demand Balance MtCO2e 20 CARB Forecast - Proposed Policy 0 EM2 Forecast Proposed Policy (20) (40) (60) (80) EM2 Forecast Previous Policy (100) 2025 2024 2023 2022 2021 2020 2019 2018 2017 2016 2015 2014 2013 2012 2011 (120) • Under the previous policy the market goes from a surplus to deficit in 2016 and the cumulative deficit grows to 51MtCO2e by 2020 and 108MtCO2e by 2025, even with strong progress toward reducing the carbon intensity of transportation fuels. • With the same progress under the proposed policy the market incurs a cumulative net deficit of 23MtCO2e by 2020 and 64MtCO2e by 2025, 56% and 40% lower than under the previous policy, respectively. CARB’s forecast never incurs a cumulative net deficit and maintains a supply surplus through 2025. Source: Environmental Market Models, LLC 15 . California LCFS – Proposed LCFS Targets Make 2020 Compliance Somewhat Realistic 2020 2019 2018 2017 2016 2015 2014 2012 2011 2020 2019 2013 Diesel LCFS Target Previous vs. Proposed gCO2e/MJ 102 100 98 96 94 92 90 88 86 2018 2017 2016 2015 2014 2012 2011 2013 Gasoline LCFS Target Previous vs. Proposed gCO2e/MJ 102 100 98 96 94 92 90 88 86 Previous Gasoline Target Proposed Gasoline Target Previous Diesel Target Proposed Diesel Target CARBOB w/ Corn Ethanol (E10) CARBOB w/ Cane Ethanol (E10) ULSD w/ Biodiesel (B0.4-B5) ULSD w/ RE Diesel (RD0.1-RD5) • The above figures show previous and proposed LCFS targets juxtaposed to annual CI Values of gasoline and diesel fuel blends of biofuel types, accounting for changes in both CI Values and blend mixes. Note that post-2020 LCFS targets remain flat at 2020 levels. • The proposed policy extends the credit generation lifespan of corn and sugarcane ethanol in an E10 blend by two years, from 2014 to 2016 and 2015 to 2017, respectively. • The proposed policy extends the credit generation lifespan of biodiesel and renewable diesel by three years, from 2016 to 2019, though this depends on the proportion of biofuels in diesel fuels.
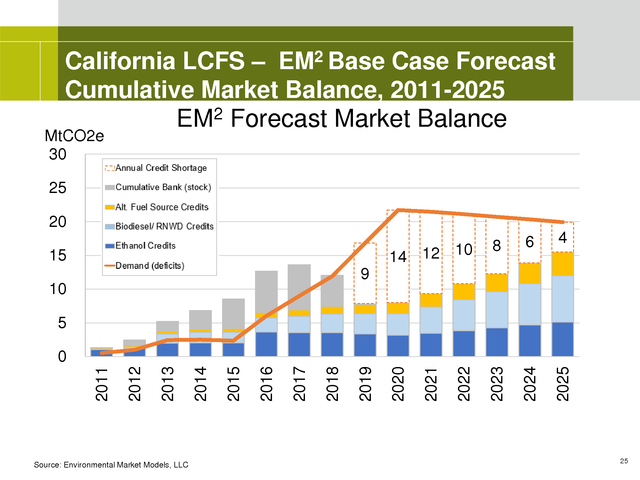
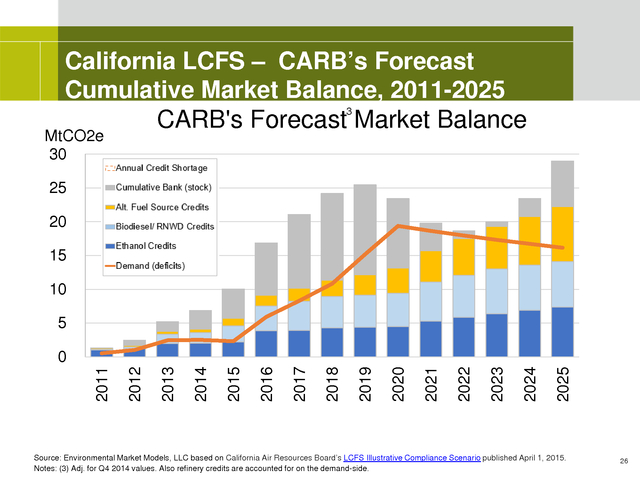
ULSD-biodiesel blend grows from B2 in 2015 to B5 in 2020 and ULSD-renewable diesel mix grows from RD3 in 2015 to RD5 in 2020. • Ultimately, from 2020 onward annual compliance hinges on the supply of alternative transportation fuel credits. Source: Environmental Market Models, LLC 16 . California LCFS – EM2 Base Case Forecast Cumulative Market Balance, 2011-2020 EM2 Forecast Market Balance MtCO2e 25 Demand (LCFS deficits) 20 15 10 5 0 2011 2012 2013 2014 2015 2016 2017 2018 2019 2020 Source: Environmental Market Models, LLC 17 . California LCFS – EM2 Base Case Forecast Cumulative Market Balance, 2011-2020 EM2 Forecast Market Balance MtCO2e 25 20 15 10 Ethanol credit supply 5 0 2011 2012 2013 2014 2015 2016 2017 2018 2019 2020 Source: Environmental Market Models, LLC 18 . California LCFS – EM2 Base Case Forecast Cumulative Market Balance, 2011-2020 EM2 Forecast Market Balance MtCO2e 25 20 15 10 Biodiesel1 credit supply 5 0 2011 2012 2013 2014 2015 2016 2017 2018 2019 2020 Source: Environmental Market Models, LLC. Notes: (1) Values include renewable diesel. 19 . California LCFS – EM2 Base Case Forecast Cumulative Market Balance, 2011-2020 EM2 Forecast Market Balance MtCO2e 25 20 15 Alternative Fuel credit supply 10 5 0 2011 2012 2013 2014 2015 2016 2017 2018 2019 2020 Source: Environmental Market Models, LLC 20 . California LCFS – EM2 Base Case Forecast Cumulative Market Balance, 2011-2020 EM2 Forecast Market Balance MtCO2e 25 20 Cumulative bank stock 15 10 5 0 2011 2012 2013 2014 2015 2016 2017 2018 2019 2020 Source: Environmental Market Models, LLC 21 . California LCFS – EM2 Base Case Forecast Cumulative Market Balance, 2011-2020 EM2 Forecast Market Balance MtCO2e 25 20 Annual credit shortages 15 14 9 10 5 0 2011 2012 2013 2014 2015 2016 2017 2018 2019 2020 Source: Environmental Market Models, LLC 22 . California LCFS – EM2 Base Case Forecast Cumulative Market Balance, 2011-2020 EM2 Forecast Market Balance MtCO2e 25 Demand (LCFS deficits) 20 15 10 Annual credit shortages Cumulative bank stock Alternative Fuel credit supply 14 9 Biodiesel1 credit supply Ethanol credit supply 5 0 2011 2012 2013 2014 2015 2016 2017 2018 2019 2020 Source: Environmental Market Models, LLC. Notes: (1) Values include renewable diesel. 23 . California LCFS – CARB’s Forecast Cumulative Market Balance, 2011-2020 CARB's Forecast3 Market Balance MtCO2e 25 Demand (LCFS deficits) 20 Cumulative bank stock 15 10 Alternative Fuel credit supply Biodiesel1 credit supply Ethanol2 credit supply 5 0 2011 2012 2013 2014 2015 2016 2017 2018 2019 2020 Source: Environmental Market Models, LLC based on California Air Resources Board’s LCFS Illustrative Compliance Scenario published April 1, 2015. Notes: (1) Incl. Renewable diesel. (2) Incl. Renewable gasoline (3) Adj.
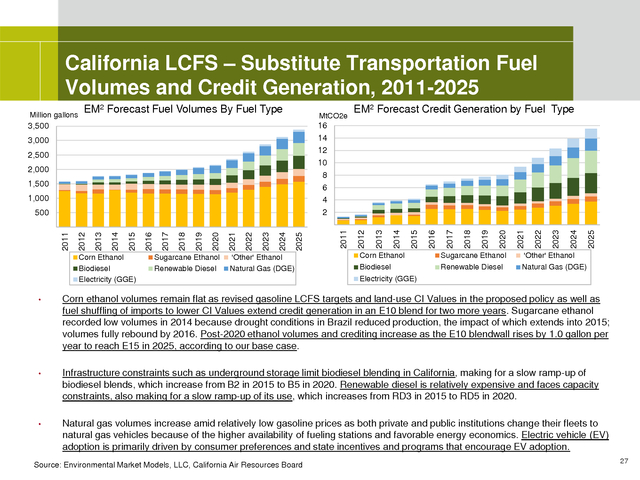
for Q4 2014 values. Also refinery credits are accounted for on the demand-side. 24 . California LCFS – EM2 Base Case Forecast Cumulative Market Balance, 2011-2025 EM2 Forecast Market Balance MtCO2e 30 25 14 12 10 6 4 2023 2024 2025 15 8 2020 20 9 10 5 Source: Environmental Market Models, LLC 2022 2021 2019 2018 2017 2016 2015 2014 2013 2012 2011 0 25 . California LCFS – CARB’s Forecast Cumulative Market Balance, 2011-2025 3 CARB's Forecast Market Balance MtCO2e 30 25 20 15 10 5 2025 2024 2023 2022 2021 2020 2019 2018 2017 2016 2015 2014 2013 2012 2011 0 Source: Environmental Market Models, LLC based on California Air Resources Board’s LCFS Illustrative Compliance Scenario published April 1, 2015. Notes: (3) Adj. for Q4 2014 values. Also refinery credits are accounted for on the demand-side. 26 . California LCFS – Substitute Transportation Fuel Volumes and Credit Generation, 2011-2025 Million gallons EM2 Forecast Fuel Volumes By Fuel Type MtCO2e EM2 Forecast Credit Generation by Fuel Type Corn Ethanol Biodiesel Electricity (GGE) Sugarcane Ethanol Renewable Diesel 'Other' Ethanol Natural Gas (DGE) Corn Ethanol Sugarcane Ethanol 'Other' Ethanol Biodiesel Renewable Diesel 2025 2024 2023 2022 2021 2020 2019 2018 2017 2025 2024 2023 2022 2021 2020 2019 2018 2017 2016 2015 2014 2013 2012 2011 500 2016 1,000 2015 1,500 2014 2,000 2013 2,500 2012 3,000 2011 16 14 12 10 8 6 4 2 3,500 Natural Gas (DGE) Electricity (GGE) • Corn ethanol volumes remain flat as revised gasoline LCFS targets and land-use CI Values in the proposed policy as well as fuel shuffling of imports to lower CI Values extend credit generation in an E10 blend for two more years. Sugarcane ethanol recorded low volumes in 2014 because drought conditions in Brazil reduced production, the impact of which extends into 2015; volumes fully rebound by 2016. Post-2020 ethanol volumes and crediting increase as the E10 blendwall rises by 1.0 gallon per year to reach E15 in 2025, according to our base case. • Infrastructure constraints such as underground storage limit biodiesel blending in California, making for a slow ramp-up of biodiesel blends, which increase from B2 in 2015 to B5 in 2020. Renewable diesel is relatively expensive and faces capacity constraints, also making for a slow ramp-up of its use, which increases from RD3 in 2015 to RD5 in 2020. • Natural gas volumes increase amid relatively low gasoline prices as both private and public institutions change their fleets to natural gas vehicles because of the higher availability of fueling stations and favorable energy economics.
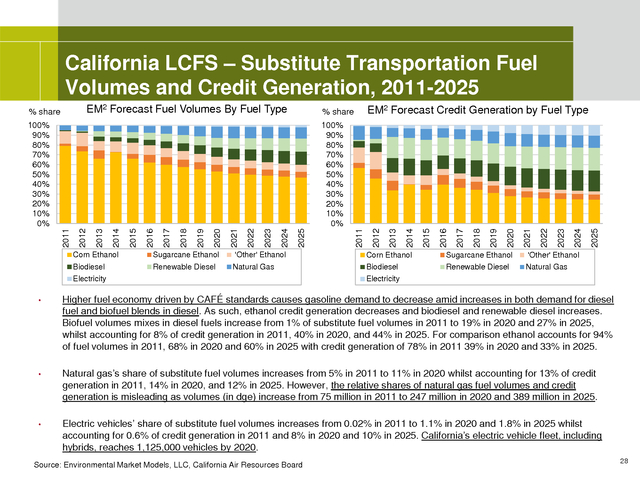
Electric vehicle (EV) adoption is primarily driven by consumer preferences and state incentives and programs that encourage EV adoption. Source: Environmental Market Models, LLC, California Air Resources Board 27 . California LCFS – Substitute Transportation Fuel Volumes and Credit Generation, 2011-2025 EM2 Forecast Fuel Volumes By Fuel Type % share EM2 Forecast Credit Generation by Fuel Type % share 100% 90% 80% 70% 60% 50% 40% 30% 20% 10% 0% Corn Ethanol Sugarcane Ethanol 'Other' Ethanol Corn Ethanol Sugarcane Ethanol 'Other' Ethanol Biodiesel Renewable Diesel Natural Gas Biodiesel Renewable Diesel 2025 2024 2023 2022 2021 2020 2019 2018 2017 2016 2015 2014 2013 2012 2011 2025 2024 2023 2022 2021 2020 2019 2018 2017 2016 2015 2014 2013 2012 2011 100% 90% 80% 70% 60% 50% 40% 30% 20% 10% 0% Natural Gas Electricity Electricity • Higher fuel economy driven by CAFÉ standards causes gasoline demand to decrease amid increases in both demand for diesel fuel and biofuel blends in diesel. As such, ethanol credit generation decreases and biodiesel and renewable diesel increases. Biofuel volumes mixes in diesel fuels increase from 1% of substitute fuel volumes in 2011 to 19% in 2020 and 27% in 2025, whilst accounting for 8% of credit generation in 2011, 40% in 2020, and 44% in 2025. For comparison ethanol accounts for 94% of fuel volumes in 2011, 68% in 2020 and 60% in 2025 with credit generation of 78% in 2011 39% in 2020 and 33% in 2025. • Natural gas’s share of substitute fuel volumes increases from 5% in 2011 to 11% in 2020 whilst accounting for 13% of credit generation in 2011, 14% in 2020, and 12% in 2025. However, the relative shares of natural gas fuel volumes and credit generation is misleading as volumes (in dge) increase from 75 million in 2011 to 247 million in 2020 and 389 million in 2025. • Electric vehicles’ share of substitute fuel volumes increases from 0.02% in 2011 to 1.1% in 2020 and 1.8% in 2025 whilst accounting for 0.6% of credit generation in 2011 and 8% in 2020 and 10% in 2025.
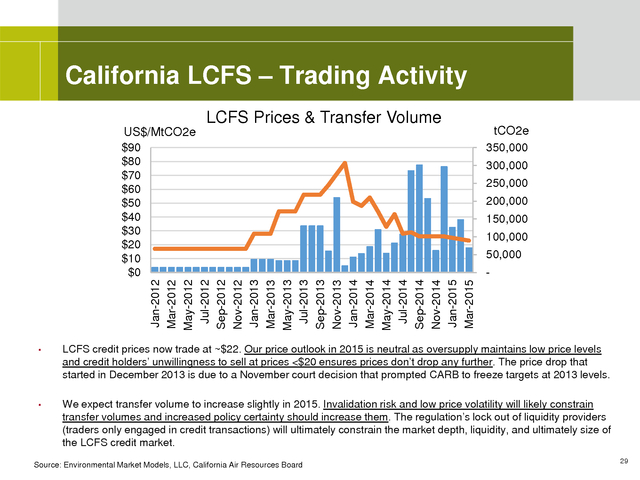
California’s electric vehicle fleet, including hybrids, reaches 1,125,000 vehicles by 2020. Source: Environmental Market Models, LLC, California Air Resources Board 28 . California LCFS – Trading Activity LCFS Prices & Transfer Volume tCO2e US$/MtCO2e $90 $80 $70 $60 $50 $40 $30 $20 $10 $0 350,000 300,000 250,000 200,000 150,000 100,000 50,000 Jan-2012 Mar-2012 May-2012 Jul-2012 Sep-2012 Nov-2012 Jan-2013 Mar-2013 May-2013 Jul-2013 Sep-2013 Nov-2013 Jan-2014 Mar-2014 May-2014 Jul-2014 Sep-2014 Nov-2014 Jan-2015 Mar-2015 - • LCFS credit prices now trade at ~$22. Our price outlook in 2015 is neutral as oversupply maintains low price levels and credit holders’ unwillingness to sell at prices <$20 ensures prices don’t drop any further. The price drop that started in December 2013 is due to a November court decision that prompted CARB to freeze targets at 2013 levels. • We expect transfer volume to increase slightly in 2015. Invalidation risk and low price volatility will likely constrain transfer volumes and increased policy certainty should increase them.
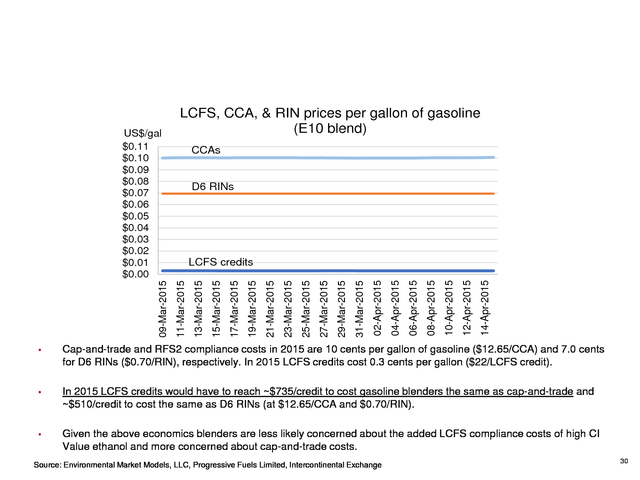
The regulation’s lock out of liquidity providers (traders only engaged in credit transactions) will ultimately constrain the market depth, liquidity, and ultimately size of the LCFS credit market. Source: Environmental Market Models, LLC, California Air Resources Board 29 . California LCFS – Relative Compliance Costs of Environmental Commodities CCAs D6 RINs 14-Apr-2015 12-Apr-2015 10-Apr-2015 08-Apr-2015 06-Apr-2015 04-Apr-2015 02-Apr-2015 31-Mar-2015 29-Mar-2015 27-Mar-2015 25-Mar-2015 23-Mar-2015 21-Mar-2015 19-Mar-2015 17-Mar-2015 15-Mar-2015 13-Mar-2015 LCFS credits 11-Mar-2015 09-Mar-2015 US$/gal $0.11 $0.10 $0.09 $0.08 $0.07 $0.06 $0.05 $0.04 $0.03 $0.02 $0.01 $0.00 LCFS, CCA, & RIN prices per gallon of gasoline (E10 blend) • Cap-and-trade and RFS2 compliance costs in 2015 are 10 cents per gallon of gasoline ($12.65/CCA) and 7.0 cents for D6 RINs ($0.70/RIN), respectively. In 2015 LCFS credits cost 0.3 cents per gallon ($22/LCFS credit). • In 2015 LCFS credits would have to reach ~$735/credit to cost gasoline blenders the same as cap-and-trade and ~$510/credit to cost the same as D6 RINs (at $12.65/CCA and $0.70/RIN). • Given the above economics blenders are less likely concerned about the added LCFS compliance costs of high CI Value ethanol and more concerned about cap-and-trade costs. Source: Environmental Market Models, LLC, Progressive Fuels Limited, Intercontinental Exchange 30 . California LCFS – Interaction with State Cap-and-Trade and the Federal RFS2 • Sometimes it is more economical for refiners to blend high CI biofuels instead of low CI biofuels in order to save on fuel and cap-and-trade compliance costs. In these cases the blender accrues cap-and-trade cost savings yet incurs higher LCFS deficits (demand). This is more likely to occur during the first and second cap-and-trade compliance periods (2013-17) before LCFS cumulative deficits appear in 2019. • Cap-and-trade and the Federal RFS2 drive higher biofuel blends in conventional fuels and therefore facilitate LCFS compliance over the long-term despite any short-term distortions in fuel blend mixes that favor high CI biofuels over low CI biofuels as covered in the previous slide. • The E10 blendwall drives higher biodiesel blends to comply with Federal RFS2 mandates, a byproduct is increased LCFS credit generation. This is critical over the long-term as over-compliance with diesel target is necessary to compensate for under-compliance with the gasoline target. • Cap-and-trade encourages physical blending because CO2 from biofuels is exempt as a covered emission source and LCFS credits alone do not qualify for that exemption.
LCFS compliance via physical blending means less reliance on LCFS credit purchases and a larger LCFS credit bank, which could depress LCFS credit prices over the long-term. • The gap between conventional fuels and their replacements determines the fundamental LCFS credit price. CCA and RIN prices already narrow this gap and therefore should depress LCFS credit prices. A price cap of $200 (inflation adjusted) places substantial limitations on how much LCFS credit prices can narrow this price gap; at $200/credit in 2015 LCFS credit prices would only add $0.027 cents per gallon. • Although cap-and-trade impacts the LCFS more so than vice-versa, LCFS compliance met via the adoption of alternative transportation fuel sources will decrease and shift emissions covered by cap-and-trade from the transportation sector to natural gas suppliers and the power sector. 31 .
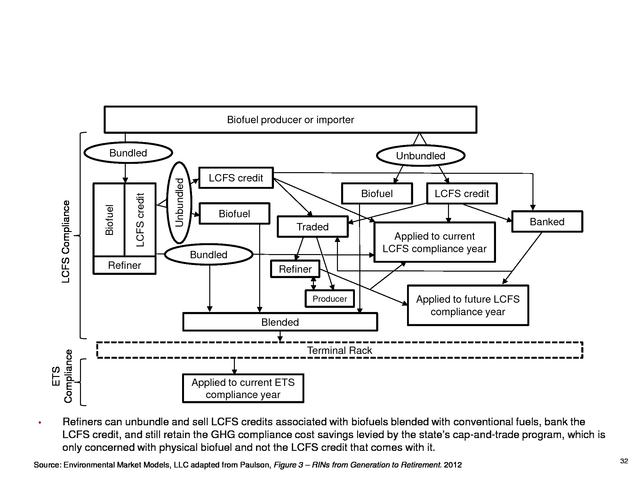
California LCFS – LCFS Credit Value Chain with LCFS and ETS Compliance Biofuel producer or importer Unbundled Unbundled LCFS credit Biofuel LCFS Compliance Bundled LCFS credit Biofuel Biofuel Traded Bundled Refiner LCFS credit Banked Applied to current LCFS compliance year Refiner Producer Applied to future LCFS compliance year ETS Compliance Blended • Terminal Rack Applied to current ETS compliance year Refiners can unbundle and sell LCFS credits associated with biofuels blended with conventional fuels, bank the LCFS credit, and still retain the GHG compliance cost savings levied by the state’s cap-and-trade program, which is only concerned with physical biofuel and not the LCFS credit that comes with it. Source: Environmental Market Models, LLC adapted from Paulson, Figure 3 – RINs from Generation to Retirement. 2012 32 . California LCFS – Potential for Program Linkages • California regulators have expressed interest in linking its LCFS program to other clean fuel programs under development in British Columbia, Oregon, and Washington State. • Linking programs could prove problematic because, unlike California, the two other jurisdictions with legally binding programs (B.C. & O.R.) do not account for indirect emissions from land-use changes. • British Columbia is in the implementation process as LCFS compliance started in July 2013, however a tradable market is not yet operational. B.C.’s LCFS percentage % reduction targets are the same as California’s but compliance is less stringent. The annual market size of B.C.’s program in 2014 is roughly 2.5 million gallons of conventional fuel substitutes (biofuels, alternative fuels) and 0.9MtCO2e of LCFS credits. • Oregon is in the policy-making process since Governor Kate Brown signed an LCFS bill into law. Regulators plan to implement the program in 2016.
Like B.C., Oregon’s LCFS has the same % reduction targets as California’s but it ignores indirect emissions from land-use changes. • Washington State is in the political approval and policy-making process. Governor Jay Inslee instructed the state’s Department of Ecology’s to initiate the LCFS policy-making process. However, the LCFS program remains uncertain because Governor Inslee still wants to go the legislative route. He could circumvent the legislature to enact an LCFS policy if unsuccessful.
Washington State’s targets are more lenient than the other three jurisdictions with clean fuel standards, which could complicate forming market linkages. • We will explore the significance of an LCFS linkages with other jurisdiction in upcoming research. 33 . Economic Topics To Track • What happens if/when net deficits cause market shortages that cannot be met by supply? • What is the impact of linkages to other states implementing/considering LCFS (e.g. OR, WA, BC)? • How related are the economics driving the LCFS credit market to increases in biofuel blending? • How related are the economics driving the LCFS credit market to increases in alternative transport? • What impact can LCFS credit prices have on reducing the carbon intensity of transportation fuels? • How will US Federal RFS2 and state cap-and-trade programs facilitate or hinder LCFS compliance and prices? • Could LCFS cause fuel shuffling by blenders? 34 . Questions? . Contact Information Joshua T. Bledsoe Counsel, Latham & Watkins LLP (Orange County) email: joshua.bledsoe@lw.com Phone: +1.714.755.8049 Thomas Marcello Founder, Environmental Market Models, LLC email: tmarcello@environmentalmarketmodels.com Phone: +1.202.701.7621 Katie Sullivan Director, North America and Climate Finance, IETA email: sullivan@ieta.org Phone: +1.416.500.4335 36 . Disclaimers Although this presentation may provide information concerning potential legal issues, it is not a substitute for legal advice from qualified counsel. Any opinions or conclusions provided in this presentation shall not be ascribed to Latham & Watkins or any clients of the firm. The presentation is not created or designed to address the unique facts or circumstances that may arise in any specific instance, and you should not and are not authorized to rely on this content as a source of legal advice and this seminar material does not create any attorney-client relationship between you and Latham & Watkins. This product is derived from public sources and Environmental Market Models, LLC does not guarantee accuracy or completeness of them but believes them to be reliable. Statements in this product do not necessarily reflect the opinion(s) of Environmental Market Models, LLC, which disclaims any liability arising from the use of this product and none of its content should be construed as providing advice related to financial instruments or investments. The contents within this document do not provide opinion(s) on whether or not to “buy”, “sell”, or “hold” any financial instrument or investment strategy recommendations. © Copyright 2015 Latham & Watkins.
All Rights Reserved. 37 .
Our price outlook is neutral as oversupply maintains low price levels and credit holders’ unwillingness to sell at prices <$20 ensures prices don’t drop much further. • British Columbia and Oregon have legally binding clean fuel standards and could link with California’s LCFS but their programs do not account for indirect emissions from land-use change, which makes program linkages problematic. 14 . California LCFS – Proposed and Previous LCFS targets, Forecast Market Balance Cumulaive Supply/Demand Balance MtCO2e 20 CARB Forecast - Proposed Policy 0 EM2 Forecast Proposed Policy (20) (40) (60) (80) EM2 Forecast Previous Policy (100) 2025 2024 2023 2022 2021 2020 2019 2018 2017 2016 2015 2014 2013 2012 2011 (120) • Under the previous policy the market goes from a surplus to deficit in 2016 and the cumulative deficit grows to 51MtCO2e by 2020 and 108MtCO2e by 2025, even with strong progress toward reducing the carbon intensity of transportation fuels. • With the same progress under the proposed policy the market incurs a cumulative net deficit of 23MtCO2e by 2020 and 64MtCO2e by 2025, 56% and 40% lower than under the previous policy, respectively. CARB’s forecast never incurs a cumulative net deficit and maintains a supply surplus through 2025. Source: Environmental Market Models, LLC 15 . California LCFS – Proposed LCFS Targets Make 2020 Compliance Somewhat Realistic 2020 2019 2018 2017 2016 2015 2014 2012 2011 2020 2019 2013 Diesel LCFS Target Previous vs. Proposed gCO2e/MJ 102 100 98 96 94 92 90 88 86 2018 2017 2016 2015 2014 2012 2011 2013 Gasoline LCFS Target Previous vs. Proposed gCO2e/MJ 102 100 98 96 94 92 90 88 86 Previous Gasoline Target Proposed Gasoline Target Previous Diesel Target Proposed Diesel Target CARBOB w/ Corn Ethanol (E10) CARBOB w/ Cane Ethanol (E10) ULSD w/ Biodiesel (B0.4-B5) ULSD w/ RE Diesel (RD0.1-RD5) • The above figures show previous and proposed LCFS targets juxtaposed to annual CI Values of gasoline and diesel fuel blends of biofuel types, accounting for changes in both CI Values and blend mixes. Note that post-2020 LCFS targets remain flat at 2020 levels. • The proposed policy extends the credit generation lifespan of corn and sugarcane ethanol in an E10 blend by two years, from 2014 to 2016 and 2015 to 2017, respectively. • The proposed policy extends the credit generation lifespan of biodiesel and renewable diesel by three years, from 2016 to 2019, though this depends on the proportion of biofuels in diesel fuels.
ULSD-biodiesel blend grows from B2 in 2015 to B5 in 2020 and ULSD-renewable diesel mix grows from RD3 in 2015 to RD5 in 2020. • Ultimately, from 2020 onward annual compliance hinges on the supply of alternative transportation fuel credits. Source: Environmental Market Models, LLC 16 . California LCFS – EM2 Base Case Forecast Cumulative Market Balance, 2011-2020 EM2 Forecast Market Balance MtCO2e 25 Demand (LCFS deficits) 20 15 10 5 0 2011 2012 2013 2014 2015 2016 2017 2018 2019 2020 Source: Environmental Market Models, LLC 17 . California LCFS – EM2 Base Case Forecast Cumulative Market Balance, 2011-2020 EM2 Forecast Market Balance MtCO2e 25 20 15 10 Ethanol credit supply 5 0 2011 2012 2013 2014 2015 2016 2017 2018 2019 2020 Source: Environmental Market Models, LLC 18 . California LCFS – EM2 Base Case Forecast Cumulative Market Balance, 2011-2020 EM2 Forecast Market Balance MtCO2e 25 20 15 10 Biodiesel1 credit supply 5 0 2011 2012 2013 2014 2015 2016 2017 2018 2019 2020 Source: Environmental Market Models, LLC. Notes: (1) Values include renewable diesel. 19 . California LCFS – EM2 Base Case Forecast Cumulative Market Balance, 2011-2020 EM2 Forecast Market Balance MtCO2e 25 20 15 Alternative Fuel credit supply 10 5 0 2011 2012 2013 2014 2015 2016 2017 2018 2019 2020 Source: Environmental Market Models, LLC 20 . California LCFS – EM2 Base Case Forecast Cumulative Market Balance, 2011-2020 EM2 Forecast Market Balance MtCO2e 25 20 Cumulative bank stock 15 10 5 0 2011 2012 2013 2014 2015 2016 2017 2018 2019 2020 Source: Environmental Market Models, LLC 21 . California LCFS – EM2 Base Case Forecast Cumulative Market Balance, 2011-2020 EM2 Forecast Market Balance MtCO2e 25 20 Annual credit shortages 15 14 9 10 5 0 2011 2012 2013 2014 2015 2016 2017 2018 2019 2020 Source: Environmental Market Models, LLC 22 . California LCFS – EM2 Base Case Forecast Cumulative Market Balance, 2011-2020 EM2 Forecast Market Balance MtCO2e 25 Demand (LCFS deficits) 20 15 10 Annual credit shortages Cumulative bank stock Alternative Fuel credit supply 14 9 Biodiesel1 credit supply Ethanol credit supply 5 0 2011 2012 2013 2014 2015 2016 2017 2018 2019 2020 Source: Environmental Market Models, LLC. Notes: (1) Values include renewable diesel. 23 . California LCFS – CARB’s Forecast Cumulative Market Balance, 2011-2020 CARB's Forecast3 Market Balance MtCO2e 25 Demand (LCFS deficits) 20 Cumulative bank stock 15 10 Alternative Fuel credit supply Biodiesel1 credit supply Ethanol2 credit supply 5 0 2011 2012 2013 2014 2015 2016 2017 2018 2019 2020 Source: Environmental Market Models, LLC based on California Air Resources Board’s LCFS Illustrative Compliance Scenario published April 1, 2015. Notes: (1) Incl. Renewable diesel. (2) Incl. Renewable gasoline (3) Adj.
for Q4 2014 values. Also refinery credits are accounted for on the demand-side. 24 . California LCFS – EM2 Base Case Forecast Cumulative Market Balance, 2011-2025 EM2 Forecast Market Balance MtCO2e 30 25 14 12 10 6 4 2023 2024 2025 15 8 2020 20 9 10 5 Source: Environmental Market Models, LLC 2022 2021 2019 2018 2017 2016 2015 2014 2013 2012 2011 0 25 . California LCFS – CARB’s Forecast Cumulative Market Balance, 2011-2025 3 CARB's Forecast Market Balance MtCO2e 30 25 20 15 10 5 2025 2024 2023 2022 2021 2020 2019 2018 2017 2016 2015 2014 2013 2012 2011 0 Source: Environmental Market Models, LLC based on California Air Resources Board’s LCFS Illustrative Compliance Scenario published April 1, 2015. Notes: (3) Adj. for Q4 2014 values. Also refinery credits are accounted for on the demand-side. 26 . California LCFS – Substitute Transportation Fuel Volumes and Credit Generation, 2011-2025 Million gallons EM2 Forecast Fuel Volumes By Fuel Type MtCO2e EM2 Forecast Credit Generation by Fuel Type Corn Ethanol Biodiesel Electricity (GGE) Sugarcane Ethanol Renewable Diesel 'Other' Ethanol Natural Gas (DGE) Corn Ethanol Sugarcane Ethanol 'Other' Ethanol Biodiesel Renewable Diesel 2025 2024 2023 2022 2021 2020 2019 2018 2017 2025 2024 2023 2022 2021 2020 2019 2018 2017 2016 2015 2014 2013 2012 2011 500 2016 1,000 2015 1,500 2014 2,000 2013 2,500 2012 3,000 2011 16 14 12 10 8 6 4 2 3,500 Natural Gas (DGE) Electricity (GGE) • Corn ethanol volumes remain flat as revised gasoline LCFS targets and land-use CI Values in the proposed policy as well as fuel shuffling of imports to lower CI Values extend credit generation in an E10 blend for two more years. Sugarcane ethanol recorded low volumes in 2014 because drought conditions in Brazil reduced production, the impact of which extends into 2015; volumes fully rebound by 2016. Post-2020 ethanol volumes and crediting increase as the E10 blendwall rises by 1.0 gallon per year to reach E15 in 2025, according to our base case. • Infrastructure constraints such as underground storage limit biodiesel blending in California, making for a slow ramp-up of biodiesel blends, which increase from B2 in 2015 to B5 in 2020. Renewable diesel is relatively expensive and faces capacity constraints, also making for a slow ramp-up of its use, which increases from RD3 in 2015 to RD5 in 2020. • Natural gas volumes increase amid relatively low gasoline prices as both private and public institutions change their fleets to natural gas vehicles because of the higher availability of fueling stations and favorable energy economics.
Electric vehicle (EV) adoption is primarily driven by consumer preferences and state incentives and programs that encourage EV adoption. Source: Environmental Market Models, LLC, California Air Resources Board 27 . California LCFS – Substitute Transportation Fuel Volumes and Credit Generation, 2011-2025 EM2 Forecast Fuel Volumes By Fuel Type % share EM2 Forecast Credit Generation by Fuel Type % share 100% 90% 80% 70% 60% 50% 40% 30% 20% 10% 0% Corn Ethanol Sugarcane Ethanol 'Other' Ethanol Corn Ethanol Sugarcane Ethanol 'Other' Ethanol Biodiesel Renewable Diesel Natural Gas Biodiesel Renewable Diesel 2025 2024 2023 2022 2021 2020 2019 2018 2017 2016 2015 2014 2013 2012 2011 2025 2024 2023 2022 2021 2020 2019 2018 2017 2016 2015 2014 2013 2012 2011 100% 90% 80% 70% 60% 50% 40% 30% 20% 10% 0% Natural Gas Electricity Electricity • Higher fuel economy driven by CAFÉ standards causes gasoline demand to decrease amid increases in both demand for diesel fuel and biofuel blends in diesel. As such, ethanol credit generation decreases and biodiesel and renewable diesel increases. Biofuel volumes mixes in diesel fuels increase from 1% of substitute fuel volumes in 2011 to 19% in 2020 and 27% in 2025, whilst accounting for 8% of credit generation in 2011, 40% in 2020, and 44% in 2025. For comparison ethanol accounts for 94% of fuel volumes in 2011, 68% in 2020 and 60% in 2025 with credit generation of 78% in 2011 39% in 2020 and 33% in 2025. • Natural gas’s share of substitute fuel volumes increases from 5% in 2011 to 11% in 2020 whilst accounting for 13% of credit generation in 2011, 14% in 2020, and 12% in 2025. However, the relative shares of natural gas fuel volumes and credit generation is misleading as volumes (in dge) increase from 75 million in 2011 to 247 million in 2020 and 389 million in 2025. • Electric vehicles’ share of substitute fuel volumes increases from 0.02% in 2011 to 1.1% in 2020 and 1.8% in 2025 whilst accounting for 0.6% of credit generation in 2011 and 8% in 2020 and 10% in 2025.
California’s electric vehicle fleet, including hybrids, reaches 1,125,000 vehicles by 2020. Source: Environmental Market Models, LLC, California Air Resources Board 28 . California LCFS – Trading Activity LCFS Prices & Transfer Volume tCO2e US$/MtCO2e $90 $80 $70 $60 $50 $40 $30 $20 $10 $0 350,000 300,000 250,000 200,000 150,000 100,000 50,000 Jan-2012 Mar-2012 May-2012 Jul-2012 Sep-2012 Nov-2012 Jan-2013 Mar-2013 May-2013 Jul-2013 Sep-2013 Nov-2013 Jan-2014 Mar-2014 May-2014 Jul-2014 Sep-2014 Nov-2014 Jan-2015 Mar-2015 - • LCFS credit prices now trade at ~$22. Our price outlook in 2015 is neutral as oversupply maintains low price levels and credit holders’ unwillingness to sell at prices <$20 ensures prices don’t drop any further. The price drop that started in December 2013 is due to a November court decision that prompted CARB to freeze targets at 2013 levels. • We expect transfer volume to increase slightly in 2015. Invalidation risk and low price volatility will likely constrain transfer volumes and increased policy certainty should increase them.
The regulation’s lock out of liquidity providers (traders only engaged in credit transactions) will ultimately constrain the market depth, liquidity, and ultimately size of the LCFS credit market. Source: Environmental Market Models, LLC, California Air Resources Board 29 . California LCFS – Relative Compliance Costs of Environmental Commodities CCAs D6 RINs 14-Apr-2015 12-Apr-2015 10-Apr-2015 08-Apr-2015 06-Apr-2015 04-Apr-2015 02-Apr-2015 31-Mar-2015 29-Mar-2015 27-Mar-2015 25-Mar-2015 23-Mar-2015 21-Mar-2015 19-Mar-2015 17-Mar-2015 15-Mar-2015 13-Mar-2015 LCFS credits 11-Mar-2015 09-Mar-2015 US$/gal $0.11 $0.10 $0.09 $0.08 $0.07 $0.06 $0.05 $0.04 $0.03 $0.02 $0.01 $0.00 LCFS, CCA, & RIN prices per gallon of gasoline (E10 blend) • Cap-and-trade and RFS2 compliance costs in 2015 are 10 cents per gallon of gasoline ($12.65/CCA) and 7.0 cents for D6 RINs ($0.70/RIN), respectively. In 2015 LCFS credits cost 0.3 cents per gallon ($22/LCFS credit). • In 2015 LCFS credits would have to reach ~$735/credit to cost gasoline blenders the same as cap-and-trade and ~$510/credit to cost the same as D6 RINs (at $12.65/CCA and $0.70/RIN). • Given the above economics blenders are less likely concerned about the added LCFS compliance costs of high CI Value ethanol and more concerned about cap-and-trade costs. Source: Environmental Market Models, LLC, Progressive Fuels Limited, Intercontinental Exchange 30 . California LCFS – Interaction with State Cap-and-Trade and the Federal RFS2 • Sometimes it is more economical for refiners to blend high CI biofuels instead of low CI biofuels in order to save on fuel and cap-and-trade compliance costs. In these cases the blender accrues cap-and-trade cost savings yet incurs higher LCFS deficits (demand). This is more likely to occur during the first and second cap-and-trade compliance periods (2013-17) before LCFS cumulative deficits appear in 2019. • Cap-and-trade and the Federal RFS2 drive higher biofuel blends in conventional fuels and therefore facilitate LCFS compliance over the long-term despite any short-term distortions in fuel blend mixes that favor high CI biofuels over low CI biofuels as covered in the previous slide. • The E10 blendwall drives higher biodiesel blends to comply with Federal RFS2 mandates, a byproduct is increased LCFS credit generation. This is critical over the long-term as over-compliance with diesel target is necessary to compensate for under-compliance with the gasoline target. • Cap-and-trade encourages physical blending because CO2 from biofuels is exempt as a covered emission source and LCFS credits alone do not qualify for that exemption.
LCFS compliance via physical blending means less reliance on LCFS credit purchases and a larger LCFS credit bank, which could depress LCFS credit prices over the long-term. • The gap between conventional fuels and their replacements determines the fundamental LCFS credit price. CCA and RIN prices already narrow this gap and therefore should depress LCFS credit prices. A price cap of $200 (inflation adjusted) places substantial limitations on how much LCFS credit prices can narrow this price gap; at $200/credit in 2015 LCFS credit prices would only add $0.027 cents per gallon. • Although cap-and-trade impacts the LCFS more so than vice-versa, LCFS compliance met via the adoption of alternative transportation fuel sources will decrease and shift emissions covered by cap-and-trade from the transportation sector to natural gas suppliers and the power sector. 31 .
California LCFS – LCFS Credit Value Chain with LCFS and ETS Compliance Biofuel producer or importer Unbundled Unbundled LCFS credit Biofuel LCFS Compliance Bundled LCFS credit Biofuel Biofuel Traded Bundled Refiner LCFS credit Banked Applied to current LCFS compliance year Refiner Producer Applied to future LCFS compliance year ETS Compliance Blended • Terminal Rack Applied to current ETS compliance year Refiners can unbundle and sell LCFS credits associated with biofuels blended with conventional fuels, bank the LCFS credit, and still retain the GHG compliance cost savings levied by the state’s cap-and-trade program, which is only concerned with physical biofuel and not the LCFS credit that comes with it. Source: Environmental Market Models, LLC adapted from Paulson, Figure 3 – RINs from Generation to Retirement. 2012 32 . California LCFS – Potential for Program Linkages • California regulators have expressed interest in linking its LCFS program to other clean fuel programs under development in British Columbia, Oregon, and Washington State. • Linking programs could prove problematic because, unlike California, the two other jurisdictions with legally binding programs (B.C. & O.R.) do not account for indirect emissions from land-use changes. • British Columbia is in the implementation process as LCFS compliance started in July 2013, however a tradable market is not yet operational. B.C.’s LCFS percentage % reduction targets are the same as California’s but compliance is less stringent. The annual market size of B.C.’s program in 2014 is roughly 2.5 million gallons of conventional fuel substitutes (biofuels, alternative fuels) and 0.9MtCO2e of LCFS credits. • Oregon is in the policy-making process since Governor Kate Brown signed an LCFS bill into law. Regulators plan to implement the program in 2016.
Like B.C., Oregon’s LCFS has the same % reduction targets as California’s but it ignores indirect emissions from land-use changes. • Washington State is in the political approval and policy-making process. Governor Jay Inslee instructed the state’s Department of Ecology’s to initiate the LCFS policy-making process. However, the LCFS program remains uncertain because Governor Inslee still wants to go the legislative route. He could circumvent the legislature to enact an LCFS policy if unsuccessful.
Washington State’s targets are more lenient than the other three jurisdictions with clean fuel standards, which could complicate forming market linkages. • We will explore the significance of an LCFS linkages with other jurisdiction in upcoming research. 33 . Economic Topics To Track • What happens if/when net deficits cause market shortages that cannot be met by supply? • What is the impact of linkages to other states implementing/considering LCFS (e.g. OR, WA, BC)? • How related are the economics driving the LCFS credit market to increases in biofuel blending? • How related are the economics driving the LCFS credit market to increases in alternative transport? • What impact can LCFS credit prices have on reducing the carbon intensity of transportation fuels? • How will US Federal RFS2 and state cap-and-trade programs facilitate or hinder LCFS compliance and prices? • Could LCFS cause fuel shuffling by blenders? 34 . Questions? . Contact Information Joshua T. Bledsoe Counsel, Latham & Watkins LLP (Orange County) email: joshua.bledsoe@lw.com Phone: +1.714.755.8049 Thomas Marcello Founder, Environmental Market Models, LLC email: tmarcello@environmentalmarketmodels.com Phone: +1.202.701.7621 Katie Sullivan Director, North America and Climate Finance, IETA email: sullivan@ieta.org Phone: +1.416.500.4335 36 . Disclaimers Although this presentation may provide information concerning potential legal issues, it is not a substitute for legal advice from qualified counsel. Any opinions or conclusions provided in this presentation shall not be ascribed to Latham & Watkins or any clients of the firm. The presentation is not created or designed to address the unique facts or circumstances that may arise in any specific instance, and you should not and are not authorized to rely on this content as a source of legal advice and this seminar material does not create any attorney-client relationship between you and Latham & Watkins. This product is derived from public sources and Environmental Market Models, LLC does not guarantee accuracy or completeness of them but believes them to be reliable. Statements in this product do not necessarily reflect the opinion(s) of Environmental Market Models, LLC, which disclaims any liability arising from the use of this product and none of its content should be construed as providing advice related to financial instruments or investments. The contents within this document do not provide opinion(s) on whether or not to “buy”, “sell”, or “hold” any financial instrument or investment strategy recommendations. © Copyright 2015 Latham & Watkins.
All Rights Reserved. 37 .