


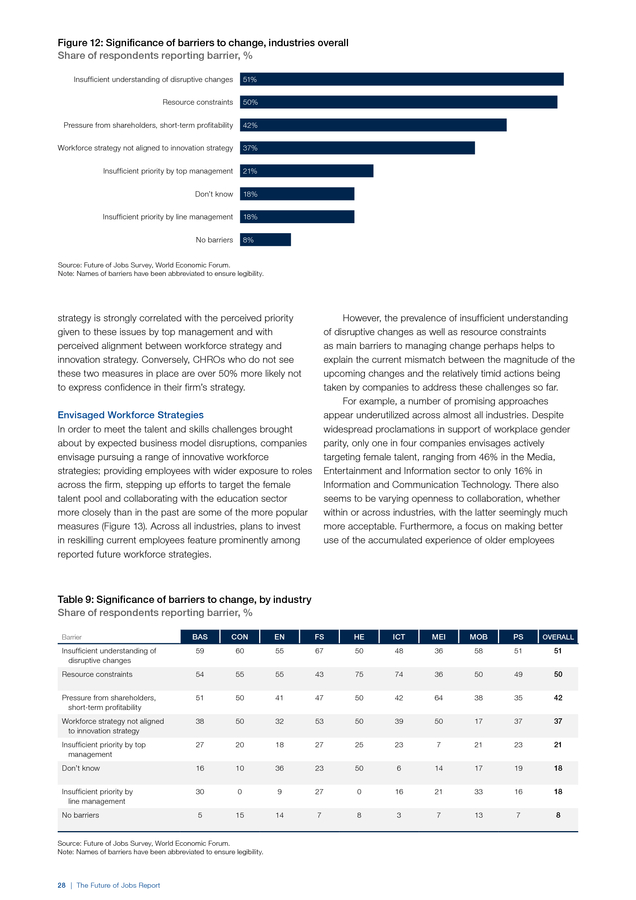
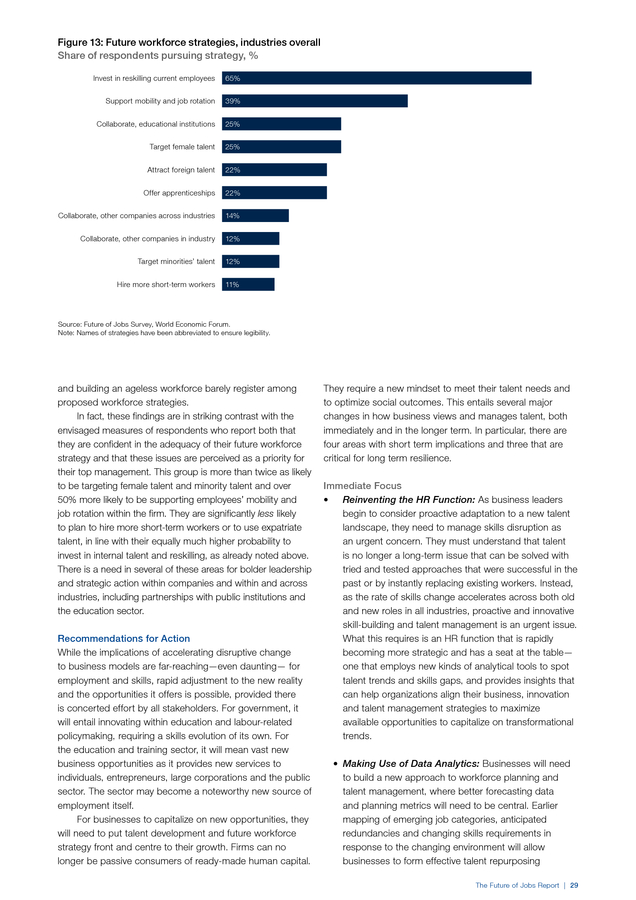


Description
Global Challenge Insight Report
The Future of Jobs
Employment, Skills and
Workforce Strategy for the
Fourth Industrial Revolution
January 2016
.
. Global Challenge Insight Report
The Future of Jobs
Employment, Skills and
Workforce Strategy for the
Fourth Industrial Revolution
January 2016
. TERMS OF USE AND DISCLAIMER
The Future of Jobs Report (herein: “Report”) presents information
and data that were compiled and/or collected by the World
Economic Forum (all information and data referred herein as
“Data”). Data in this Report is subject to change without notice.
The terms country and nation as used in this report do not in
all cases refer to a territorial entity that is a state as understood
by international law and practice. The term covers well-defined,
geographically self-contained economic areas that may not be
states but for which statistical data are maintained on a separate
and independent basis.
Although the World Economic Forum takes every reasonable
step to ensure that the Data thus compiled and/or collected is
accurately reflected in this Report, the World Economic Forum,
its agents, officers, and employees: (i) provide the Data “as is,
as available” and without warranty of any kind, either express or
implied, including, without limitation, warranties of merchantability,
fitness for a particular purpose and non-infringement; (ii) make
no representations, express or implied, as to the accuracy of the
Data contained in this Report or its suitability for any particular
purpose; (iii) accept no liability for any use of the said Data or
reliance placed on it, in particular, for any interpretation, decisions,
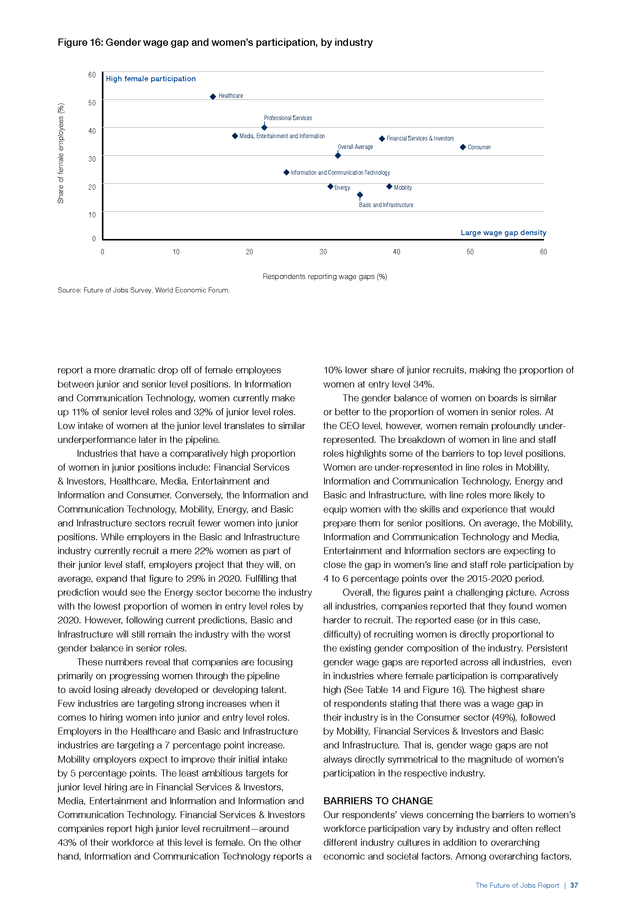
or actions based on the Data in this Report.
Other parties may have ownership interests in some of the Data
contained in this Report. The World Economic Forum in no way
represents or warrants that it owns or controls all rights in all Data,
and the World Economic Forum will not be liable to users for any
claims brought against users by third parties in connection with
their use of any Data.
The World Economic Forum, its agents, officers, and employees
do not endorse or in any respect warrant any third-party products
or services by virtue of any Data, material, or content referred to
or included in this Report.
Users shall not infringe upon the integrity of the Data and in
particular shall refrain from any act of alteration of the Data that
intentionally affects its nature or accuracy.
If the Data is materially transformed by the user, this must be stated explicitly along with the required source citation. For Data compiled by parties other than the World Economic Forum, users must refer to these parties’ terms of use, in particular concerning the attribution, distribution, and reproduction of the Data. When Data for which the World Economic Forum is the source (herein “World Economic Forum”) is distributed or reproduced, it must appear accurately and be attributed to the World Economic Forum. This source attribution requirement is attached to any use of Data, whether obtained directly from the World Economic Forum or from a user. Users who make World Economic Forum Data available to other users through any type of distribution or download environment agree to make reasonable efforts to communicate and promote compliance by their end users with these terms. Users who intend to sell World Economic Forum Data as part of a database or as a standalone product must first obtain the permission from the World Economic Forum (humancapital@weforum.org). ©2016 World Economic Forum All rights reserved. No part of this publication may be reproduced or transmitted in any form or by any means, including photocopying and recording, or by any information storage and retrieval system. REF 010116 . Contents v Preface 1 PART 1: PREPARING FOR THE WORKFORCE OF THE FOURTH INDUSTRIAL REVOLUTION 3 Chapter 1: The Future of Jobs and Skills 3 Introduction 5 Drivers of Change 10 Employment Trends 19 Skills Stability 26 Future Workforce Strategy 33 34 36 37 39 40 Chapter 2: The Industry Gender Gap The Business Case for Change Gaps in the Female Talent Pipeline Barriers to Change Women and Work in the Fourth Industrial Revolution Approaches to Leveraging Female Talent 43 Endnotes 45 References and Further Reading 49 Appendix A: Report Methodology 57 Appendix B: Industry and Regional Classifications 59 PART 2: INDUSTRY, REGIONAL AND GENDER GAP PROFILES 61 69 71 91 123 User’s Guide: How to Read the Industry, Regional and Gender Gap Profiles List of Industry, Regional and Gender Gap Profiles Industry Profiles Country and Regional Profiles Industry Gender Gap Profiles 143 Acknowledgements 145 Contributors 147 Global Challenge Partners The Future of Jobs Report | iii . iv | The Future of Jobs Report . Preface KLAUS SCHWAB Founder and Executive Chairman RICHARD SAMANS Member of the Managing Board Today, we are at the beginning of a Fourth Industrial Revolution. Developments in genetics, artificial intelligence, robotics, nanotechnology, 3D printing and biotechnology, to name just a few, are all building on and amplifying one another. This will lay the foundation for a revolution more comprehensive and all-encompassing than anything we have ever seen. Smart systems—homes, factories, farms, grids or cities—will help tackle problems ranging from supply chain management to climate change.
The rise of the sharing economy will allow people to monetize everything from their empty house to their car. While the impending change holds great promise, the patterns of consumption, production and employment created by it also pose major challenges requiring proactive adaptation by corporations, governments and individuals. Concurrent to the technological revolution are a set of broader socio-economic, geopolitical and demographic drivers of change, each interacting in multiple directions and intensifying one another. As entire industries adjust, most occupations are undergoing a fundamental transformation. While some jobs are threatened by redundancy and others grow rapidly, existing jobs are also going through a change in the skill sets required to do them. The debate on these transformations is often polarized between those who foresee limitless new opportunities and those that foresee massive dislocation of jobs.
In fact, the reality is highly specific to the industry, region and occupation in question as well as the ability of various stakeholders to manage change. The Future of Jobs Report is a first step in becoming specific about the changes at hand. It taps into the knowledge of those who are best placed to observe the dynamics of workforces—Chief Human Resources and Strategy Officers—by asking them what the current shifts mean, specifically for employment, skills and recruitment across industries and geographies. In particular, we have introduced a new measure—skills stability—to quantify the degree of skills disruption within an occupation, a job family or an entire industry.
We have also been able to provide an outlook on the gender dynamics of the changes underway, a key element in understanding how the benefits and burdens of the Fourth Industrial Revolution will be distributed. Overall, there is a modestly positive outlook for employment across most industries, with jobs growth expected in several sectors. However, it is also clear that this need for more talent in certain job categories is accompanied by high skills instability across all job categories. Combined together, net job growth and skills instability result in most businesses currently facing major recruitment challenges and talent shortages, a pattern already evident in the results and set to get worse over the next five years. The question, then, is how business, government and individuals will react to these developments.
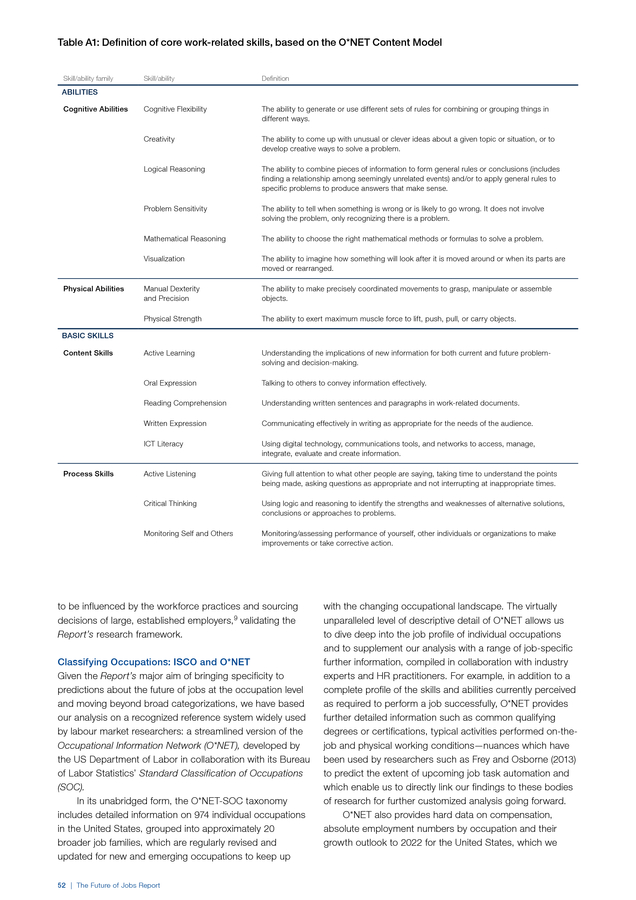
To prevent a worst-case scenario—technological change accompanied by talent shortages, mass unemployment and growing inequality—reskilling and upskilling of today’s workers will be critical. While much has been said about the need for reform in basic education, it is simply not possible to weather the current technological revolution by waiting for the next generation’s workforce to become better prepared. Instead it is critical that businesses take an active role in supporting their current workforces through re-training, that individuals take a proactive approach to their own lifelong learning and that governments create the enabling environment, rapidly and creatively, to assist these efforts. In particular, business collaboration within industries to create larger pools of skilled talent will become indispensable, as will multi-sector skilling partnerships that leverage the very same collaborative models that underpin many of the technology-driven business changes underway today. Additionally, better data and planning metrics, such as those in this Report, are critical in helping to anticipate and proactively manage the current transition in labour markets. We are grateful for the leadership of Jeffrey Joerres, Executive Chairman Emeritus, ManpowerGroup and Chair of the Global Agenda Council on the Future of Jobs; Jamie McAuliffe, President and CEO, Education for Employment and Vice-Chair of the Global Agenda Council on the Future of Jobs; J.
Frank Brown, Managing Director and Chief Operating Officer, General Atlantic LLC and Chair of the Global Agenda Council on Gender Parity and Mara Swan, Executive Vice-President, Global Strategy and Talent, ManpowerGroup and Vice-Chair of the Global Agenda Council on Gender Parity. We would also like to express our appreciation to Till Leopold, Project Lead, Employment, Skills and Human Capital Initiative; Vesselina Ratcheva, Data Analyst, Employment and Gender Initiatives; and Saadia Zahidi, Head of Employment and Gender Initiatives, for their dedication to this Report. We would like to thank Yasmina Bekhouche, Kristin Keveloh, Paulina Padilla Ugarte, Valerie Peyre, Pearl Samandari and Susan Wilkinson for their support of this project at the World Economic Forum. Finally, we welcome the untiring commitment of the Partners of the Global Challenge Initiative on Employment, Skills and Human Capital and the Global Challenge Initiative on The Future of Jobs Report | v . Gender Parity, who have each been instrumental in shaping this combined Report of the two Global Challenge Initiatives. The current technological revolution need not become a race between humans and machines but rather an opportunity for work to truly become a channel through which people recognize their full potential. To ensure that we achieve this vision, we must become more specific and much faster in understanding the changes underway and cognizant of our collective responsibility to lead our businesses and communities through this transformative moment. vi | The Future of Jobs Report . Part 1 Preparing for the Workforce of the Fourth Industrial Revolution . . Chapter 1: The Future of Jobs and Skills INTRODUCTION Disruptive changes to business models will have a profound impact on the employment landscape over the coming years. Many of the major drivers of transformation currently affecting global industries are expected to have a significant impact on jobs, ranging from significant job creation to job displacement, and from heightened labour productivity to widening skills gaps. In many industries and countries, the most in-demand occupations or specialties did not exist 10 or even five years ago, and the pace of change is set to accelerate. By one popular estimate, 65% of children entering primary school today will ultimately end up working in completely new job types that don’t yet exist.1 In such a rapidly evolving employment landscape, the ability to anticipate and prepare for future skills requirements, job content and the aggregate effect on employment is increasingly critical for businesses, governments and individuals in order to fully seize the opportunities presented by these trends—and to mitigate undesirable outcomes. Past waves of technological advancement and demographic change have led to increased prosperity, productivity and job creation.
This does not mean, however, that these transitions were free of risk or difficulty. Anticipating and preparing for the current transition is therefore critical. As a core component of the World Economic Forum’s Global Challenge Initiative on Employment, Skills and Human Capital, the Future of Jobs project aims to bring specificity to the upcoming disruptions to the employment and skills landscape in industries and regions—and to stimulate deeper thinking about how business and governments can manage this change.
The industry analysis presented in this Report will form the basis of dialogue with industry leaders to address industry-specific talent challenges, while the country and regional analysis presented in this Report will be integrated into national and regional public-private collaborations to promote employment and skills. The Report’s research framework has been shaped and developed in collaboration with the Global Agenda Council on the Future of Jobs and the Global Agenda Council on Gender Parity, including leading experts from academia, international organizations, professional service firms and the heads of human resources of major organizations. The employer survey at the heart of this Report was conducted through the World Economic Forum’s membership and with the particular support of three Employment, Skills and Human Capital Global Challenge Partners: Adecco Group, ManpowerGroup and Mercer. This Report seeks to understand the current and future impact of key disruptions on employment levels, skill sets and recruitment patterns in different industries and countries. It does so by asking the Chief Human Resources Officers (CHROs) of today’s largest employers to imagine how jobs in their industry will change up to the year 2020— far enough into the future for many of today’s expected trends and disruptions to have begun taking hold, yet close enough to consider adaptive action today, rather than merely speculate on future risks and opportunities. While only a minority of the world’s global workforce of more than three billion people is directly employed by large and emerging multinational employers, these companies often act as anchors for smaller firms and local entrepreneurship ecosystems.
Therefore, in addition to their own significant share of employment, workforce-planning decisions by these firms have the potential to transform local labour markets through indirect employment and by setting the pace for changing skills and occupational requirements. This Report aims to serve as a call to action. While the implications of current disruptions to business models for jobs are far-reaching, even daunting, rapid adjustment to the new reality and its opportunities is possible, provided there is concerted effort by all stakeholders. By evaluating the future labour market from the perspective of some of the world’s largest employers we hope to improve the current stock of knowledge around anticipated skills needs, recruitment patterns and occupational requirements. Furthermore, it is our hope that this knowledge can incentivize and enhance partnerships between governments, educators, training providers, workers and employers in order to better manage the transformative impact of the Fourth Industrial Revolution on employment, skills and education. Survey and Research Design The dataset that forms the basis of this Report is the result of an extensive survey of CHROs and other senior talent and strategy executives of leading global employers, representing more than 13 million employees across 9 broad industry sectors in 15 major developed and emerging economies and regional economic areas.
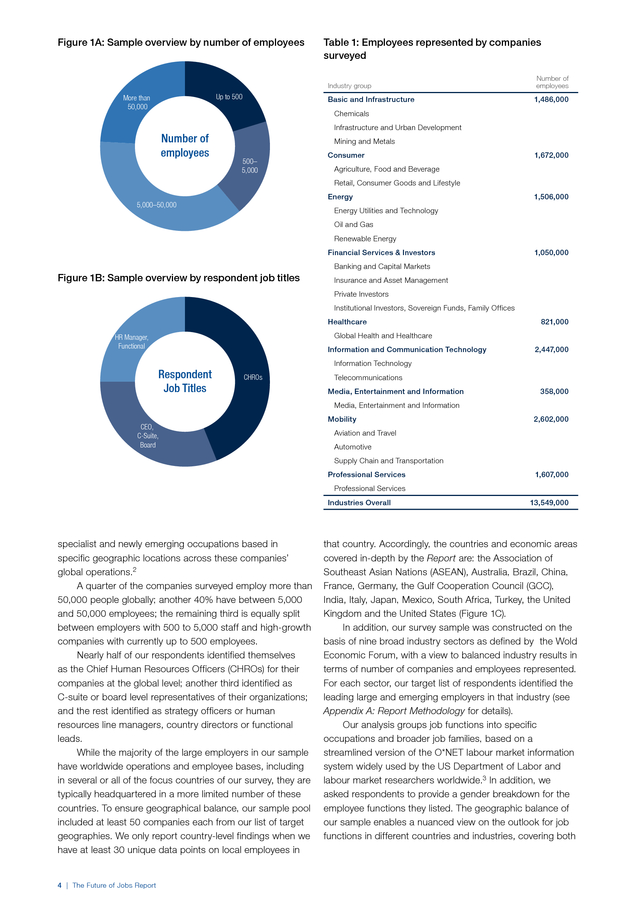
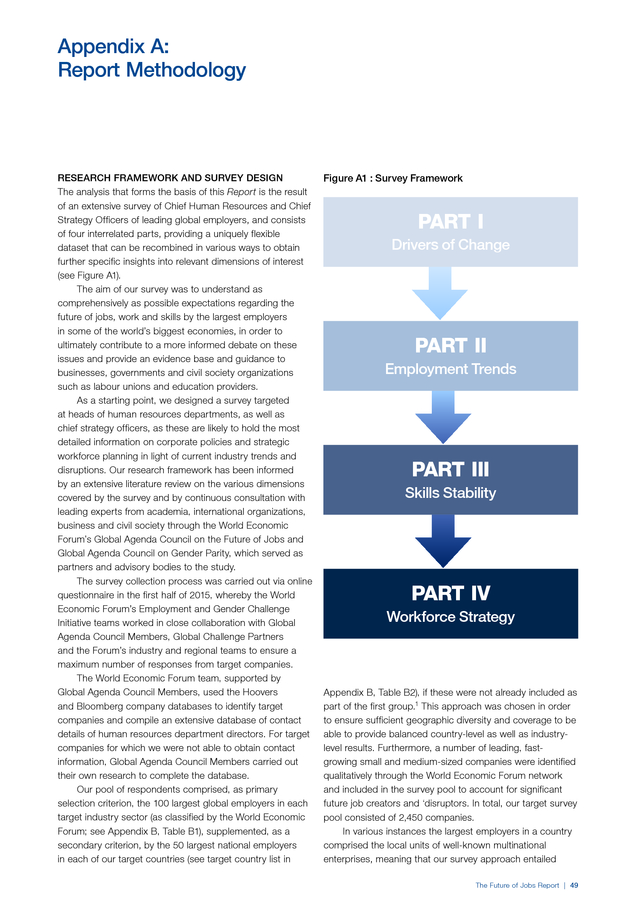
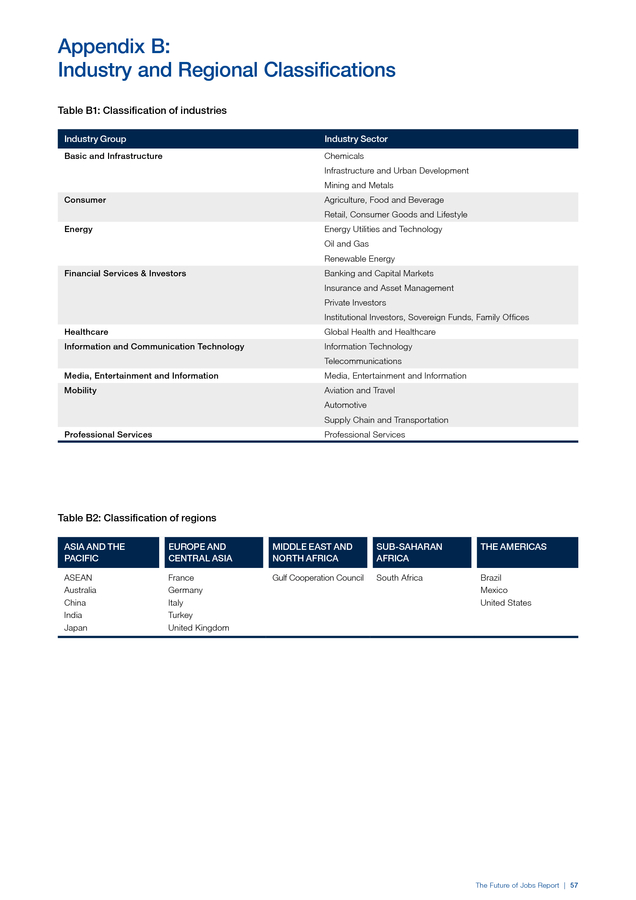
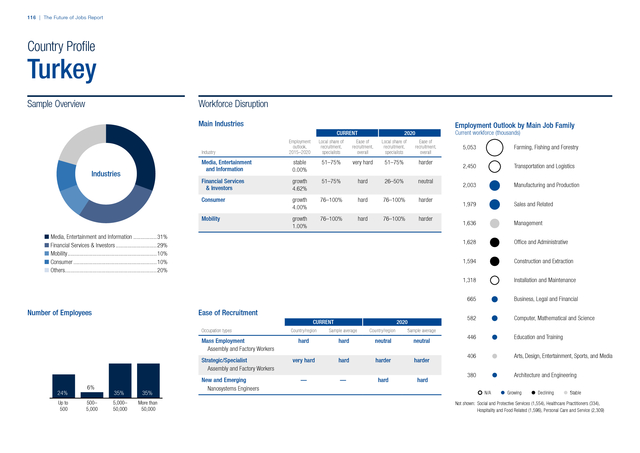
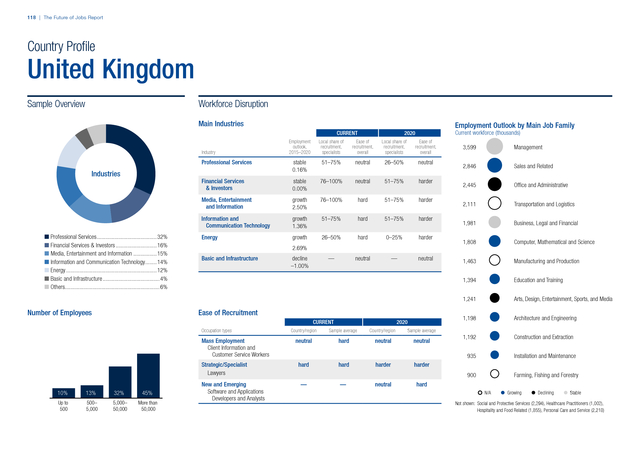
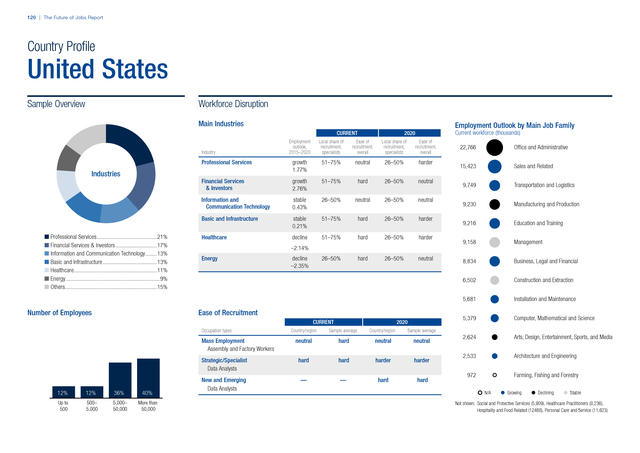
Our target pool of respondents comprised, as the primary selection criterion, the 100 largest global employers in each of our target industry sectors (as classified by the World Economic Forum; see Appendix B, Table B1). A total of 371 individual companies from these industries and regions responded to the survey over the first half of 2015, providing us with 1,346 detailed occupation-level data points on mass employment, The Future of Jobs Report | 3 . Figure 1A: Sample overview by number of employees Table 1: Employees represented by companies surveyed Industry group Basic and Infrastructure Up to 500 More than 50,000 Number of employees 1,486,000 Chemicals Number of employees Infrastructure and Urban Development Mining and Metals 500– 5,000 Consumer 1,672,000 Agriculture, Food and Beverage Retail, Consumer Goods and Lifestyle Energy 5,000–50,000 1,506,000 Energy Utilities and Technology Oil and Gas Renewable Energy Financial Services & Investors 1,050,000 Banking and Capital Markets Figure 1B: Sample overview by respondent job titles Insurance and Asset Management Private Investors Institutional Investors, Sovereign Funds, Family Offices Healthcare 821,000 Global Health and Healthcare HR Manager, Functional Information and Communication Technology Respondent Job Titles 2,447,000 Information Technology CHROs Telecommunications Media, Entertainment and Information 358,000 Media, Entertainment and Information CEO, C-Suite, Board Mobility 2,602,000 Aviation and Travel Automotive Supply Chain and Transportation Professional Services 1,607,000 Professional Services Industries Overall specialist and newly emerging occupations based in specific geographic locations across these companies’ global operations.2 A quarter of the companies surveyed employ more than 50,000 people globally; another 40% have between 5,000 and 50,000 employees; the remaining third is equally split between employers with 500 to 5,000 staff and high-growth companies with currently up to 500 employees. Nearly half of our respondents identified themselves as the Chief Human Resources Officers (CHROs) for their companies at the global level; another third identified as C-suite or board level representatives of their organizations; and the rest identified as strategy officers or human resources line managers, country directors or functional leads. While the majority of the large employers in our sample have worldwide operations and employee bases, including in several or all of the focus countries of our survey, they are typically headquartered in a more limited number of these countries. To ensure geographical balance, our sample pool included at least 50 companies each from our list of target geographies. We only report country-level findings when we have at least 30 unique data points on local employees in 4 | The Future of Jobs Report 13,549,000 that country. Accordingly, the countries and economic areas covered in-depth by the Report are: the Association of Southeast Asian Nations (ASEAN), Australia, Brazil, China, France, Germany, the Gulf Cooperation Council (GCC), India, Italy, Japan, Mexico, South Africa, Turkey, the United Kingdom and the United States (Figure 1C). In addition, our survey sample was constructed on the basis of nine broad industry sectors as defined by the Wold Economic Forum, with a view to balanced industry results in terms of number of companies and employees represented. For each sector, our target list of respondents identified the leading large and emerging employers in that industry (see Appendix A: Report Methodology for details). Our analysis groups job functions into specific occupations and broader job families, based on a streamlined version of the O*NET labour market information system widely used by the US Department of Labor and labour market researchers worldwide.3 In addition, we asked respondents to provide a gender breakdown for the employee functions they listed.
The geographic balance of our sample enables a nuanced view on the outlook for job functions in different countries and industries, covering both . Figure 1C: Sample overview by geographic coverage white-collar and blue-collar workers, and both high-income and low-income countries. In the current era of global value chains, many companies are locating different job functions and categories in different geographic locations to take advantage of the specific strengths of particular local labour markets. In addition to asking respondents to provide details on the geographical spread of their workforce, we asked them to distinguish between mass employment jobs (i.e. job functions that are significant to the company’s operations in terms of the absolute number of employees since they form the bulk of its workforce) and specialist jobs (i.e. job categories, such as design and R&D, that are significant to the company’s operations—not necessarily in terms of the absolute number of employees but because they provide specialist skills crucial to its value proposition).
Following this task approach to the global labour market, we found that— depending on the nature of their business—our respondents often locate these functions in different geographic locations.4 Demographic, socio-economic and—increasingly— technological trends and disruptions to the business and operating models of global companies have the potential to rapidly change the dynamics of the global employment landscape. In addition to the outlook for existing roles, we asked respondents to tell us about wholly new occupations and fields of specialization they expect to emerge in their industries as well as those they foresee to be made obsolete over the coming years until 2020. Structure of the Report This Report consists of two parts. Part I explores the future of jobs and the pace of change to the global employment landscape up until the year 2020, as anticipated by the CHROs of some of the world’s largest employers.
It touches, first, on the expected trends, disruptions and drivers of change transforming business models in every industry, with far-reaching implications for skills, jobs and the nature of work. It then reviews the expected effects on employment levels and skills profiles in different job families, industries and geographies. It discusses consequences of these changes for the adequacy of existing talent and workforce strategies.
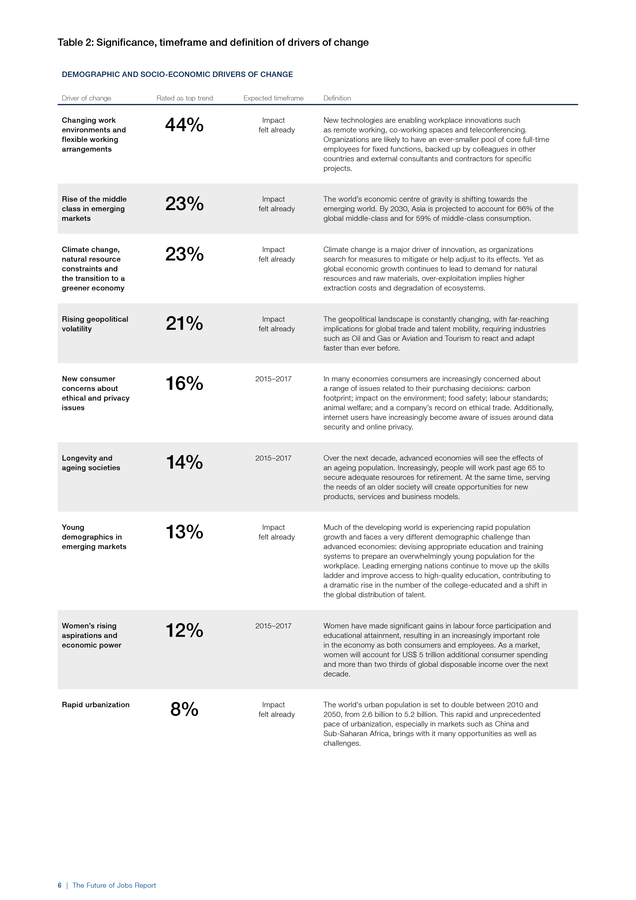
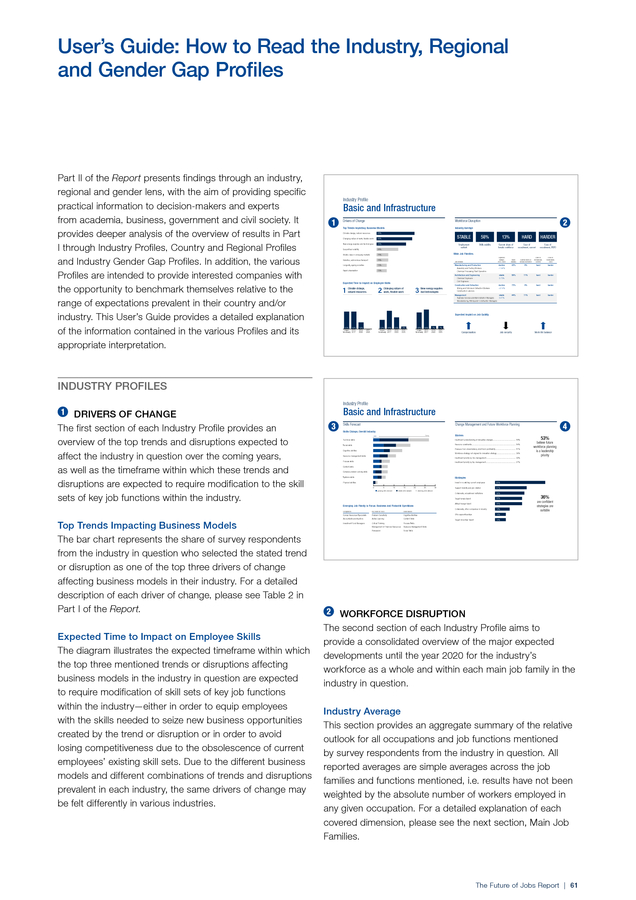
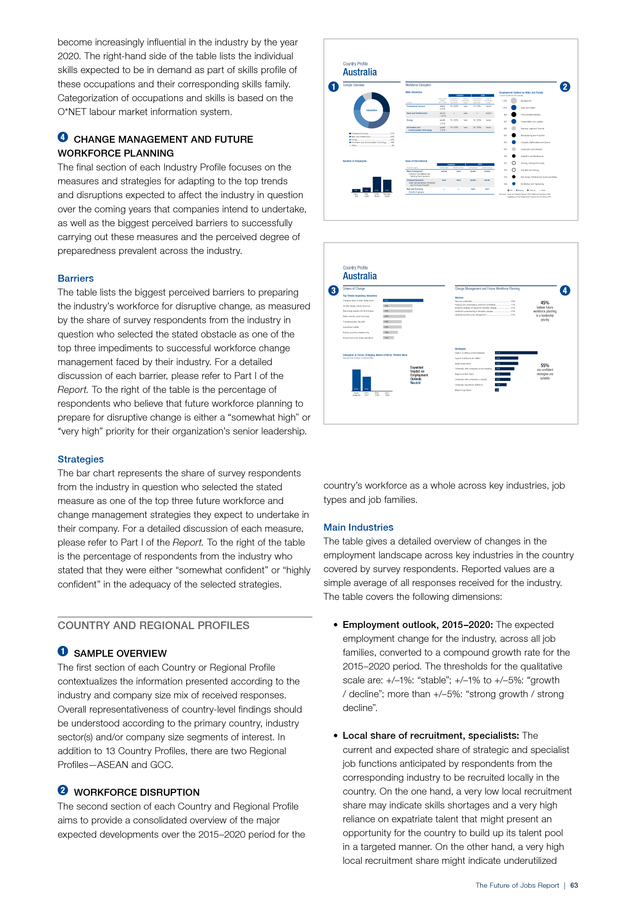
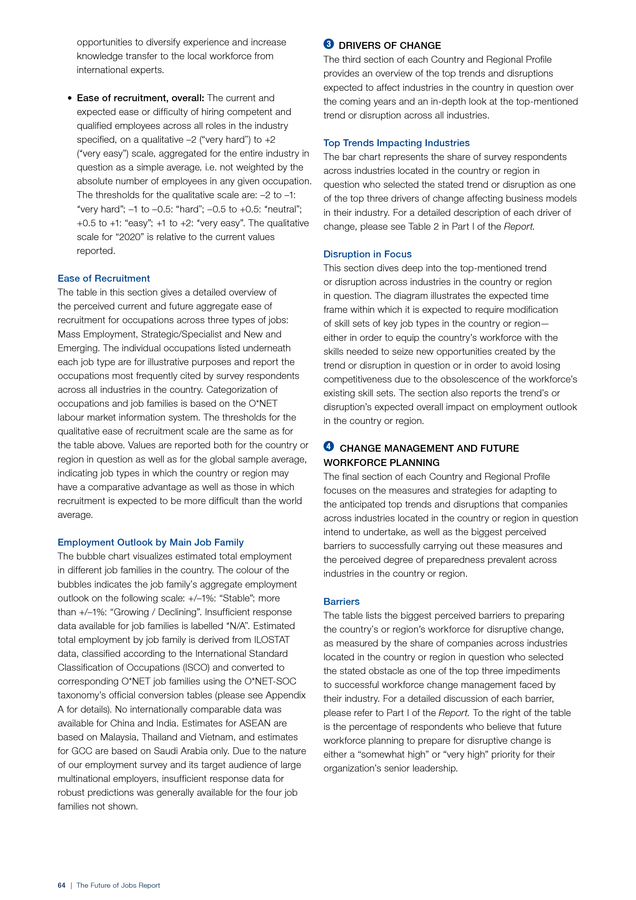
Finally, in a dedicated chapter, it explores the implications of today’s transformations on the future of women’s workforce participation. Part II of the Report presents our findings through an industry, regional and industry gender gap lens—highlighting key industry-by-industry and region-specific trends—and provides a wealth of industry-specific and country-specific practical information to senior decision-makers and experts through dedicated Industry Profiles, Country and Regional Profiles and Industry Gender Gap Profiles. Finally, a detailed Methodological Appendix provides further information on our survey design, sample selection criteria and research methodology. DRIVERS OF CHANGE According to many industry observers, we are today on the cusp of a Fourth Industrial Revolution. Developments in previously disjointed fields such as artificial intelligence and machine learning, robotics, nanotechnology, 3D printing and genetics and biotechnology are all building on and The Future of Jobs Report | 5 . Table 2: Significance, timeframe and definition of drivers of change DEMOGRAPHIC AND SOCIO-ECONOMIC DRIVERS OF CHANGE Driver of change Rated as top trend Expected timeframe Definition Changing work environments and flexible working arrangements 44% Impact felt already New technologies are enabling workplace innovations such as remote working, co-working spaces and teleconferencing. Organizations are likely to have an ever-smaller pool of core full-time employees for fixed functions, backed up by colleagues in other countries and external consultants and contractors for specific projects. Rise of the middle class in emerging markets 23% Impact felt already The world’s economic centre of gravity is shifting towards the emerging world. By 2030, Asia is projected to account for 66% of the global middle-class and for 59% of middle-class consumption. Climate change, natural resource constraints and the transition to a greener economy 23% Impact felt already Climate change is a major driver of innovation, as organizations search for measures to mitigate or help adjust to its effects. Yet as global economic growth continues to lead to demand for natural resources and raw materials, over-exploitation implies higher extraction costs and degradation of ecosystems. Rising geopolitical volatility 21% Impact felt already The geopolitical landscape is constantly changing, with far-reaching implications for global trade and talent mobility, requiring industries such as Oil and Gas or Aviation and Tourism to react and adapt faster than ever before. New consumer concerns about ethical and privacy issues 16% 2015–2017 In many economies consumers are increasingly concerned about a range of issues related to their purchasing decisions: carbon footprint; impact on the environment; food safety; labour standards; animal welfare; and a company’s record on ethical trade. Additionally, internet users have increasingly become aware of issues around data security and online privacy. Longevity and ageing societies 14% 2015–2017 Over the next decade, advanced economies will see the effects of an ageing population.
Increasingly, people will work past age 65 to secure adequate resources for retirement. At the same time, serving the needs of an older society will create opportunities for new products, services and business models. Young demographics in emerging markets 13% Women’s rising aspirations and economic power 12% Rapid urbanization 6 | The Future of Jobs Report 8% Impact felt already 2015–2017 Impact felt already Much of the developing world is experiencing rapid population growth and faces a very different demographic challenge than advanced economies: devising appropriate education and training systems to prepare an overwhelmingly young population for the workplace. Leading emerging nations continue to move up the skills ladder and improve access to high-quality education, contributing to a dramatic rise in the number of the college-educated and a shift in the global distribution of talent. Women have made significant gains in labour force participation and educational attainment, resulting in an increasingly important role in the economy as both consumers and employees.
As a market, women will account for US$ 5 trillion additional consumer spending and more than two thirds of global disposable income over the next decade. The world's urban population is set to double between 2010 and 2050, from 2.6 billion to 5.2 billion. This rapid and unprecedented pace of urbanization, especially in markets such as China and Sub-Saharan Africa, brings with it many opportunities as well as challenges. . Table 2: Significance, timeframe and definition of drivers of change (cont’d.) TECHNOLOGICAL DRIVERS OF CHANGE Driver of change Rated as top trend Expected timeframe Mobile internet and cloud technology 34% 2015–2017 The mobile internet has applications across business and the public sector, enabling more efficient delivery of services and opportunities to increase workforce productivity. With cloud technology, applications can be delivered with minimal or no local software or processing power, enabling the rapid spread of internet-based service models. Advances in computing power and Big Data 26% 2015–2017 Realizing the full potential of technological advances will require having in place the systems and capabilities to make sense of the unprecedented flood of data these innovations will generate. New energy supplies and technologies 22% 2015–2017 New energy supplies and technologies, such as renewables and hydraulic fracturing (fracking), are shaking up the global energy landscape and disrupting powerful players at least as much as yesterday’s oil price crises did, with profound and complicated geopolitical and environmental repercussions. The Internet of Things 14% 2015–2017 The use of remote sensors, communications, and processing power in industrial equipment and everyday objects will unleash an enormous amount of data and the opportunity to see patterns and design systems on a scale never before possible. Crowdsourcing, the sharing economy and peer-to-peer platforms 12% Advanced robotics and autonomous transport 9% 2018–2020 Advanced robots with enhanced senses, dexterity, and intelligence can be more practical than human labour in manufacturing, as well as in a growing number of service jobs, such as cleaning and maintenance. Moreover, it is now possible to create cars, trucks, aircraft, and boats that are completely or partly autonomous, which could revolutionize transportation, if regulations allow, as early as 2020. Artificial intelligence and machine learning 7% 2018–2020 Advances in artificial intelligence, machine learning, and natural user interfaces (e.g. voice recognition) are making it possible to automate knowledge-worker tasks that have long been regarded as impossible or impractical for machines to perform. Advanced manufacturing and 3D printing 6% 2015–2017 A range of technological advances in manufacturing technology promises a new wave of productivity.
For example, 3D printing (building objects layer-by-layer from a digital master design file) allows on-demand production, which has far-ranging implications for global supply chains and production networks. Advanced materials, biotechnology and genomics 6% 2018–2020 Technological advances in material and life sciences have many innovative industry applications. Recent breakthroughs in genetics could have profound impacts on medicine and agriculture. Similarly, the manufacture of synthetic molecules via bio-process engineering will be critical to pharmaceuticals, plastics and polymers, biofuels, and other new materials and industrial processes. Impact felt already Definition With peer-to-peer platforms, companies and individuals can do things that previously required large-scale organizations.
In some cases the talent and resources that companies can connect to, through activities such as crowdsourcing, may become more important than the in-house resources they own. The Future of Jobs Report | 7 . Figure 2: Drivers of change, industries overall Share of respondents rating driver as top trend, % DEMOGRAPHIC AND SOCIO-ECONOMIC Changing nature of work, flexible work 44% Middle class in emerging markets 23% Climate change, natural resources 23% Geopolitical volatility 21% Consumer ethics, privacy issues 16% Longevity, ageing societies 14% Young demographics in emerging markets 13% Women’s economic power, aspirations 12% Rapid urbanization 8% TECHNOLOGICAL Mobile internet, cloud technology 34% Processing power, Big Data 26% New energy supplies and technologies 22% Internet of Things 14% Sharing economy, crowdsourcing 12% Robotics, autonomous transport 9% Artificial intelligence 7% Adv. manufacturing, 3D printing 6% Adv. materials, biotechnology 6% 0.0 Source: Future of Jobs Survey, World Economic Forum. 0.0 Note: Names of drivers have been abbreviated to ensure legibility. 0.1 0.2 0.3 0.4 0.5 0.1 0.2 0.3 0.4 0.5 amplifying one another. Smart systems—homes, factories, farms, grids or entire cities—will help tackle problems ranging from supply chain management to climate change. Concurrent to this technological revolution are a set of broader socio-economic, geopolitical and demographic developments, each interacting in multiple directions and intensifying each another. While these impending changes hold great promise for future prosperity and job creation, many of them also pose major challenges requiring proactive adaptation by corporations, governments, societies and individuals.
As whole industries adjust and new ones are born, many occupations will undergo a fundamental transformation. Together, technological, socio-economic, geopolitical and demographic developments and the interactions between them will generate new categories of jobs and occupations while partly or wholly displacing others. They will change the skill sets required in both old and new occupations in most industries and transform how and where people work, leading to new management and regulatory challenges. 8 | The Future of Jobs Report Given the rapid pace of change, business model disruptions are resulting in a near-simultaneous impact on employment and need for new skill sets, requiring an urgent and concerted effort for adjustment. So far, the debate on these transformations has been sharply polarized between those who foresee limitless new opportunities and those that foresee a massive dislocation of jobs. In fact, the reality is likely to be highly specific to the industry, region and occupation in question and the ability of various stakeholders to successfully manage change.
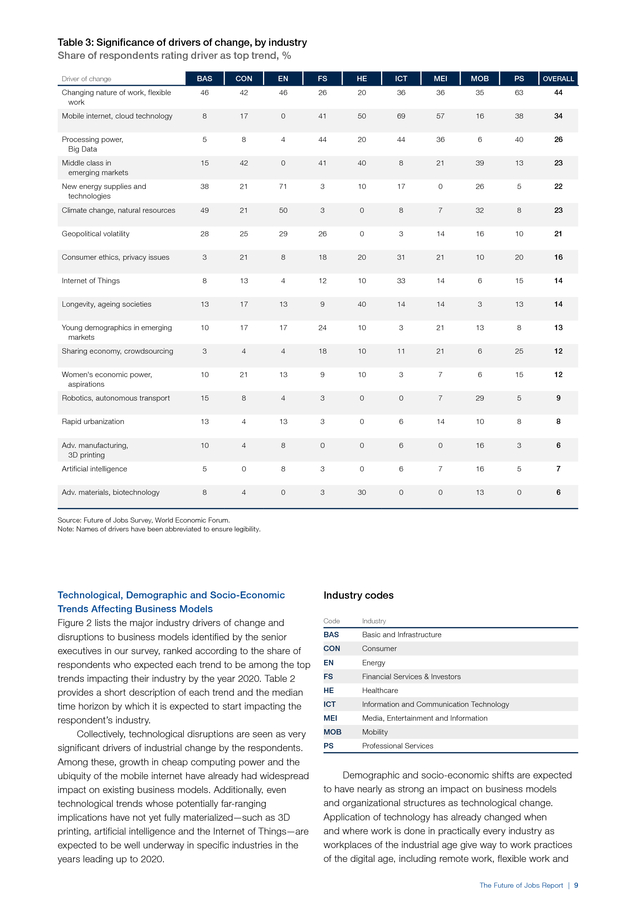
A major goal of this Report is to unpack the relative impact of key drivers of change and provide specific information on the relative magnitude of these expected changes by industry and geography, and the expected time horizon for their impact to be felt on job functions, employment levels and skills. . Table 3: Significance of drivers of change, by industry Share of respondents rating driver as top trend, % BAS CON EN FS HE ICT MEI MOB PS OVERALL Changing nature of work, flexible work 46 42 46 26 20 36 36 35 63 44 Mobile internet, cloud technology 8 17 0 41 50 69 57 16 38 34 Processing power, Big Data 5 8 4 44 20 44 36 6 40 26 Middle class in emerging markets 15 42 0 41 40 8 21 39 13 23 New energy supplies and technologies 38 21 71 3 10 17 0 26 5 22 Climate change, natural resources 49 21 50 3 0 8 7 32 8 23 Geopolitical volatility 28 25 29 26 0 3 14 16 10 21 Consumer ethics, privacy issues 3 21 8 18 20 31 21 10 20 16 Internet of Things 8 13 4 12 10 33 14 6 15 14 Longevity, ageing societies 13 17 13 9 40 14 14 3 13 14 Young demographics in emerging markets 10 17 17 24 10 3 21 13 8 13 Sharing economy, crowdsourcing 3 4 4 18 10 11 21 6 25 12 Women's economic power, aspirations 10 21 13 9 10 3 7 6 15 12 Robotics, autonomous transport 15 8 4 3 0 0 7 29 5 9 Rapid urbanization 13 4 13 3 0 6 14 10 8 8 Adv. manufacturing, 3D printing 10 4 8 0 0 6 0 16 3 6 Artificial intelligence 5 0 8 3 0 6 7 16 5 7 Adv. materials, biotechnology 8 4 0 3 30 0 0 13 0 6 Driver of change Source: Future of Jobs Survey, World Economic Forum. Note: Names of drivers have been abbreviated to ensure legibility. Technological, Demographic and Socio-Economic Trends Affecting Business Models Figure 2 lists the major industry drivers of change and disruptions to business models identified by the senior executives in our survey, ranked according to the share of respondents who expected each trend to be among the top trends impacting their industry by the year 2020. Table 2 provides a short description of each trend and the median time horizon by which it is expected to start impacting the respondent’s industry. Collectively, technological disruptions are seen as very significant drivers of industrial change by the respondents. Among these, growth in cheap computing power and the ubiquity of the mobile internet have already had widespread impact on existing business models.
Additionally, even technological trends whose potentially far-ranging implications have not yet fully materialized—such as 3D printing, artificial intelligence and the Internet of Things—are expected to be well underway in specific industries in the years leading up to 2020. Industry codes Code Industry BAS Basic and Infrastructure CON Consumer EN Energy FS Financial Services & Investors HE Healthcare ICT Information and Communication Technology MEI Media, Entertainment and Information MOB Mobility PS Professional Services Demographic and socio-economic shifts are expected to have nearly as strong an impact on business models and organizational structures as technological change. Application of technology has already changed when and where work is done in practically every industry as workplaces of the industrial age give way to work practices of the digital age, including remote work, flexible work and The Future of Jobs Report | 9 . Figure 3: Timeframe to impact industries, business models Impact felt already 2015–2017 2018–2020 »» Rising geopolitical volatility »» Mobile internet and cloud technology »» Advances in computing power and Big Data »» Crowdsourcing, the sharing economy and peer-to-peer platforms »» Rise of the middle class in emerging markets »» Young demographics in emerging markets »» Rapid urbanization »» Changing work environments and flexible working arrangements »» Climate change, natural resource constraints and the transition to a greener economy »» New energy supplies and technologies »» The Internet of Things »» Advanced manufacturing and 3D printing »» Longevity and ageing societies »» New consumer concerns about ethical and privacy issues »» Women’s rising aspirations and economic power »» Advanced robotics and autonomous transport »» Artificial intelligence and machine learning »» Advanced materials, biotechnology and genomics on-demand work. The rising middle class in emerging markets, the need to transition towards an environmentally sustainable economy and increased geopolitical volatility are all seen as major organizational drivers of change. Changing values and the growing ability of consumers to express these values are also transforming business models and employment. The rising role and importance of women in the economy is transforming not only the composition of the talent pool but also the nature of products catering to them specifically—and by extension the skills profiles of the jobs required.
Longevity and population ageing in advanced economies—and the opportunities and challenges it presents—are also expected to have an impact on business models, and by extension talent needs, in addition to changing the composition of the talent pool in most developed economies in particular. Industry- and Country-Level Change A number of drivers of change will have an acute impact within specific industries. At the industry level, for example, new energy supplies and technologies will have a particular impact on the Energy, Basic and Infrastructure and Mobility industries. Processing power and Big Data will have an especially strong impact on Information and Communication Technology, Financial Services and Professional Services. The rising middle class in emerging markets will have the largest effect on Consumer, Financial Services and Mobility. Consumer ethics and privacy issues will have a significant impact on the Consumer, Financial Services and Information and Communication Technology sector (see Table 3). At the country level, expectations regarding the nature of upcoming disruptions are shaped by the demographic, economic and technological development of the country in question.
Overall, changing and flexible work is seen as the most significant driver of change in advanced economies, whereas the rising middle class takes this role in emerging markets. New energy supplies and technologies are expected to play the largest role in the countries of the Gulf Cooperation Council, while climate change adaptation is seen as a particularly major driver in Germany. A number 10 | The Future of Jobs Report of developing countries expect particularly large impact from the mobile internet given that the technology has the potential to bring millions of formerly unconnected workers and consumers into the formal economy for the first time. For further details, please also refer to the Country Profiles in Part 2 of this Report. Expected Timeframe The time-to-impact trajectory of certain drivers of change differs between industries and is shaped by the specific nature of each sector’s current business model.
For example, there is a wide variety of opinion among Chief Human Resources Officers regarding the immediacy of the impact of artificial intelligence and robotics on employment and skills.5 However, regardless of the specific industry or driver of change, it is clear that the overall pace of industry transformation is wholly unprecedented. Disruptive changes to industry sectors are already re-configuring business models and skill sets—and will do so at an accelerated pace in the next five years. The current anxious debate about the long-term impact of artificial intelligence and robotics notwithstanding, our focus is on today’s workforce and talent strategies and how they can contribute to successfully managing this transition. EMPLOYMENT TRENDS Recent discussions about the employment impact of disruptive change have often been polarized between those who foresee limitless opportunities in newly emerging job categories and prospects that improve workers’ productivity and liberate them from routine work, and those that foresee massive labour substitution and displacement of jobs. Academics, chief executives and labour leaders hold strong and diverse views on the debate, as do policymakers.6 It is clear from our data that while forecasts vary by industry and region, momentous change is underway and that, ultimately, it is our actions today that will determine whether that change mainly results in massive displacement of workers or the emergence of new opportunities.
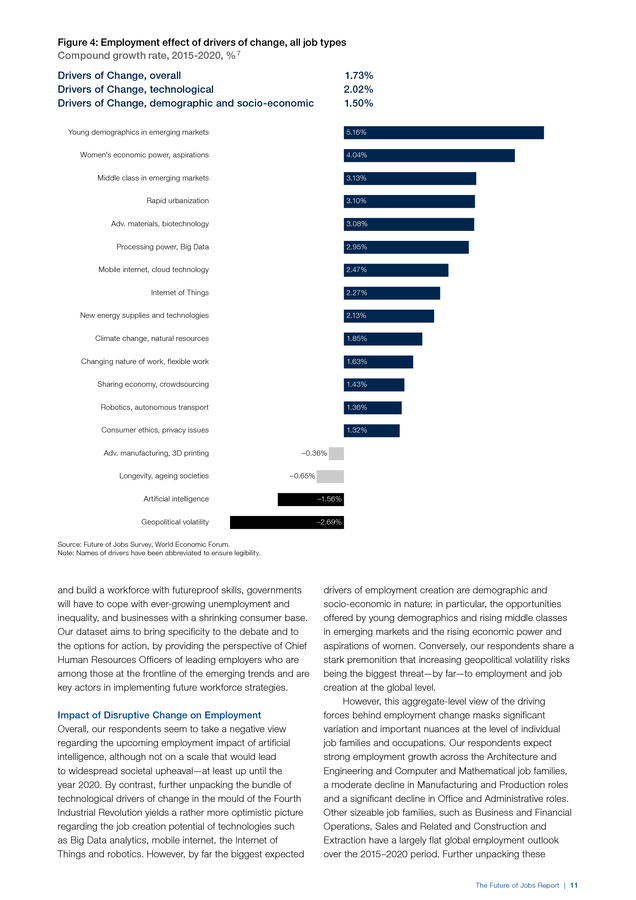
Without urgent and targeted action today to manage the near-term transition . Figure 4: Employment effect of drivers of change, all job types Compound growth rate, 2015-2020, % 7 Drivers of Change, overall Drivers of Change, technological Drivers of Change, demographic and socio-economic 1.73% 2.02% 1.50% Young demographics in emerging markets 5.16% Women’s economic power, aspirations 4.04% Middle class in emerging markets 3.13% Rapid urbanization 3.10% Adv. materials, biotechnology 3.08% Processing power, Big Data 2.95% Mobile internet, cloud technology 2.47% Internet of Things 2.27% New energy supplies and technologies 2.13% Climate change, natural resources 1.85% Changing nature of work, flexible work 1.63% Sharing economy, crowdsourcing 1.43% Robotics, autonomous transport 1.36% Consumer ethics, privacy issues 1.32% Adv. manufacturing, 3D printing Longevity, ageing societies –0.36% –0.65% Artificial intelligence –1.56% Geopolitical volatility –2.69% Source: Future of Jobs Survey, World Economic Forum. –0.02 Note: Names of drivers have been abbreviated to–0.03 legibility. ensure –0.01 and build a workforce with futureproof skills, governments will have to cope with ever-growing unemployment and inequality, and businesses with a shrinking consumer base. Our dataset aims to bring specificity to the debate and to the options for action, by providing the perspective of Chief Human Resources Officers of leading employers who are among those at the frontline of the emerging trends and are key actors in implementing future workforce strategies. Impact of Disruptive Change on Employment Overall, our respondents seem to take a negative view regarding the upcoming employment impact of artificial intelligence, although not on a scale that would lead to widespread societal upheaval—at least up until the year 2020. By contrast, further unpacking the bundle of technological drivers of change in the mould of the Fourth Industrial Revolution yields a rather more optimistic picture regarding the job creation potential of technologies such as Big Data analytics, mobile internet, the Internet of Things and robotics.
However, by far the biggest expected 0.00 0.01 0.02 0.03 0.04 0.05 drivers of employment creation are demographic and socio-economic in nature; in particular, the opportunities offered by young demographics and rising middle classes in emerging markets and the rising economic power and aspirations of women. Conversely, our respondents share a stark premonition that increasing geopolitical volatility risks being the biggest threat—by far—to employment and job creation at the global level. However, this aggregate-level view of the driving forces behind employment change masks significant variation and important nuances at the level of individual job families and occupations. Our respondents expect strong employment growth across the Architecture and Engineering and Computer and Mathematical job families, a moderate decline in Manufacturing and Production roles and a significant decline in Office and Administrative roles. Other sizeable job families, such as Business and Financial Operations, Sales and Related and Construction and Extraction have a largely flat global employment outlook over the 2015–2020 period.
Further unpacking these The Future of Jobs Report | 11 0.06 . Table 4: Employment effect of drivers of change, by job family Compound growth rate, 2015-2020, % Job family/Driver of change Computer and Mathematical Employment outlook 3.21% Job family/Driver of change Sales and Related Employment outlook 0.46% Rapid urbanization 6.11% Processing power, Big Data 1.25% Middle class in emerging markets 5.00% Sharing economy, crowdsourcing 0.58% Changing nature of work, flexible work 4.94% Mobile internet, cloud technology 0.43% Sharing economy, crowdsourcing 4.88% Internet of Things –0.89% Processing power, Big Data 4.59% Middle class in emerging markets –1.14% Internet of Things 4.54% Consumer ethics, privacy issues –1.28% Geopolitical volatility 3.89% Geopolitical volatility –1.50% Mobile internet, cloud technology 3.71% Changing nature of work, flexible work –1.51% Consumer ethics, privacy issues 2.40% New energy supplies and technologies –1.58% Architecture and Engineering 2.71% Installation and Maintenance –0.15% Middle class in emerging markets 5.88% Climate change, natural resources Robotics, autonomous transport 4.49% Changing nature of work, flexible work 0.45% Climate change, natural resources 3.68% Mobile internet, cloud technology –3.89% Internet of Things 3.54% Adv. manufacturing, 3D printing 3.33% Internet of Things Construction and Extraction 3.00% –8.00% –0.93% Changing nature of work, flexible work 3.18% New energy supplies and technologies 1.38% New energy supplies and technologies 2.25% Climate change, natural resources 0.38% 1.33% Geopolitical volatility –0.07% 0.97% Changing nature of work, flexible work –0.11% Geopolitical volatility Management Young demographics in emerging markets 2.14% Geopolitical volatility 1.67% Mobile internet, cloud technology 0.95% New energy supplies and technologies 1.44% Middle class in emerging markets –0.83% Processing power, Big Data 1.39% Geopolitical volatility –1.00% Changing nature of work, flexible work 0.90% Middle class in emerging markets 0.72% Mobile internet, cloud technology 0.62% Climate change, natural resources 0.40% Longevity, ageing societies 0.23% Arts, Design, Entertainment, Sports and Media Manufacturing and Production Adv. materials, biotechnology –1.03% –1.63% 0.67% Robotics, autonomous transport –0.83% New energy supplies and technologies –1.81% Middle class in emerging markets –2.16% 0.70% Climate change, natural resources –2.45% Sharing economy, crowdsourcing 3.11% Geopolitical volatility –2.47% Middle class in emerging markets 1.96% Changing nature of work, flexible work –2.99% Changing nature of work, flexible work 1.88% Longevity, ageing societies –3.13% Young demographics in emerging markets 1.67% Adv. manufacturing, 3D printing –3.60% Business and Financial Operations Geopolitical volatility 1.59% Climate change, natural resources 1.39% Processing power, Big Data 1.34% Mobile internet, cloud technology 1.03% Consumer ethics, privacy issues 0.54% Office and Administrative –4.91% Changing nature of work, flexible work –2.77% New energy supplies and technologies –3.33% Mobile internet, cloud technology –5.82% Processing power, Big Data –6.06% Consumer ethics, privacy issues –6.18% Internet of Things –6.20% Rapid urbanization –6.36% Climate change, natural resources –6.67% Geopolitical volatility –9.72% Source: Future of Jobs Survey, World Economic Forum. Note: Names of drivers have been abbreviated to ensure legibility. expectations according to the factors driving employment change makes clear the true scale of impending industry and occupational transformation.
See Table 4 for details on these expectations. The expected global decline in total Manufacturing and Production roles is driven by labour-substituting technologies such as additive manufacturing and 3D printing as much as by more resource-efficient sustainable 12 | The Future of Jobs Report product use, lower demand growth in ageing societies and threats to global supply chains due to geopolitical volatility. Some cautious optimism is warranted due to increased manufacturing demand for advanced materials and comparatively favourable expectations around robotics, pointing to the latter’s potential for labour-complementing productivity enhancement rather than pure job replacement. . Conversely, 3D printing, resource-efficient sustainable production and robotics are all seen as strong drivers of employment growth in the Architecture and Engineering job family, in light of a continued and fast-growing need for skilled technicians and specialists to create and manage advanced and automated production systems. This is expected to lead to a transformation of manufacturing into a highly sophisticated sector where high-skilled engineers are in strong demand to make the industrial Internet of Things a reality. The fortunes of other job families due to these same factors are mixed. Installation and Maintenance jobs, for example, will see great productivity enhancements and strong growth in green jobs such as the installation, retrofitting, repair and maintenance of smart meters and renewable energy technologies in residential and office buildings, but—at an aggregate level—will also come faceto-face with the efficiency-saving and labour-substituting aspect of the Internet of Things. Similarly, despite some challenges, global demographics will sustain demand for Construction and Extraction jobs.
Resource-efficiency is expected to be another key driving factor for this job family, at least in the case of construction, in the creation of new and improvement of existing housing stock, often using new construction techniques, materials and approaches. Automation of checkout processes and smart inventory management through sensors and other applications of the Internet of Things are some of the factors expected to lead to a decrease in demand for traditional roles in the Sales and Related job family. Consumer ethics and green consumption practices are likewise anticipated to impact negatively on traditional roles in the job family, though perhaps with an upside for employees with skills in accrediting and advising on eco-labelled products. The strongest employment growth in the sector is expected to come from a continued shift towards online shopping and the application of Big Data analytics to derive and act upon insights from customer data and preferences to provide a personalised shopping experience. Two further job families with mainly flat aggregate employment outlooks over the coming years are Business and Financial Operations and Management.
Each is affected by a very wide range of factors, hinting at the scale of transformation and upskilling needs these job families will undergo over the coming years. Strong employment growth in the Computer and Mathematical job family is driven by trends beyond technology, such as rapid urbanization in developing countries, as well as by disruptions that negatively affect the employment outlook in other job families, such as geopolitical volatility and privacy issues—as companies from virtually all industries seek to recruit specialists that can help them apply tools such as Big Data analytics and data visualization to better understand and cope with these issues. The biggest employment decline of any job family is expected in Office and Administrative roles, which are expected to be negatively affected by a perfect storm of technological trends that have the potential to make many of them redundant, such as mobile internet and cloud technology, Big Data analytics and the Internet of Things, but also factors such as climate change and resource efficiency and workplace flexibility that undermine the rationale for maintaining a large workforce within these roles. Interestingly, our respondents expect a comparatively small employment impact from two disruptions that currently receive significant attention. Where it is mentioned, the artificial intelligence and machine learning driver is expected to lead to negative employment outcomes in job families such as Education and Training, Legal and Business and Financial Operations. However, it appears our respondents do not believe that these technologies will have advanced significantly enough by the year 2020 to have a more widespread impact on global employment levels.
Similarly, the sharing economy may have the potential to radically transform the way work is organized and regulated in certain job families, with all the opportunities and challenges this entails; but where it is mentioned as a driver of change to employment, its effect is largely seen as benign in the next five years. Our analysis reveals that upcoming disruptions to the employment landscape are going to be a lot more complex and multi-faceted than conveyed by a narrow focus only on automation, and that we must act within the current window offered by the varying speeds of technological transformations to prepare. Global Net Employment Effects The survey results provide direct information on the expected relative employment changes to job families over the period 2015–2020. It is possible to extrapolate from these values the estimated numbers of jobs created or lost in absolute terms worldwide.
Between them, the 15 economies covered by our data account for about 1.86 billion workers, approximately 65% of the world’s total workforce. Using the standardized occupational classification behind our research framework, we have estimated the total number of people employed in any given job family in each of our focus countries (although for China, which accounts for 770 million workers out of our total, this data is unfortunately not available in a directly comparable format8).Therefore, we can give an estimate of the net effect on global employment of the trends and disruptions anticipated by the respondents covered by our Report. According to these calculations, current trends could lead to a net employment impact of more than 5.1 million jobs lost to disruptive labour market changes over the period 2015–2020, with a total loss of 7.1 million jobs— two thirds of which are concentrated in the Office and Administrative job family—and a total gain of 2 million jobs, in several smaller job families. A number of conclusions stand out: • The global workforce is expected by our respondents to experience significant churn between job families and functions, with administrative and routine white‑collar office functions at risk of being decimated and strong growth in Computer and Mathematical The Future of Jobs Report | 13 .
Figure 5: Total workforce by job family Employees (thousands, all focus countries) 264,365 Farming, Fishing and Forestry 98,723 Manufacturing and Production 96,928 Office and Administrative 89,613 Hospitality and Food Related 79,619 and Architecture and Engineering related fields. Manufacturing and Production roles are also expected to see a further bottoming out but might have the worst behind them and still retain relatively good potential for upskilling, redeployment and productivity enhancement through technology rather than pure substitution. Transportation and Logistics 70,282 Business and Financial Operations 65,787 Sales and Related 55,266 Personal Care and Service 53,404 Construction and Extraction 42,838 Management 38,727 Community, Social and Protective Services 26,887 Installation and Maintenance 18,799 Healthcare Practitioners and Technicians 15,663 Life, Physical, and Social sciences 14,659 Education and Training 14,628 Arts, Design, Entertainment, Sports and Media 12,605 Computer and Mathematical 12,511 Architecture and Engineering 6,550 Legal 14 | The Future of Jobs Report • Employment growth is expected to derive disproportionately from smaller, generally high-skilled job families that will be unable to absorb job losses coming from other parts of the labour market. Even if they could, significant reskilling would be needed. This factor plus the increase in global unemployment due to global population growth and slow job creation over the period 2015-20199 leaves no room for complacency. • Once emerging markets and developing countries are added into the equation, any discussion of the Future of Jobs remains incomplete without recognizing that a significant share of the global workforce remains employed in agriculture, about which both current technology optimists and alarmists have comparatively little to say. Similarly, a potential field of employment growth around which our survey yielded only limited data points concerns the Personal Care and Service job family, since jobs in this field are not typically found on a large scale among large multinational employers.10 Indeed, there is cause for optimism about growth in these roles as demand for such services grows due to demographic and social factors. • There is a strong gender dimension to expected employment changes whereby, notably, gender gaps appear to be more pronounced within both high growth and declining job families. For example, women make up low numbers in the fast-growing STEM job families, pointing, on current trends, to a deteriorating gender gap over time; but also low numbers within job families such as Manufacturing and Production or Construction and Extraction, where expected job losses will disproportionately affect men.
However, female employment is also concentrated in low-growth or declining job families such as Sales, Business and Financial Operations and Office and Administrative, indicating, if our respondents’ expectations come to pass, a possible reversal of some of the gains made in workplace gender parity over the past decade. Employment Trends by Industry From an industry-level perspective, there is a modestly positive outlook for employment across most sectors over the 2015–2020 period. However, underneath this aggregate outlook there is once again significant relative growth in some job families and significant relative decline in others, resulting from the accelerating pace of transformation within many industries. For further details, please also refer to the Industry Profiles in Part 2 of the Report. .
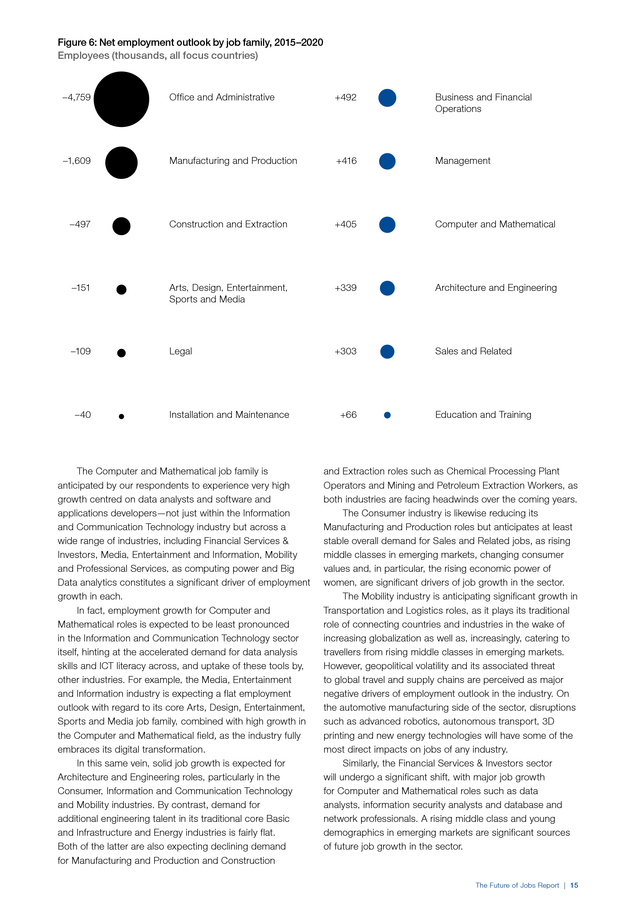
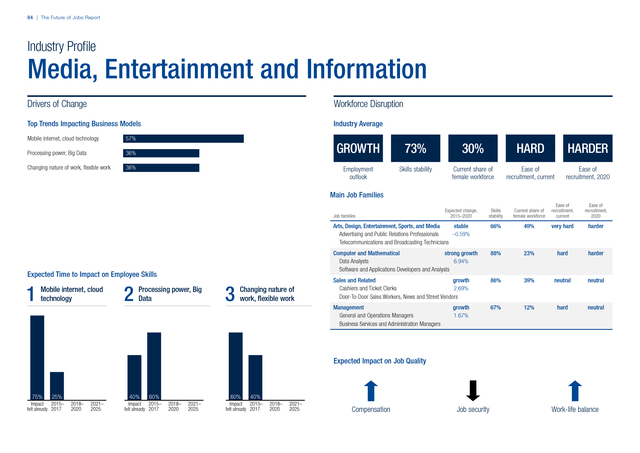
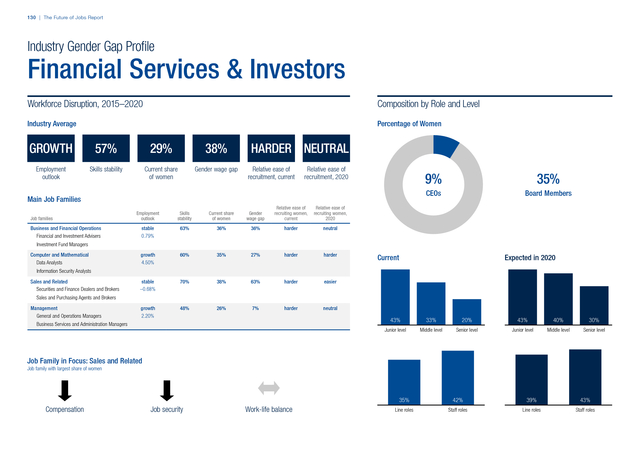
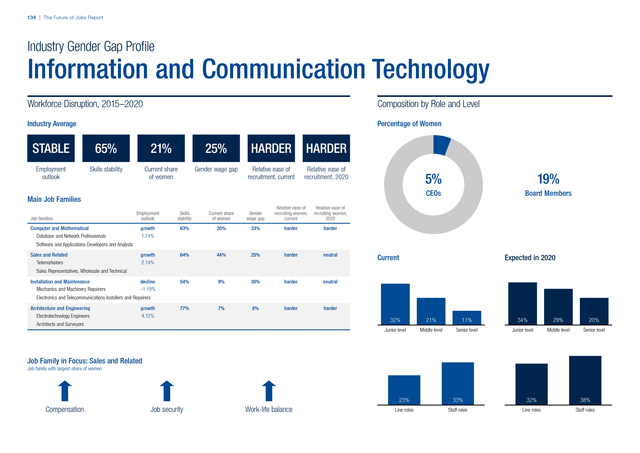
Figure 6: Net employment outlook by job family, 2015–2020 Employees (thousands, all focus countries) –4,759 Office and Administrative +492 Business and Financial Operations –1,609 Manufacturing and Production +416 Management –497 Construction and Extraction +405 Computer and Mathematical –151 Arts, Design, Entertainment, Sports and Media +339 Architecture and Engineering –109 Legal +303 Sales and Related –40 Installation and Maintenance The Computer and Mathematical job family is anticipated by our respondents to experience very high growth centred on data analysts and software and applications developers—not just within the Information and Communication Technology industry but across a wide range of industries, including Financial Services & Investors, Media, Entertainment and Information, Mobility and Professional Services, as computing power and Big Data analytics constitutes a significant driver of employment growth in each. In fact, employment growth for Computer and Mathematical roles is expected to be least pronounced in the Information and Communication Technology sector itself, hinting at the accelerated demand for data analysis skills and ICT literacy across, and uptake of these tools by, other industries. For example, the Media, Entertainment and Information industry is expecting a flat employment outlook with regard to its core Arts, Design, Entertainment, Sports and Media job family, combined with high growth in the Computer and Mathematical field, as the industry fully embraces its digital transformation. In this same vein, solid job growth is expected for Architecture and Engineering roles, particularly in the Consumer, Information and Communication Technology and Mobility industries. By contrast, demand for additional engineering talent in its traditional core Basic and Infrastructure and Energy industries is fairly flat. Both of the latter are also expecting declining demand for Manufacturing and Production and Construction +66 Education and Training and Extraction roles such as Chemical Processing Plant Operators and Mining and Petroleum Extraction Workers, as both industries are facing headwinds over the coming years. The Consumer industry is likewise reducing its Manufacturing and Production roles but anticipates at least stable overall demand for Sales and Related jobs, as rising middle classes in emerging markets, changing consumer values and, in particular, the rising economic power of women, are significant drivers of job growth in the sector. The Mobility industry is anticipating significant growth in Transportation and Logistics roles, as it plays its traditional role of connecting countries and industries in the wake of increasing globalization as well as, increasingly, catering to travellers from rising middle classes in emerging markets. However, geopolitical volatility and its associated threat to global travel and supply chains are perceived as major negative drivers of employment outlook in the industry. On the automotive manufacturing side of the sector, disruptions such as advanced robotics, autonomous transport, 3D printing and new energy technologies will have some of the most direct impacts on jobs of any industry. Similarly, the Financial Services & Investors sector will undergo a significant shift, with major job growth for Computer and Mathematical roles such as data analysts, information security analysts and database and network professionals.
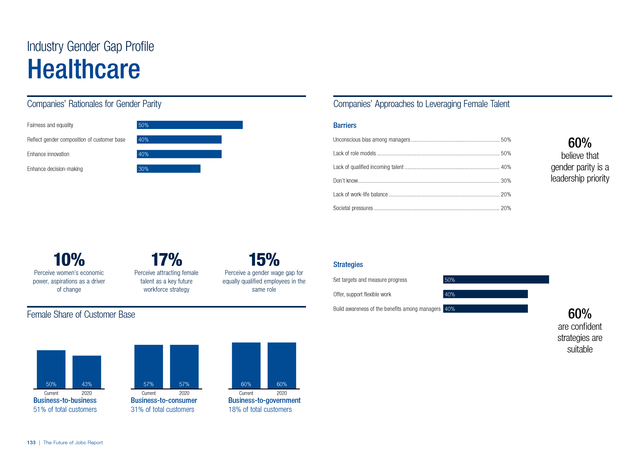
A rising middle class and young demographics in emerging markets are significant sources of future job growth in the sector. The Future of Jobs Report | 15 . Table 5: Employment effect of drivers of change, by industry Compound growth rate, 2015-2020, % Industry/Driver of change Basic and Infrastructure Employment outlook 0.61% Industry/Driver of change Information and Communication Technology Employment outlook 2.91% Rapid urbanization 7.00% Processing power, Big Data Middle class in emerging markets 3.33% Mobile internet, cloud technology 4.78% New energy supplies and technologies 2.00% Consumer ethics, privacy issues 3.33% Climate change, natural resources 1.39% New energy supplies and technologies 2.50% Changing nature of work, flexible work 0.29% Internet of Things 2.27% Robotics, autonomous transport 0.00% Changing nature of work, flexible work 2.08% Longevity, ageing societies –7.00% Longevity, ageing societies –1.25% Geopolitical volatility –7.27% Media, Entertainment and Information 5.00% 2.31% 1.72% Processing power, Big Data Women's economic power, aspirations 3.75% Mobile internet, cloud technology 3.57% Consumer ethics, privacy issues 2.00% Changing nature of work, flexible work –2.00% Changing nature of work, flexible work 1.50% Middle class in emerging markets 1.25% Climate change, natural resources 2.50% Climate change, natural resources 1.25% New energy supplies and technologies 2.50% New energy supplies and technologies 1.00% Middle class in emerging markets 2.27% Geopolitical volatility 0.00% Robotics, autonomous transport 1.25% 1.54% Artificial intelligence 1.25% New energy supplies and technologies 2.19% Mobile internet, cloud technology 1.00% Changing nature of work, flexible work 1.00% Adv. manufacturing, 3D printing 1.00% Climate change, natural resources 0.83% Changing nature of work, flexible work 0.56% Geopolitical volatility –5.00% Geopolitical volatility –6.00% 1.54% Professional Services 2.45% Consumer Energy Financial Services & Investors Mobility 8.00% 1.61% Young demographics in emerging markets 6.25% Women's economic power, aspirations 5.00% Middle class in emerging markets 5.00% Middle class in emerging markets 5.00% Processing power, Big Data 1.54% Changing nature of work, flexible work 4.00% Mobile internet, cloud technology 1.15% Processing power, Big Data 2.35% Sharing economy, crowdsourcing 0.83% Mobile internet, cloud technology 2.14% Consumer ethics, privacy issues 0.83% Sharing economy, crowdsourcing 1.67% Changing nature of work, flexible work 0.63% Internet of Things 1.00% –2.22% Consumer ethics, privacy issues 0.71% –0.37% Longevity, ageing societies 0.00% Geopolitical volatility Healthcare Mobile internet, cloud technology –3.00% –3.00% Source: Future of Jobs Survey, World Economic Forum. Note: Names of drivers have been abbreviated to ensure legibility. Many industry observers expect a substantial increase in the number of jobs in the Healthcare sector due to demographic trends such a longevity and ageing populations in advanced economies. However, our survey respondents expect a stable employment outlook for the industry over the coming five years—and a net negative impact on the number of jobs from disruptions such as mobile internet and cloud technology, enabling widespread application of telemedicine. What seems certain is that the skills profile of many jobs in the sector will change significantly. Our respondents anticipate that the Professional Services industry will experience employment growth over the 2015–2020 period, particularly in data analytics roles, especially as the consulting arm of the sector experiences growth by advising all others on their respective transformations.
Accordingly, factors affecting jobs in the industry are influenced by those affecting all the others. With regards to business models in the Professional 16 | The Future of Jobs Report Services industry itself, some of the major influences will be automation or globalized crowdsourcing via online platforms of high-skilled but repetitive work processes, leading to increased off-shoring of back office roles and a rise in timelimited, project-based contracts. New and Emerging Roles Our research also explicitly asked respondents about new and emerging job categories and functions that they expect to become critically important to their industry by the year 2020, and where within their global operations they would expect to locate such roles. Two job types stand out due to the frequency and consistency with which they were mentioned across practically all industries and geographies. The first are data analysts, as already frequently mentioned above, which companies expect will help them make sense and derive insights from the torrent of data generated by the technological disruptions referenced above. The second .
are specialized sales representatives, as practically every industry will need to become skilled in commercializing and explaining their offerings to business or government clients and consumers, whether due to the innovative technical nature of the products themselves, due to their being targeted at new client types with which the company is not yet familiar, or both. Other new specialties frequently mentioned include new types of human resources and organizational development specialists, engineering specialties such as materials, bio-chemicals, nanotech and robotics, regulatory and government relations specialists, geospatial information systems experts and commercial and industrial designers. A particular need is also seen in industries as varied as Energy and Media, Entertainment and Information for a new type of senior manager who will successfully steer companies through the upcoming change and disruption. Once more, there is a gender gap dimension to these findings, as the growth of new and emerging roles in computer, technology and engineering-related fields is outpacing the rate at which women are currently entering those types of jobs—putting them at risk of missing out on tomorrow’s best job opportunities and aggravating hiring processes for companies due to a more restricted talent pool. We also asked respondents to identify roles where there may be consistent decline. Across a wide range of sectors including Basic and Infrastructure, Energy, Financial Services & Investors, Information and Communication Technology as well as Professional Services, Office and Administrative functions are poised for major redundancies. One particular set of jobs affected by this, for example, are customer service roles, which will become obsolete due to mobile internet technology to monitor service quality online as a means of maintaining effective customer relationship management. Changes in Job Quality and Ease of Recruitment In addition to the quantity of jobs, disruptive changes to industries and business models will also affect the quality, skills requirements and day-to-day content of virtually every job. Overall, our respondents expect a relative increase in compensation for in-demand jobs in every industry surveyed, in line with increased productivity and skills requirements. They also expect an overall increase in work-life balance in all industries except the Consumer sector, where the outlook for this dimension remains stable.
Expectations are less clear with regard to overall job security, which is expected to increase in the Energy, Financial Services, Healthcare and Information and Communication Technology sectors, but to decrease in the Basic and Infrastructure, Consumer, Media, Entertainment and Information, Mobility and Professional Services industries. It is important to note that these are aggregate results for entire industries. For example, Energy includes renewables and utilities in addition to oil and gas.
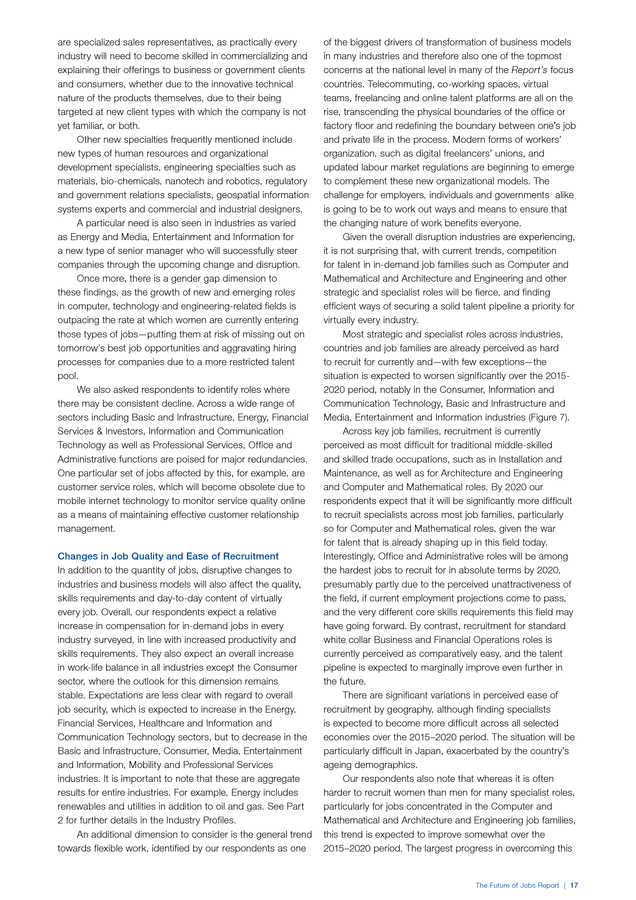
See Part 2 for further details in the Industry Profiles. An additional dimension to consider is the general trend towards flexible work, identified by our respondents as one of the biggest drivers of transformation of business models in many industries and therefore also one of the topmost concerns at the national level in many of the Report’s focus countries. Telecommuting, co-working spaces, virtual teams, freelancing and online talent platforms are all on the rise, transcending the physical boundaries of the office or factory floor and redefining the boundary between one’s job and private life in the process. Modern forms of workers’ organization, such as digital freelancers’ unions, and updated labour market regulations are beginning to emerge to complement these new organizational models.
The challenge for employers, individuals and governments alike is going to be to work out ways and means to ensure that the changing nature of work benefits everyone. Given the overall disruption industries are experiencing, it is not surprising that, with current trends, competition for talent in in-demand job families such as Computer and Mathematical and Architecture and Engineering and other strategic and specialist roles will be fierce, and finding efficient ways of securing a solid talent pipeline a priority for virtually every industry. Most strategic and specialist roles across industries, countries and job families are already perceived as hard to recruit for currently and—with few exceptions—the situation is expected to worsen significantly over the 20152020 period, notably in the Consumer, Information and Communication Technology, Basic and Infrastructure and Media, Entertainment and Information industries (Figure 7). Across key job families, recruitment is currently perceived as most difficult for traditional middle-skilled and skilled trade occupations, such as in Installation and Maintenance, as well as for Architecture and Engineering and Computer and Mathematical roles. By 2020 our respondents expect that it will be significantly more difficult to recruit specialists across most job families, particularly so for Computer and Mathematical roles, given the war for talent that is already shaping up in this field today. Interestingly, Office and Administrative roles will be among the hardest jobs to recruit for in absolute terms by 2020, presumably partly due to the perceived unattractiveness of the field, if current employment projections come to pass, and the very different core skills requirements this field may have going forward. By contrast, recruitment for standard white collar Business and Financial Operations roles is currently perceived as comparatively easy, and the talent pipeline is expected to marginally improve even further in the future. There are significant variations in perceived ease of recruitment by geography, although finding specialists is expected to become more difficult across all selected economies over the 2015–2020 period.
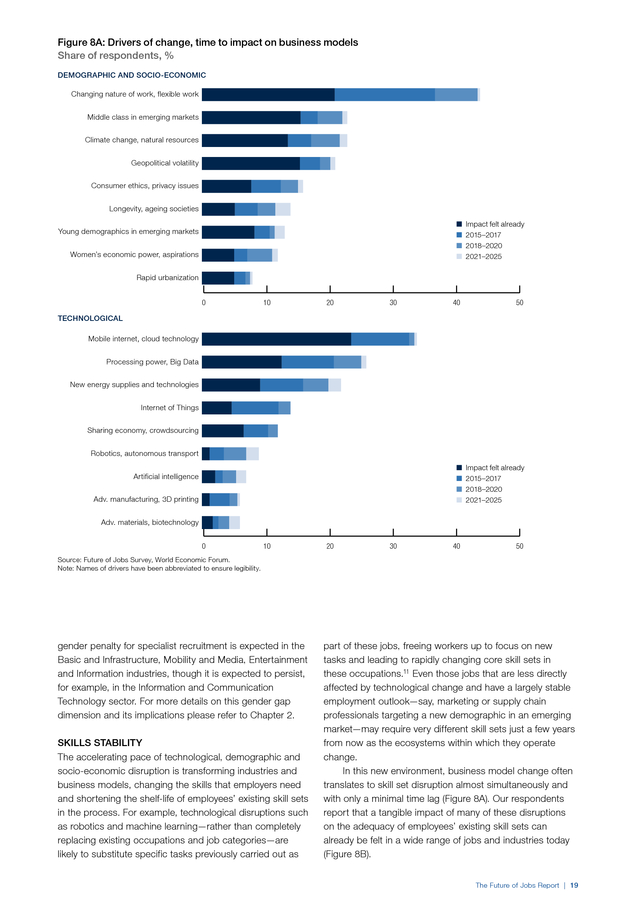
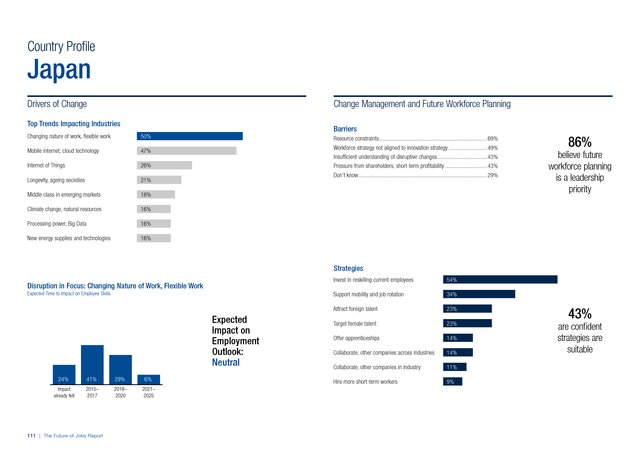
The situation will be particularly difficult in Japan, exacerbated by the country’s ageing demographics. Our respondents also note that whereas it is often harder to recruit women than men for many specialist roles, particularly for jobs concentrated in the Computer and Mathematical and Architecture and Engineering job families, this trend is expected to improve somewhat over the 2015–2020 period. The largest progress in overcoming this The Future of Jobs Report | 17 . Figure 7: Expected change in ease of recruitment, 2015–2020 Perception rating on a –2 (“very hard”) to +2 (“very easy”) scale INDUSTRIES 1.0 Average ease of recruitment 0.5 0.0 -0.5 –1.0 –0.5 –0.34 –0.14 –0.55 –0.49 –0.54 –0.63 –0.42 –1.5 –0.53 –2.0 Basic and Infrastructure Consumer Energy Financial Services & Investors Healthcare Information and Media, Communication Entertainment Technology and Information Mobility Professional Services JOB FAMILIES 1.0 0.5 Average ease of recruitment 0.02 0.0 –0.5 –0.67 –1.0 –0.44 –0.29 –0.70 –1.5 –0.34 –0.43 –0.58 –0.20 –1.00 –0.20 –2.0 Architecture Arts, Design, Business Computer Construction Installation and Entertainment, and and and and Engineering Sports Financial Mathematical Extraction Maintenance and Media Operations Manage- Manufacturing Life, Ofï¬ce Sales and ment and Physical, and Related Production and Administrative Social Sciences COUNTRY/REGION 1.0 0.5 Average ease of recruitment n/a 0.04 0.0 –0.5 –1.0 –0.44 –0.41 –0.62 –0.06 –0.50 –0.39 –0.65 –0.71 –0.21 –0.67 –0.13 –1.5 –0.50 –2.0 –0.85 ASEAN Australia Brazil China Source: Future of Jobs Survey, World Economic Forum. 18 | The Future of Jobs Report France GCC Germany India Italy Japan Mexico South Africa Turkey United United Kingdom States . Figure 8A: Drivers of change, time to impact on business models Share of respondents, % DEMOGRAPHIC AND SOCIO-ECONOMIC Changing nature of work, flexible work Middle class in emerging markets Climate change, natural resources Geopolitical volatility Consumer ethics, privacy issues Longevity, ageing societies n Impact felt already n 2015–2017 n 2018–2020 n 2021–2025 Young demographics in emerging markets Women’s economic power, aspirations Rapid urbanization 0 10 20 30 40 50 TECHNOLOGICAL Mobile internet, cloud technology Processing power, Big Data New energy supplies and technologies Internet of Things Sharing economy, crowdsourcing Robotics, autonomous transport n Impact felt already n 2015–2017 n 2018–2020 n 2021–2025 Artificial intelligence Adv. manufacturing, 3D printing Adv. materials, biotechnology 0 10 20 30 40 50 Source: Future of Jobs Survey, World Economic Forum. Note: Names of drivers have been abbreviated to ensure legibility. gender penalty for specialist recruitment is expected in the Basic and Infrastructure, Mobility and Media, Entertainment and Information industries, though it is expected to persist, for example, in the Information and Communication Technology sector. For more details on this gender gap dimension and its implications please refer to Chapter 2. SKILLS STABILITY The accelerating pace of technological, demographic and socio-economic disruption is transforming industries and business models, changing the skills that employers need and shortening the shelf-life of employees’ existing skill sets in the process.
For example, technological disruptions such as robotics and machine learning—rather than completely replacing existing occupations and job categories—are likely to substitute specific tasks previously carried out as part of these jobs, freeing workers up to focus on new tasks and leading to rapidly changing core skill sets in these occupations.11 Even those jobs that are less directly affected by technological change and have a largely stable employment outlook—say, marketing or supply chain professionals targeting a new demographic in an emerging market—may require very different skill sets just a few years from now as the ecosystems within which they operate change. In this new environment, business model change often translates to skill set disruption almost simultaneously and with only a minimal time lag (Figure 8A). Our respondents report that a tangible impact of many of these disruptions on the adequacy of employees’ existing skill sets can already be felt in a wide range of jobs and industries today (Figure 8B). The Future of Jobs Report | 19 . Figure 8B: Drivers of change, time to impact on employee skills Share of respondents, % DEMOGRAPHIC AND SOCIO-ECONOMIC Changing nature of work, flexible work Middle class in emerging markets Climate change, natural resources Geopolitical volatility Consumer ethics, privacy issues Longevity, ageing societies n Impact felt already n 2015–2017 n 2018–2020 n 2021–2025 Young demographics in emerging markets Women’s economic power, aspirations Rapid urbanization 0 10 20 30 40 50 TECHNOLOGICAL Mobile internet, cloud technology Processing power, Big Data New energy supplies and technologies Internet of Things Sharing economy, crowdsourcing Robotics, autonomous transport 0 10 20 30 n Impact felt already n 2015–2017 n 2018–2020 n 2021–2025 40 50 0 0 10 10 20 20 30 30 40 40 Artificial intelligence Adv. manufacturing, 3D printing Adv. materials, biotechnology Source: Future of Jobs Survey, World Economic Forum. Note: Names of drivers have been abbreviated to ensure legibility. Impact of Disruptive Change on Existing Skill Sets During previous industrial revolutions, it has often taken decades to build the training systems and labour market institutions needed to develop major new skill sets on a large scale. Given the upcoming pace and scale of disruption brought about by the Fourth Industrial Revolution, however, this may simply not be an option.12 For example, current technological trends are bringing about an unprecedented rate of change in the core curriculum content of many academic fields, with nearly 50% of subject knowledge acquired during the first year of a four-year technical degree outdated by the time students graduate, according to one popular estimate.13 A focus on the state of the talent pipeline for traditional formal qualifications and hard skills therefore risks dramatically understating the scale of impending skill set disruption if a 20 | The Future of Jobs Report 50 50 large part of the existing subject knowledge of the current workforce will be outdated in just a few years. Beyond hard skills and formal qualifications, employers are often equally concerned about the work-related practical skills or competences that current employees (or prospective new hires) are able to use in order to perform various job tasks successfully.14 Focusing on a core set of 35 workrelevant skills and abilities that are widely used across all industry sectors and job families (see Figure 9)—derived from the same classification as our occupation-level data15—the Report finds that these practical skills, too, will be subject to accelerating change and significant disruption in the immediate future.
On average, by 2020, more than a third of the desired core skill sets of most occupations will be comprised of skills that are not yet considered crucial to the job today, according to our respondents. At an industry . Figure 9: Core work-related skills Abilities Cross-functional Skills Basic Skills Cognitive Abilities Content Skills Social Skills »» Cognitive Flexibility »» Creativity »» Logical Reasoning »» Problem Sensitivity »» Mathematical Reasoning »» Visualization »» Active Learning »» Oral Expression »» Reading Comprehension »» Written Expression »» ICT Literacy »» Coordinating with Others »» Emotional Intelligence »» Negotiation »» Persuasion »» Service Orientation »» Training and Teaching Others Physical Abilities Process Skills »» Physical Strength »» Manual Dexterity and Precision »» Active Listening »» Critical Thinking »» Monitoring Self and Others Systems Skills »» Judgement and Decision-making »» Systems Analysis Complex Problem Solving Skills »» Complex Problem Solving Resource Management Skills »» Management of Financial Resources »» Management of Material Resources »» People Management »» Time Management Technical Skills »» Equipment Maintenance and Repair »» Equipment Operation and Control »» Programming »» Quality Control »» Technology and User Experience Design »» Troubleshooting Source: World Economic Forum, based on O*NET Content Model. Note: See Appendix A for further details. level, the highest expected level of skills stability over the 2015–2020 period is found in the Media, Entertainment and Information sector, already profoundly transformed in recent years, while the largest amount of skills disruption is expected to occur in the Financial Services & Investors industry.16 There are various reasons for such dramatic shifts in expected skills requirements. As noted earlier, in the face of rapidly rising computing power, an ability to work with data and make data-based decisions will become an increasingly vital skill across many job families as employers scramble to build a workforce with solid skills in data analysis and presentation (e.g. through visualization) and the amount of potentially useful digital information generated and stored keeps increasing exponentially. In the Consumer sector, for example, vast amounts of data will allow for increased sophistication in inventory management, customer segmentation and product personalization, involving some use and familiarity with technology by jobs at all levels, from retail assistant through to more senior positions. Businesses in industry sectors such as Mobility, Energy, Financial Services & Investors and Information and Communication Technology are increasingly finding themselves confronted with new consumer concerns about issues such as carbon footprints, food safety, labour standards and privacy.
From a skills perspective, they will need to learn to more quickly anticipate these new consumer values, to translate them into product offerings and to become ever more knowledgeable about the processes involved in meeting these demands and the Table 6: Skills Stability, 2015–2020, industries overall Industry group Unstable Stable Industries Overall 35% 65% Media, Entertainment and Information 27% 73% Consumer 30% 71% Healthcare 29% 71% Energy 30% 70% Professional Services 33% 67% Information and Communication Technology 35% 65% Mobility 39% 61% Basic and Infrastructure 42% 58% Financial Services & Investors 43% 57% Source: Future of Jobs Survey, World Economic Forum. impact this may have on their employees’ current skill sets and working practices. While most jobs require use of a wide range of skills, somewhat different skill set combinations are sought after in different industry sectors. Our dataset allows us some generalized observations about the impact of various disruptive changes on skills demand at an aggregate industry level (see Table 7). With regard to the overall scale of demand for various skills in 2020, more than one third (36%) of all jobs across all industries are expected by our respondents to require complex problem-solving as one of their core skills, compared to less than 1 in 20 jobs (4%) that will have a core The Future of Jobs Report | 21 . Table 7: Demand for skills in different industry sectors and overall, 2015 and 2020 Share of jobs requiring skills family as part of their core skill set, % 2020 Current 2020 Current 2020 Current 2020 Current 2020 Current 2020 OVERALL Current PS 2020 MOB Current MEI 2020 ICT Current HE 2020 FS Current EN 2020 CON Current BAS Complex Problem Solving Skills 42 33 28 31 49 38 35 39 35 36 36 46 — — 32 34 35 38 36 36 Social Skills 17 17 26 27 27 28 32 23 30 28 20 19 27 32 22 20 26 24 20 19 Process Skills 10 19 21 22 24 29 36 34 25 36 26 25 27 31 18 22 37 29 18 18 Systems Skills 22 26 28 25 24 18 23 22 — — 26 24 — — 16 23 16 16 16 17 Resource Management Skills 21 15 38 35 29 24 20 20 — — 16 19 38 32 26 28 24 29 14 13 Technical Skills 25 20 20 18 29 22 5 16 — — 22 20 — — 26 21 19 18 14 12 Cognitive Abilities 10 19 13 25 — — 15 23 35 34 20 23 — — 11 27 19 22 11 15 Content Skills 6 13 — — — — 22 24 — — 19 18 — — 22 28 11 15 10 10 Physical Abilities — — — — — — — — — — — — — — — — — — 5 4 Skills family Source: Future of Jobs Survey, World Economic Forum. Figure 10: Change in demand for core work-related skills, 2015-2020, all industries Share of jobs requiring skills family as part of their core skill set, % Scale of skills demand in 2020 Current 2020 Cognitive Abilities 15% 52% Systems Skills 17% 42% Complex Problem Solving 36% 40% Content Skills 10% 40% Process Skills 18% 39% Social Skills 19% 37% Resource Management Skills 13% 36% Technical Skills 12% 33% 4% 31% Physical Abilities 0 20 n growing skills demand 40 60 n stable skills demand 80 100 n declining skills demand Source: Future of Jobs Survey, World Economic Forum. requirement for physical abilities such as physical strength or dexterity. However, along with the impact of disruptive changes on these sectors, it is anticipated that complex problem solving skills will become somewhat less important in industries that are heavily technical today—such as Basic and Infrastructure and Energy—in which technology may automate and take on a bigger part of these complex tasks going forward, and will ascend in those industries, such as 0 22 | The Future of Jobs Report Professional Services and Information and Communication Technology, that are expected to become more complex and analytical due to these trends. Overall, social skills—such as persuasion, emotional intelligence and teaching others—will be in higher demand across industries than narrow technical skills, such as programming or equipment operation and control. Content skills (which include ICT literacy and active learning), 20 40 60 80 100 . Table 8A: Distribution of recent university graduates by degree subject and country Share of degree holders, % ASEAN AUS BRA FRA GCC DEU ITA JPN MEX TUR UK USA Agriculture 4 1 2 1 0 2 2 3 2 3 1 1 Education 16 8 20 3 8 9 7 7 12 10 10 10 Engineering, Manufacturing, Construction 19 8 7 15 16 15 13 17 21 12 9 7 Health and Welfare 9 17 15 15 6 19 16 13 9 6 16 17 Humanities and Arts 6 10 2 10 18 16 15 15 4 8 16 12 Sciences 5 8 5 10 13 13 7 3 6 9 13 9 Services 5 3 3 4 2 3 3 8 1 5 2 8 Social Sciences, Business, Law 32 45 41 42 36 23 32 27 45 47 32 36 Unspecified 4 0 5 0 0 0 5 7 0 0 1 0 Source: World Economic Forum, Human Capital Report 2015, based on UNESCO Institute of Statistics, ISCED 2011. Note: Most recent year available; data not available for China, India, South Africa. Table 8B: Distribution of professionals by degree subject and industry Share of degree holders, % BAS CON EN FS HE ICT MEI MOB PS Agriculture v 2 0 0 2 0 0 0 0 Education 1 4 1 2 5 1 18 2 1 Engineering, Manufacturing, Construction 47 3 51 2 3 25 4 27 3 Health and Welfare 2 5 1 3 29 1 6 2 5 Humanities and Arts 3 17 1 5 5 4 39 3 11 Sciences 16 9 15 11 31 50 11 11 11 Services 0 4 0 1 4 0 1 10 0 Social Sciences, Business, Law 29 50 29 74 18 18 19 39 67 Unspecified 2 5 2 2 2 2 2 4 1 Source: LinkedIn. Note: Share of LinkedIn members with stated tertiary degrees across Future of Jobs Report focus countries; industry classification based on World Economic Forum taxonomy, education subject classification based on ISCED 2011. cognitive abilities (such as creativity and mathematical reasoning) and process skills (such as active listening and critical thinking) will be a growing part of the core skills requirements for many industries. If skills demand is evolving rapidly at an aggregate industry level, the degree of changing skills requirements within individual job families and occupations is even more pronounced (Figure 10). For example, the increasing ubiquity of mobile internet combined with the coming-of-age of the Internet of Things promises to transform the daily routine of many frontline roles in the Sales and Related, Installation and Maintenance, and Manufacturing and Production job families across all industries, requiring a much higher level of technology literacy than in the past. As an ancillary characteristic to increased automation in these fields, employees are The Future of Jobs Report | 23 . Box 1: Anticipating the Future of Jobs: Mapping Skills Supply Job requirements and skills profiles are rapidly changing. Yet when it comes to the traditional tools policymakers and employers have at their disposal to navigate this change there often is a time lag of months, if not years, until updated information becomes available. Growing computing power and large amounts of data are increasingly making it possible to understand and anticipate changes in labour markets in near-real time, and to re-shape education and training policies in a timelier manner to help narrow the widening skills gap. For example, hundreds of millions of workers across the globe have added their professional information—including their education, skills, and past and present jobs—to online talent platforms such as LinkedIn, affording these providers with unique insights into changing skills supply. Increased collaboration between stakeholders such as online talent platforms, human resources consulting firms, employers, policymakers, labour unions and education providers, has the potential to substantially improve the speed and precision of future workforce planning and managing organizational change. In order to map labour market changes, LinkedIn’s analytics describe each job function as an agglomeration of skills, enabling the platform to nowcast changes in the skills landscape as members update their professional information. This enables the platform to identify clusters of skills that are particularly associated with the profiles of members with common job functions and titles and to map how these change over time. It also allows for identifying nuances and differences between the skill sets of common job functions in different industries or geographies. For example, the heatmap below shows how the most common skills reported by mechanical engineers vary across different industries.
The dark blue color in area 1 in the chart below shows that mechanical engineers working in various sectors of the Mobility industry have similar skills. It also shows that their skills differ from the skills of mechanical engineers who work in the Healthcare industry (area 2) or the Energy and Basic and Infrastructure sectors (areas 3 and 4). expected to have more responsibilities related to equipment control and maintenance and problem-solving skills, as well as a broader general understanding of the work processes of their company or organization. Many formerly purely technical occupations are expected to show a new demand for creative and interpersonal skills. For healthcare practitioners, for example, technological innovations will allow for increasing automation of diagnosis and personalization of treatments, redefining many medical roles towards translating and communicating this data effectively to patients.
Similarly, Sales and Related jobs may see an increased demand for creative skills and ideas for promoting a memorable shopping experience, as brick-and-mortar retail has to reposition itself in relation to e-commerce and online competition. Overall, our respondents anticipate that a wide range of occupations will require a higher degree of cognitive abilities—such as creativity, logical reasoning and problem 24 | The Future of Jobs Report By tracking skills that were recently added to members’ profiles as a percentage of those who already reported that skill, it becomes possible to identify skills whose supply is on the rise in particular industries or geographies. This supply-side analysis can be complemented with analysis of skills demand—whether based on job listings, within-job hiring rates, governmental forecasts, or employer surveys such as the one presented in this Report—to identify emerging skills gaps and inform training and skills programmes to prepare the workforce for future requirements. At the national level, countries experience varying inflows and outflows of talent over time. Outflows and inflows of talent often do not have the same skills compositions, resulting in a correlation between talent mobility and changing skills gaps across countries and over time. The Country and Regional Profiles in Part 2 of the Report highlight the current and expected share of strategic and specialist job functions anticipated by respondents from the corresponding industry to be recruited locally in the country.
A very low local recruitment share may indicate skills shortages and a very high reliance on expatriate talent. A very high local recruitment share might indicate underutilized opportunities to diversify experience and increase knowledge transfer to the local workforce from internationally mobile experts. On the supply side, by tracking members’ profile changes with regard to their home geography, the LinkedIn platform can track the rate at which countries are losing or gaining particular in-demand skills.1 Data on both demand and supply is critical for informed decision making on talent mobility policies. Notes 1 State, B., M.
Rodriguez, et. al., “Migration of Professionals to the US: Evidence From LinkedIn Data”, Social Informatics, pp. 531–543, 2014. sensitivity—as part of their core skill set.
More than half (52%, the bright blue part of the bar in Figure 10) of all jobs expected to require these cognitive abilities as part of their core skill set in 2020 do not yet do so today, or only to a much smaller extent. In another 30% of jobs (the dark blue part of the bar in Figure 10), demand for these skills is currently already high and will remain so over the 2015– 2020 period. Only 18% of jobs requiring high cognitive skills today are expected to do so less in the future (the grey part of the bar in Figure 10). At the other end of the scale, among all jobs requiring physical abilities less than one third (31%) are expected to have a growing demand for these in the future, about as many as the proportion of jobs in which physical abilities are anticipated to decline in importance (27%).
The skills family with the most stable demand across all jobs requiring these skills today or in the future are technical skills: nearly half (44%) of all jobs requiring these skills today will have a stable need for them in the coming years. . Box 1: Anticipating the Future of Jobs: Mapping Skills Supply (cont’d.) Heatmap: Distribution of skills, mechanical engineers, different industries 4 3 2 Highly relevant skill Defense and Space Aviation and Aerospace Medical Device Manufacturing Electronics Automotive Machinery Industrial Automation Industrial Engineering Design Construction Civil Engineering Utilities Mining and Metals Chemicals Oil and Energy 1 Engineering Design EPC Inspection Piping Pumps Commissioning Project Engineering CAD AutoCAD HVAC MEP Machining Solidworks Sheet Metal Design for Manufacturing Product Design R&D FMEA Manufacturing Engineering Management Simulations Systems Engineering LabVIEW GD&T PTC CREO CATIA Finite Element Analysis ANSYS MATLAB Less relevant skill Source: LinkedIn. Understanding Current Skills Supply Today’s job markets and in-demand skills are vastly different than the ones of 10 or even five years ago, and—as demonstrated in this Report—the pace of change is only set to accelerate. Governments, businesses and individuals alike are increasingly concerned with identifying and forecasting skills that are relevant not just today but that will remain or become so in the future to meet business demands for talent and enable those that possess them to seize emerging opportunities. In light of technological trends such as the ones outlined in this Report, in recent years many countries have undertaken significant efforts to increase the amount of STEM (science, technology, engineering and mathematics) graduates produced by their national education systems (Table 8A). While the employment trends identified by this Report certainly corroborate the importance of these efforts, it is nevertheless also clear that the potential net job creation in absolute terms in the STEM field alone will not be sufficient to absorb strains on other parts of the labour market. What we have found instead is that disruptive changes will have a significant impact on skills requirements in all job families and that they are creating a range of opportunities and challenges in all industries, not just narrowly related to ‘hard knowledge’, technical skills and technology.
In order to manage these trends successfully, there is a need for potentially reskilling and upskilling talent from varied academic backgrounds in all industries (Table 8B). This Report has focused on shifts and disruptions to skills requirements as perceived by CHROs. It is clear that even if today’s skills base would conform exactly to today’s perceived skills requirements, the looming skills instability challenge would be substantial. In practice, however, there are already today large mismatches between the actual supply and demand of key work-related skills (Table 8C), with 38% of employers reporting difficulties in in filling jobs The Future of Jobs Report | 25 .
Table 8C: Distribution of skills supply, by industry Share of skills family in industry total, % Skills family BAS CON EN FS HE ICT MEI MOB PS OVERALL Content Skills 4 4 3 5 11 3 14 3 8 6 Process Skills 6 4 7 6 11 3 9 3 11 7 Resource Management Skills 23 26 31 27 18 25 8 27 18 23 Complex Problem Solving Skills 8 5 7 6 7 4 3 5 5 6 Social Skills 40 55 33 47 47 30 50 47 48 44 Systems Skills 4 4 6 7 3 6 1 3 5 4 Technical Skills 15 2 13 2 3 29 15 12 5 11 Source: LinkedIn. Note: Based on share of LinkedIn members with stated skills across Future of Jobs Report focus countries. LinkedIn currently has more than 400 million members in more than 200 countries and territories. Industry classification based on World Economic Forum taxonomy. in 2015, according to ManpowerGroup’s most recent Talent Shortage Survey.17 Skills mismatches may therefore emerge not just between the supply and demand of existing skills today, but also between today’s skills base and future skills requirements. Efforts aimed at closing the skills gap will increasingly need to be grounded in a solid understanding of a country’s or industry’s skills base today and of changing future skills requirements due to disruptive change. For example, efforts to place unemployed youth in apprenticeships in certain job categories through targeted skills training may be selfdefeating if skills requirements in that job category are likely to be drastically different in just a few years’ time.
Indeed, in some cases such efforts may be more successful if they disregard current labour market demands and past trends and instead base their models on future expectations. Across industries, geographies and job families, an ability to understand the current skills base in near-real time and to accurately forecast, anticipate and prepare for future job contents and skills requirements will be increasingly critical for businesses, labour market policymakers, workers’ organizations and individuals to succeed. Drivers of change to job markets such as Big Data analytics may themselves become useful tools in managing this process. FUTURE WORKFORCE STRATEGY The impact of technological, demographic and socioeconomic disruptions on business models will be felt in transformations to the employment landscape and skills requirements, resulting in substantial challenges for recruiting, training and managing talent. Several industries may find themselves in a scenario of positive employment demand for hard-to-recruit specialist occupations with simultaneous skills instability across many existing roles.
For example, the Mobility industries expect employment growth accompanied by a situation where nearly 40% of the skills required by key jobs in the industry are not yet part of the core skill set of these functions today. 26 | The Future of Jobs Report At the same time, workers in lower skilled roles, particularly in the Office and Administrative and Manufacturing and Production job families, may find themselves caught up in a vicious cycle where low skills stability means they could face redundancy without significant re- and upskilling even while disruptive change may erode employers’ incentives and the business case for investing in such reskilling. Not anticipating and addressing such issues in a timely manner over the coming years may come at an enormous economic and social cost for businesses, individuals and economies and societies as a whole. Recognition of Reskilling and Retraining as a Priority Responses to the Future of Jobs Survey indicate that business leaders are aware of these looming challenges but have been slow to act decisively. Just over two thirds of our respondents believe that future workforce planning and change management features as a reasonably high or very high priority on the agenda of their company’s or organization’s senior leadership, ranging from just over half in the Basic and Infrastructure sector to four out of five respondents in Energy and Healthcare.
Across all industries, about two thirds of our respondents also report intentions to invest in the reskilling of current employees as part of their change management and future workforce planning efforts, making it by far the highest-ranked such strategy overall (Figure 13). However, companies that report recognizing future workforce planning as a priority are nearly 50% more likely to plan to invest in reskilling than companies who do not (61% against 39% of respondents). Respondents’ expectations about future skills requirements also provide a relatively clear indication of where such retraining efforts might be concentrated in the most effective and efficient way. The Report categorizes work-relevant skills into abilities, basic skills and crossfunctional skills (Figure 9), with particularly strong demand growth expected in certain cross-functional skills, cognitive abilities and basic skills such as active learning and ICT .
Figure 11: Employment outlook and skills stability, by industry Negative outlook, skills stable 100 Positive outlook, skills stable 90 80 Energy Skills stability 2015-2020, % Healthcare AVERAGE Media, Entertainment and Information Consumer Professional Services 70 60 Mobility Basic and Infrastructure Information and Communication Technology Financial Services & Investors 50 40 30 20 Negative outlook, skills disrupted –1.0 –0.5 Positive outlook, skills disrupted 10 0 0.0 0.5 1.0 1.5 2.0 2.5 3.0 Expected change in employment, 2015-2020, % Source: Future of Jobs Survey, World Economic Forum. literacy. Applying a time lens to the potential for acquisition of these skills (what ManpowerGroup refers to as a teachable fit18), it seems clear that targeted training in crossfunctional skills is within the remit of an individual company or even a group of companies coming together for synergy and greater efficiency. By contrast, cognitive abilities take much longer to develop and touch upon the need for high quality and inclusive secondary, primary and pre-school education. This is a field in which government policy will be required and companies can work with governments to clearly define the need and introduce new delivery models.
Finally, basic skills are also traditionally acquired during formal education and before entering the workforce, but are relatively straightforward to acquire compared to cognitive abilities. This is a field in which companies have an opportunity to take a proactive approach to building their talent pipelines by working much more directly with education providers. In addition to such efforts by individual companies there are also opportunities for redeploying skills across industry boundaries from declining to growing parts of the labour market. For example, our respondents expect a decline in Sales and Related jobs and their accompanying skill sets in the Financial Services & Investors, Professional Services and Mobility industries, but a solid growth in demand for these skill sets in the Basic and Infrastructure, Information and Communication Technology and Media, Entertainment and Information industries.
There may be opportunities for greater formalized inter-industry collaboration in facilitating the transfer of these skills and enabling the receiving industries to acquire experienced talent from industries that have declining demand for those same skills. Our research also points to similar opportunities for redeploying talent and skills in the Installation and Maintenance job family, from the Information and Communication Technology sector towards the Energy and Mobility industries, and Legal jobs, from the Professional Services industry towards the Financial Services & Investors and Basic and Infrastructure sectors. Such an approach not only makes recruiting easier for the hiring industry but also preserves employment opportunities for individuals whose skills may be falling out of favour in another sector of the economy, creating a win-win scenario for both employer and employee. More broadly still, there is a wide range of currently underutilized opportunities for building multistakeholder partnerships for better matching skills and labour market needs.19 Barriers to Managing Change Reskilling and retraining efforts may not yield the desired return if they are not cognizant of impending disruptive change and instead base their content primarily on today’s requirements or past successes.
Many of our respondents are acutely aware of the limitations to their current planning for disruptive change and its implications for the talent landscape. Currently, only 53% of CHROs surveyed are reasonably or highly confident regarding the adequacy of their organization’s future workforce strategy to prepare for these shifts. The main perceived barriers to a more decisive approach include a lack of understanding of the disruptive changes ahead, resource constraints and short-term profitability pressures and lack of alignment between workforce strategies and firms’ innovation strategies (Figure 12). However, there are some significant differences between industries in this regard.
The Information and Communication Technology sector reports a comparatively good understanding of drivers of change and instead sees resource constraints as its main barrier whereas the Media, Entertainment and Information industry—perhaps the sector that has seen the largest scale of disruption of its traditional business model to date—reports a very good understanding of the nature of disruptive changes ahead and is instead mainly concerned about short-term shareholder pressures (Table 9). Furthermore, we find that CHROs’ confidence in the adequacy of their company’s or organization’s workforce The Future of Jobs Report | 27 . Figure 12: Significance of barriers to change, industries overall Share of respondents reporting barrier, % Insufficient understanding of disruptive changes 51% Resource constraints 50% Pressure from shareholders, short-term profitability 42% Workforce strategy not aligned to innovation strategy 37% Insufficient priority by top management 21% Don’t know 18% Insufficient priority by line management 18% No barriers 8% Source: Future of Jobs Survey, World Economic Forum. Note: Names of barriers have been abbreviated to ensure legibility. strategy is strongly correlated with the perceived priority given to these issues by top management and with perceived alignment between workforce strategy and innovation strategy. Conversely, CHROs who do not see these two measures in place are over 50% more likely not to express confidence in their firm’s strategy. However, the prevalence of insufficient understanding of disruptive changes as well as resource constraints as main barriers to managing change perhaps helps to explain the current mismatch between the magnitude of the upcoming changes and the relatively timid actions being taken by companies to address these challenges so far. For example, a number of promising approaches appear underutilized across almost all industries. Despite widespread proclamations in support of workplace gender parity, only one in four companies envisages actively targeting female talent, ranging from 46% in the Media, Entertainment and Information sector to only 16% in Information and Communication Technology. There also 0.3 0.4 0.5 seems to 0.2 varying openness to collaboration, whether be within or across industries, with the latter seemingly much more acceptable.
Furthermore, a focus on making better use of the accumulated experience of older employees Envisaged Workforce Strategies In order to meet the talent and skills challenges brought about by expected business model disruptions, companies envisage pursuing a range of innovative workforce strategies; providing employees with wider exposure to roles across the firm, stepping up efforts to target the female 0.0 talent pool and collaborating with the education sector 0.1 more closely than in the past are some of the more popular measures (Figure 13). Across all industries, plans to invest in reskilling current employees feature prominently among reported future workforce strategies. Table 9: Significance of barriers to change, by industry Share of respondents reporting barrier, % BAS CON EN FS HE ICT MEI MOB PS OVERALL Insufficient understanding of disruptive changes 59 60 55 67 50 48 36 58 51 51 Resource constraints 54 55 55 43 75 74 36 50 49 50 Pressure from shareholders, short-term profitability 51 50 41 47 50 42 64 38 35 42 Workforce strategy not aligned to innovation strategy 38 50 32 53 50 39 50 17 37 37 Insufficient priority by top management 27 20 18 27 25 23 7 21 23 21 Don’t know 16 10 36 23 50 6 14 17 19 18 Insufficient priority by line management 30 0 9 27 0 16 21 33 16 18 No barriers 5 15 14 7 8 3 7 13 7 8 Barrier Source: Future of Jobs Survey, World Economic Forum. Note: Names of barriers have been abbreviated to ensure legibility. 28 | The Future of Jobs Report 0.6 . Figure 13: Future workforce strategies, industries overall Share of respondents pursuing strategy, % Invest in reskilling current employees 65% Support mobility and job rotation 39% Collaborate, educational institutions 25% Target female talent 25% Attract foreign talent 22% Offer apprenticeships 22% Collaborate, other companies across industries 14% Collaborate, other companies in industry 12% Target minorities’ talent 12% Hire more short-term workers 11% Source: Future of Jobs Survey, World Economic Forum. Note: Names of strategies have been abbreviated to ensure legibility. and building an ageless workforce barely register among They require a new mindset to meet their talent needs and proposed workforce strategies. to optimize social outcomes. This entails several major In fact, these findings are in striking contrast with the changes in how business views and manages talent, both envisaged measures of respondents who report both that immediately and in the longer term. In particular, there are they are confident in the adequacy of their future workforce four areas with short term implications and three that are strategy and that these issues are perceived as a priority for critical for long term resilience. their top management. This group is more than twice as likely to be targeting female talent and minority talent and over Immediate Focus 0.0 0.1 0.2 • 0.3 0.4 0.5 0.6 0.7 50% more likely to be supporting employees’ mobility and Reinventing the HR Function: As business leaders job rotation within the firm.
They are significantly less likely begin to consider proactive adaptation to a new talent to plan to hire more short-term workers or to use expatriate landscape, they need to manage skills disruption as talent, in line with their equally much higher probability to an urgent concern. They must understand that talent invest in internal talent and reskilling, as already noted above. is no longer a long-term issue that can be solved with There is a need in several of these areas for bolder leadership tried and tested approaches that were successful in the and strategic action within companies and within and across past or by instantly replacing existing workers. Instead, industries, including partnerships with public institutions and as the rate of skills change accelerates across both old the education sector. and new roles in all industries, proactive and innovative skill-building and talent management is an urgent issue. Recommendations for Action What this requires is an HR function that is rapidly While the implications of accelerating disruptive change becoming more strategic and has a seat at the table— to business models are far-reaching—even daunting— for one that employs new kinds of analytical tools to spot employment and skills, rapid adjustment to the new reality talent trends and skills gaps, and provides insights that and the opportunities it offers is possible, provided there can help organizations align their business, innovation is concerted effort by all stakeholders.
For government, it and talent management strategies to maximize will entail innovating within education and labour-related available opportunities to capitalize on transformational policymaking, requiring a skills evolution of its own. For trends. the education and training sector, it will mean vast new business opportunities as it provides new services to • Making Use of Data Analytics: Businesses will need individuals, entrepreneurs, large corporations and the public to build a new approach to workforce planning and sector. The sector may become a noteworthy new source of talent management, where better forecasting data employment itself. and planning metrics will need to be central.
Earlier For businesses to capitalize on new opportunities, they mapping of emerging job categories, anticipated will need to put talent development and future workforce redundancies and changing skills requirements in strategy front and centre to their growth. Firms can no response to the changing environment will allow longer be passive consumers of ready-made human capital. businesses to form effective talent repurposing The Future of Jobs Report | 29 0.8 . Table 10: Significance of workforce strategies, by industry Share of respondents pursuing strategy, % BAS CON EN FS HE ICT MEI MOB PS OVERALL Invest in reskilling current employees 65 75 59 67 83 81 77 83 56 65 Support mobility and job rotation 41 45 50 47 50 35 15 54 40 39 Collaborate, educational institutions 38 30 23 20 25 35 38 29 14 25 Target female talent 35 25 36 30 17 16 46 21 21 25 Attract foreign talent 35 25 41 23 42 19 15 25 7 22 Offer apprenticeships 14 35 23 20 8 23 31 29 33 22 Collaborate, other companies across industries 11 20 14 17 0 10 23 8 28 14 Collaborate, other companies in industry 19 5 18 10 25 10 15 0 14 12 Target minorities' talent 14 5 9 13 33 16 8 13 9 12 Hire more short-term workers 3 20 5 7 0 26 23 17 9 11 Hire more virtual workers 5 5 0 10 0 6 8 0 12 6 Collaborate, vocational training and certification providers 3 5 14 3 0 3 0 13 7 5 Don’t know 0 0 0 17 17 13 15 0 0 5 Invest in older workers 11 5 5 0 0 3 8 0 5 4 Collaborate, private employment agencies 0 0 5 7 8 3 8 0 5 3 There is no strategy 8 0 0 7 0 0 0 0 0 2 Collaborate, labour unions 0 0 0 3 0 3 0 4 0 1 Strategy Source: Future of Jobs Survey, World Economic Forum. Note: Names of strategies have been abbreviated to ensure legibility. strategies within their company, their own industry and across industries. HR has the opportunity to add significant strategic value in predicting the skills that will be needed, and plan for changes in demand and supply. To support such efforts, the Forum’s Future of Jobs project provides in-depth analysis on industries, countries, occupations and skills. • Talent diversity—no more excuses: As study after study demonstrates the business benefits of workforce diversity and companies expect finding talent for many key specialist roles to become much more difficult by 2020, it is time for a fundamental change in how talent diversity issues—whether in the realm of gender, age, ethnicity or sexual orientation—are perceived and well-known barriers tackled. In this area, too, technology and data analytics may become a useful tool for advancing workforce parity, whether by facilitating objective assessment, understanding typical careers paths and cliffs, identifying unconscious biases in job ads and recruitment processes or even by 30 | The Future of Jobs Report using wearable technologies to understand workplace behaviours and encourage systemic change. • Leveraging flexible working arrangements and online talent platforms: As physical and organizational boundaries are becoming increasingly blurred, organizations are going to have to become significantly more agile in the way they think about managing people’s work and about the workforce as a whole. Work is what people do and not where they do it. Businesses will increasingly connect and collaborate remotely with freelancers and independent professionals through digital talent platforms.
Modern forms of association such as digital freelancers’ unions and updated labour market regulations will increasingly begin to emerge to complement these new organizational models. For policymakers, an important set of regulations concerns the portability of safeguards and benefits between jobs and the equivalent treatment in law of different forms of labour and employment types. . Box 2: Anticipating the Future of Jobs: The New Vision for Arab Employment As an integral part of its practical and action-oriented application, the World Economic Forum’s Global Challenge Initiative on Employment, Skills and Human Capital is deploying a number of regionally focused collaboration projects, reflecting on how emerging economies may tackle the challenge of closing skills gaps and providing job opportunities to their fast-growing young population. By tailoring and applying insights and recommendations developed at the global level, these projects support efforts to improve the state of employment, skills and human capital in local and regional contexts. Furthermore, they serve as an invaluable source of bottom-up evidence and learnings that can be elevated and shared to foster crossregional learnings and global adaptation. Currently, the Forum is focusing on three such projects: the New Vision for Arab Employment, described in more detail below, the Africa Skills Initiative and the India Skills Initiative. THE NEW VISION FOR ARAB EMPLOYMENT The New Vision for Arab Employment serves as a platform for driving action and partnerships through nationally and regionally focused projects that promote collaboration and partnership between local and multinational businesses as well as governments and the education and training sector.
Working in close collaboration with key business, public sector and civil society leaders, the initiative rallies key regional actors through calls-to-action and pilots best practices to effect change. It also aims at identifying key cross-cutting areas of intervention that will help address employment, skills and human capital gaps for the 21st century. Phase 1: Understanding the regional context Talent is one of the most critical factors for an economy’s innovative capacity and growth prospects. With more than half of its population under 25 years of age and the world’s highest youth unemployment rate, the Middle East and North Africa (MENA) region faces critical challenges.
Concurrently, business leaders report difficulties in filling roles. In particular, persistently high youth unemployment rates in the Gulf Cooperation Council countries demonstrate that addressing youth unemployment effectively requires more than budgetary capacity and economic growth. Launched in 2013, the aim of the first phase of the initiative was to better understand how to turn this youthful populace into a youth dividend and implement best practices of interventions to inverse the critical trend of youth unemployment. For example, the Forum’s Human Capital Index showed that despite significant investment in education by many countries, the region is not equipping youth with skills for the 21st century.
Out of the 124 economies covered by the Index in 2015, only two from the region—the United Arab Emirates (54) and Qatar (56)—made it into the upper half of the rankings. Kuwait (93) and Saudi Arabia (85), whose GDP per capita is at least fivefold higher, performed at a comparable level to Morocco (95) and Egypt (84), respectively, highlighting that economic performance alone is an inadequate measure of countries’ abilities to successfully leverage their human capital endowment. In addition, it was found that the region runs the risk of worsening unemployment and talent shortages if skills gaps are exacerbated due to technological changes that further disrupt business models and labour markets. Phase 2: Commitments to affect change in the region Recognizing that longer term reform by the public sector must be complemented by the active collaboration of the private sector, the Forum’s Regional Business Council for MENA launched a second phase of the initiative in 2015, aiming to invest in the continuous learning, reskilling, upskilling and job readiness of 100,000 of the region’s youth by 2017.
To date over 10 partners have made specific commitments to address the jobs and skills challenge in the region aimed at reducing unemployment, tackling skills gaps or facilitating talent flows through initiatives implemented directly by each company in collaboration with other stakeholders. Each commitment sets a target to achieve its outcomes against a specific set of metrics within a period of two years and meets the following criteria: • Extends beyond the pledging organization’s internal HR programme • Consists of a new initiative or the additional scaling up of an existing initiative • Contributes to the public good by creating added value for society and economy • Ideally, aligns with the organization’s core business strategy • Is a multistakeholder commitment, led by the partner In addition to a set of founding pledges that impacted nearly 50,000 youth, the initiative has engaged others to join forces in order to reach—or surpass—the goal of 100,000. The pledge model also serves as a platform for continued learning and collaboration between businesses seeking to address the region’s talent value chain and as a hub for exchange with governments, civil society organizations and experts. Phase 3: The Future of Jobs and public-private dialogue Recognizing that current company-specific efforts must be supplemented with systemic change, the leaders of the Forum’s Regional Business Council and others are engaging in a new phase of the initiative, which will directly build on the insights provided by the Future of Jobs Insight Report.
It is expected that the Future of Jobs work will force a more precise dialogue to strengthen the existing framework of collaboration for business leaders and provide new data and analysis for better-informed decision-making in the future with a view to enhancing talent pipelines and increasing competitiveness in the region. In particular, leaders in the region are keen to understand what skills should constitute the core of education in the future and what reforms the private sector, particularly within key industries, can initiate in a dialogue with the public and education sectors to leapfrog towards a more resilient and efficient learning and skills value chain. Furthermore, as disruptive change is expected to spread across the globe, what will be the impact in the region and how will the actors in the region prepare for this evolution? New industries and business models will emerge, new talent will be required and so this future-oriented body of work will be a critical tool to broaden the space for solutions to allow both existing and new industry sectors to thrive and support the region’s overall development. The Future of Jobs Report | 31 . Longer Term Focus • Rethinking education systems: By one popular estimate 65% of children entering primary schools today will ultimately work in new job types and functions that currently don’t yet exist. Technological trends such as the Fourth Industrial Revolution will create many new cross-functional roles for which employees will need both technical and social and analytical skills. Most existing education systems at all levels provide highly siloed training and continue a number of 20th century practices that are hindering progress on today’s talent and labour market issues. Two such legacy issues burdening formal education systems worldwide are the dichotomy between Humanities and Sciences and applied and pure training, on the one hand, and the prestige premium attached to tertiary-certified forms of education—rather than the actual content of learning—on the other hand. Put bluntly, there is simply no good reason to indefinitely maintain either of these in today’s world. Businesses should work closely with governments, education providers and others to imagine what a true 21st century curriculum might look like. • Incentivizing lifelong learning: The dwindling future population share of today’s youth cohort in many ageing economies implies that simply reforming current education systems to better equip today’s students to meet future skills requirements—as worthwhile and daunting as that task is—is not going to be enough to remain competitive.
Ageing countries won’t just need lifelong learning—they will need wholesale reskilling of existing workforces throughout their lifecycle. Governments and businesses have many opportunities to collaborate more to ensure that individuals have the time, motivation and means to seek retraining opportunities. For example, Denmark allocates funding for two weeks’ certified skills training per year for adults, and the strong emphasis the country places on in-work training helps explain its very high degree of employment mobility, with 70% of workers considering mid-career transitions a ‘good thing’, compared to 30% or less in most other European countries.20 At the company-level, technology can be continuously leveraged to upskill and reskill employees. • Cross-industry and public-private collaboration: Given the complexity of the change management needed, businesses will need to realize that collaboration on talent issues, rather than competition, is no longer a nice-to-have but rather a necessary strategy. Businesses should work with industry partners to develop a clearer view on future skills and employment needs, pooling resources where appropriate to maximize benefits, and work more closely with governments to map a future view of skill demand versus supply.
Resources should then be put into place regionally to upskill those out of work to fill high priority employment gaps. Such multi-sector 32 | The Future of Jobs Report partnerships and collaboration, when they leverage the expertise of each partner in a complementary manner, are indispensable components of implementing scalable solutions to jobs and skills challenges. While a single business can form one-to-one partnerships for its own talent needs, partnerships between multiple businesses, educational institutions and accreditation providers can result in an overall increase in the quality of the talent pool, at lower costs and with greater social benefits.
Businesses also need to engage with governments on strategically redeploying redundant skills between sectors, addressing cost concerns and social stability.21 . Chapter 2: The Industry Gender Gap Tapping into the female talent pool is increasingly regarded as a prominent and promising area for workforce planning. The previous chapter of this Report found that more than a quarter of companies surveyed identified female talent as a key feature of future workforce strategy. Overall, 53% of our respondents perceive promoting women’s participation as a priority item on their organization’s senior leadership’s agenda and 58% are confident about the efficacy of their current measures undertaken in this regard. Similarly, women’s rising labour force participation and economic power as consumers is increasingly perceived as a key driver of change across several industry sectors, such as in the Consumer industry, and one that is highly correlated with expected employment growth—an unambiguously positive trend in a somewhat turbulent landscape of technological, demographic and socioeconomic change. The continuing ascent of women in the workplace is also contributing to increasingly diverse and dynamic workplace cultures. As the Fourth Industrial Revolution takes hold in different industries and job families, it will affect female and male workers in distinct ways. By their very nature, many anticipated disruptive changes have the potential to enable the narrowing of gender gaps in many industries. For example, household work, that is still primarily the responsibility of women in most societies, could be further automated, leaving women to put their skill sets to better use, including in the formal labour market. At same time, however, job families expecting the highest employment growth, such as Architecture and Engineering and Computer and Mathematical, currently have some of the lowest female participation and find it much harder than average to recruit women.
As these job families take on newfound applications across industries, will sectors which previously housed few such roles but have a strong track record of employing, retaining and leveraging female talent, be more adept than others at addressing their skills shortages by recruiting female talent? At the declining end of the labour market, the drivers of change identified by our respondents will heavily disrupt two of the job families most clearly dominated by women and men: Office and Administrative and Manufacturing and Production, respectively. In short, as industries prepare to adapt to disruptive change the dynamics of the industry gender gap will be at the centre of many facets of the new employment landscape. Figure 14: Gender parity as part of future workforce strategy Share of respondents agreeing with statement, % Women’s economic power, aspirations perceived as driver of change in the industry Targeting female talent perceived as key future workforce strategy Industries Overall 10% 25% Basic and Infrastructure 10% 35% Consumer 21% 25% Energy 13% 36% 9% 30% 10% 17% Information and Communication Technology 3% 16% Media, Entertainment and Information 7% 46% Mobility 6% 21% 15% 21% Financial Services & Investors Healthcare Professional Services Source: Future of Jobs Survey, World Economic Forum. The Future of Jobs Report | 33 . Figure 15: Significance of rationales for gender parity, industries overall Share of respondents stating rationale, % Fairness and equality 42% Enhance innovation 23% Reflect gender composition of customer base 23% Enhance decision-making 22% Expand talent pool 16% External pressures, reputation 16% Government regulation 10% No rationale 9% Source: Future of Jobs Survey, World Economic Forum. Note: Names of rationales have been abbreviated to ensure legibility. Table 11: Significance of rationales for gender parity, by industry Share of respondents stating rationale, % BAS CON EN FS HE ICT MEI MOB PS OVERALL Fairness and equality 39 75 50 60 40 63 31 58 50 42 Enhance innovation 33 20 20 43 40 27 38 33 25 23 Reflect gender composition of customer base 14 35 40 43 30 33 31 13 39 23 Enhance decision-making 19 15 45 30 50 23 31 29 25 22 Expand talent pool 6 30 25 23 0 37 23 29 8 16 External pressures, reputation 28 20 0.0 5 7 10 33 15 13 17 0.4 16 Government regulation 22 5 15 13 10 20 8 8 3 10 No rationale 17 5 10 10 10 7 8 13 14 9 Demand by employees 6 10 10 0 10 7 15 21 11 9 Financial returns 11 10 0 17 10 0 31 0 22 8 Don't know 8 5 5 3 0 7 8 4 6 5 Industry 0.1 0.2 0.3 Source: Future of Jobs Survey, World Economic Forum. Note: Names of rationales have been abbreviated to ensure legibility. THE BUSINESS CASE FOR CHANGE Over the past 10 years, the World Economic Forum’s Global Gender Gap Report has been tracking the economic gender gap across different regions of the world. Progress has been uneven and slow. A mere 3% of the global economic gender gap has been closed over that period. In addition to a values-based case for gender equality, there is an accompanying economic imperative for including women more fully into society and the workplace. Female talent remains one of the most under-utilized business resources, either squandered through lack of progression or untapped from the onset.
Although women are, on average, more educated than men globally and now participate 34 | The Future of Jobs Report more fully in professional and technical occupations than 10 years ago, as of today, their chances to rise to positions of leadership are only 28% of those of men. Women continue to make up less of the labour force overall than men, and where they participate in the formal economy their earnings for similar work are lower.22 The talents of half the world’s potential workforce are thus often wasted or underutilized due to barriers on the path to women’s successful workforce integration. In general, women’s participation in the workforce is no longer perceived as a social issue alone, but also as a business issue—costing women, companies and ultimately entire economies. Many business leaders increasingly 0.5 .
Table 12: Gender gap and female share of customer base, by industry Share of female workforce, % Relative ease of recruitment Business to business Business to consumer Business to government Share of women Gender wage gap Current 2020 Current 2020 Current 2020 Current 2020 Industries Overall 30% 32% –0.74 –0.11 25% 33% 31% 33% 21% 27% Basic and Infrastructure 16% 35% –0.99 –0.20 16% 28% 26% 30% 18% 24% Consumer 33% 49% –0.63 –0.35 14% 18% 47% 49% 11% 15% Energy 19% 31% –1.08 0.14 18% 23% 26% 26% 18% 19% Financial Services & Investors 36% 38% –0.78 –0.11 25% 34% 39% 41% 19% 29% Healthcare 51% 15% –0.09 –0.10 50% 43% 57% 57% 60% 60% Information and Communication Technology 24% 25% –0.91 –0.39 25% 33% 24% 30% 17% 21% Media, Entertainment and Information 37% 18% –0.67 0.28 20% 32% 48% 44% 15% 19% Mobility 19% 39% –0.92 –0.04 21% 30% 21% 27% 16% 19% Professional Services 40% 22% –0.39 –0.09 31% 45% 32% 30% 20% 28% Industry group Source: Future of Jobs Survey, World Economic Forum. Note: Relative ease of recruitment measured on a qualitative –2 (“much harder”) to +2 (“much easier”) scale. Gender wage gap refers to share of responses in the affirmative. recognize that tackling barriers to equality can unlock new opportunities for growth. Our respondents perceive a wide range of rationales for promoting workplace gender parity, varying with the specific situation of different industries (Figure 15 and Table 11). Overall, the most frequently cited reason for promoting female talent is the ethical imperative “fairness and equality”, which was chosen by 42% of respondents. Just over a fifth of companies are further motivated by a range of rationales more closely tied to the success of their business— enhancing innovation and decision-making or reflecting the gender composition of their customer base. Enhanced decision-making, enhanced innovation Across all industries, nearly one in four companies reported supporting gender parity because of an expectation that it would enhance innovation, while a similar proportion cited a related reason, enhancing decision-making.
The Energy and Media, Entertainment and Information industries find these rationales particularly appealing while the Consumer and Information and Communication Technology industries do not cite them as a strong motivating factor. Employing and promoting more women is one accessible way companies can bring more diverse voices into their decision-making and business development—allowing fresh thinking and disrupting business models from within before they are disrupted from without.23 Indeed, the dividends of those diverse voices are best reaped when inclusion is not predicated on pure assimilation.24 Similarly, companies in which women are more strongly represented at the board and at senior management levels have been shown to outperform those where they are not.25 Reflecting gender composition of the customer base There is a strong correlation between companies’ perception of the gender composition of their customer base and the gender composition of their workforce across various industries (Table 12). Of course, existence of this correlation does not in itself reveal the direction of that relationship; whether a more gender diverse workforce allows businesses to tap into the female client base by developing a distinctive value proposition or, inversely, whether businesses with more female clients recruit more women.
Some industries are substantially more focused on this rationale than others, specifically the Professional Services, Financial Services & Investors and Consumer industries. For example, on average, just over two in five respondents from the Financial Services & Investors sector emphasize reflecting their customer base as one of their main rationales for promoting gender parity. With good reason, too: globally, women controlled 64% of household spending and 30 trillion dollars of consumer spending in 2013—and this figure is predicted to rise by almost a third over the five years to 2018.26 As women’s workforce participation rises, they will gain further purchasing power through increased lifetime disposable income.
The proportion of business-toconsumer (B2C) and business-to-business (B2B) clients who are women should therefore be expected to rise, as reflected in our respondents’ projections. Most industries expect between nine and 14 percentage point growth in female B2B clients over the 2015-2020 period, particularly the Professional Services, Media, Entertainment and Information and Basic and Infrastructure sectors. Expected growth of B2C clients is lower but starting from a higher base.
The Information and Communication Technology and Mobility industries expect the highest growth in their female B2C customer base, on average around six percentage points. Expanding the talent pool and external pressures Currently, women make up the majority of those enrolled in university in nearly 100 countries. However, “expanding the talent pool” lags behind as a perceived rationale for promoting gender parity. This may be because women’s ascendance in higher education is a relatively recent phenomenon among junior cohorts of many populations and company perceptions have not kept pace with the The Future of Jobs Report | 35 .
Table 13: Women’s workforce participation, by industry Share of female workforce, % Senior roles Industry group Industries Overall CEOs Board members Current Mid-level roles Junior roles Line roles Staff roles 2020 Current 2020 Current 2020 Current 2020 Current 2020 9% 28% 15% 25% 24% 33% 33% 36% 30% 34% 35% 39% Basic and Infrastructure 2 35 9 17 13 21 22 29 14 23 20 27 Consumer 10 21 16 24 26 33 33 37 31 34 37 41 Energy 0 32 11 20 19 27 24 27 19 25 22 30 Financial Services & Investors 9 19 20 30 33 40 43 43 35 39 42 43 Healthcare 6 — 15 28 31 44 39 46 44 49 41 48 Information and Communication Technology 5 19 11 20 21 29 32 34 23 32 33 38 Media, Entertainment and Information 13 22 25 33 25 32 35 36 38 43 47 46 Mobility 9 17 13 21 21 30 28 33 25 31 34 36 Professional Services 9 23 22 34 33 40 39 43 44 44 44 46 Source: Future of Jobs Survey, World Economic Forum. Table 14: Gender Gap, by job family Relative ease of recruitment Job family Share of women Gender wage gap Architecture and Engineering 11% 27% –1.18 Current 2020 Arts, Design, Entertainment, Sports and Media 48% 12% –0.21 0.07 Business and Financial Operations 43% 30% –0.42 –0.16 Computer and Mathematical 23% 28% –0.91 –0.13 Construction and Extraction 10% 48% –1.48 –0.64 Installation and Maintenance 8% 24% –1.43 –0.20 Management 25% 34% –0.84 –0.03 Manufacturing and Production 20% 32% –0.99 –0.12 Office and Administrative 54% 36% 0.21 0.31 Sales and Related 41% 35% –0.42 –0.03 –0.27 Source: Future of Jobs Survey, World Economic Forum. Note: Relative ease of recruitment measured on a qualitative –2 (“much harder”) to +2 (“much easier”) scale. Gender wage gap refers to share of responses in the affirmative. changing reality of the composition of the talent pool around them. Employers in the Information and Communication Technology and Mobility industries nevertheless find this rationale especially convincing. In Information and Communication Technology, a sector which struggles with talent shortages, no less than 37% of companies regard enhancing women’s workforce participation as an opportunity for expanding the talent pool.
Across all industries approximately 20% of respondents also reported they were feeling external pressures to address gender imbalances, either by media scrutiny and public opinion or by government regulation. GAPS IN THE FEMALE TALENT PIPELINE While national cultures and policies shape women’s participation in national workforces, sectoral cultures and practices also play a significant role. Today’s leaders have inherited company and industry cultures in which women participate to varying degrees. Across all industries, women’s workforce participation at junior, middle and senior levels is dramatically different.
Projecting their figures for 2020, companies expect some improvement, spread unevenly across different industries. However, across 36 | The Future of Jobs Report all industries there is a narrowing female talent pipeline heading towards senior management. Having invested in women as they enter in junior positions, employers appear to frequently lose their investment by failing to retain talent up the ladder (Table 13). On average, responding CHROs predict that the gender composition of today’s junior roles will be reflected in 2020’s mid-level roles, and that the gender breakdown of today’s mid-level roles will similarly carry through to 2020’s senior roles.
Across industries, there are expectations of a 7 to 9 percentage point increase in the share of women in mid-level roles by 2020 and an 8 to 13 percentage point increase in senior roles. This suggests an expectation that the workforce strategies employed to promote gender parity will be successful in retaining and promoting the majority of incoming female talent, against past experience. The projections for industries’ gender composition for senior, middle and junior roles in 2020 build on varying proportions today. Four industries—Basic and Infrastructure, Energy, Mobility and Information and Communication Technology—currently report a particularly low overall female workforce participation: 16%, 19%, 19% and 24%, respectively (Table 12).
Additionally, these industries also . Figure 16: Gender wage gap and women’s participation, by industry Share of female employees (%) 60 High female participation Healthcare 50 Professional Services 40 Media, Entertainment and Information Financial Services & Investors Overall Average Consumer 30 Information and Communication Technology 20 Energy Mobility Basic and Infrastructure 10 Large wage gap density 0 0 10 20 30 40 50 60 Respondents reporting wage gaps (%) Source: Future of Jobs Survey, World Economic Forum. report a more dramatic drop off of female employees between junior and senior level positions. In Information and Communication Technology, women currently make up 11% of senior level roles and 32% of junior level roles. Low intake of women at the junior level translates to similar underperformance later in the pipeline. Industries that have a comparatively high proportion of women in junior positions include: Financial Services & Investors, Healthcare, Media, Entertainment and Information and Consumer. Conversely, the Information and Communication Technology, Mobility, Energy, and Basic and Infrastructure sectors recruit fewer women into junior positions. While employers in the Basic and Infrastructure industry currently recruit a mere 22% women as part of their junior level staff, employers project that they will, on average, expand that figure to 29% in 2020.
Fulfilling that prediction would see the Energy sector become the industry with the lowest proportion of women in entry level roles by 2020. However, following current predictions, Basic and Infrastructure will still remain the industry with the worst gender balance in senior roles. These numbers reveal that companies are focusing primarily on progressing women through the pipeline to avoid losing already developed or developing talent. Few industries are targeting strong increases when it comes to hiring women into junior and entry level roles. Employers in the Healthcare and Basic and Infrastructure industries are targeting a 7 percentage point increase. Mobility employers expect to improve their initial intake by 5 percentage points. The least ambitious targets for junior level hiring are in Financial Services & Investors, Media, Entertainment and Information and Information and Communication Technology.
Financial Services & Investors companies report high junior level recruitment—around 43% of their workforce at this level is female. On the other hand, Information and Communication Technology reports a 10% lower share of junior recruits, making the proportion of women at entry level 34%. The gender balance of women on boards is similar or better to the proportion of women in senior roles. At the CEO level, however, women remain profoundly underrepresented.
The breakdown of women in line and staff roles highlights some of the barriers to top level positions. Women are under-represented in line roles in Mobility, Information and Communication Technology, Energy and Basic and Infrastructure, with line roles more likely to equip women with the skills and experience that would prepare them for senior positions. On average, the Mobility, Information and Communication Technology and Media, Entertainment and Information sectors are expecting to close the gap in women’s line and staff role participation by 4 to 6 percentage points over the 2015-2020 period. Overall, the figures paint a challenging picture. Across all industries, companies reported that they found women harder to recruit.
The reported ease (or in this case, difficulty) of recruiting women is directly proportional to the existing gender composition of the industry. Persistent gender wage gaps are reported across all industries, even in industries where female participation is comparatively high (See Table 14 and Figure 16). The highest share of respondents stating that there was a wage gap in their industry is in the Consumer sector (49%), followed by Mobility, Financial Services & Investors and Basic and Infrastructure.
That is, gender wage gaps are not always directly symmetrical to the magnitude of women’s participation in the respective industry. BARRIERS TO CHANGE Our respondents’ views concerning the barriers to women’s workforce participation vary by industry and often reflect different industry cultures in addition to overarching economic and societal factors. Among overarching factors, The Future of Jobs Report | 37 . Figure 17: Significance of barriers to gender parity, industries overall Share of respondents reporting barrier, % Unconscious bias among managers 44% Lack of work-life balance 44% Lack of role models 39% Lack of qualified incoming talent 36% Women’s confidence, aspirations 31% Societal pressures 23% Unclear career paths 17% Lack of talent, leadership development for women 15% Don’t know 12% No barriers 10% Lack of parental leave 6% Source: Future of Jobs Survey, World Economic Forum. Note: Names of barriers have been abbreviated to ensure legibility. the ones most visible through the data are the dual burden of caregiving and breadwinning, unconscious biases, traditional organizational practices in the workplace, a lack of role models, confidence, and the traditional divide between women and men in STEM education. 0.0 Women have traditionally played a larger role in the 0.1 private sphere as caregivers. Today, women still on average perform a much larger share of unpaid work across countries around the world—from routine housework to childcare, the value of this labour amounts to more than 20% of GDP across most OECD countries.27 Many employers thus believe lack of work-life balance is a key deterrent to women’s participation at work. This factor thus appears to influence all industries. While in nearly all industries and geographies there has been a marked shift away from deliberate exclusion of women from the workplace, there continue to be cultural beliefs that lead to unconscious biases. This includes perceptions that successful, competent women are less “nice”; that strong performance by women is due to hard work rather than skills; and assumptions that women are less committed to their careers.28 In addition, especially in well-established, older organizations, workplace structures that were designed for a past era still, often unwittingly, favour men.
Additionally, women’s historically low participation in the labour market means they have relatively fewer role models to look towards across all industries. Research from the US, UK and Germany suggests that women have a poor perception of senior roles and lack a clear line of sight as to how senior leadership positions might help them achieve their objectives, lacking role models who can reveal the trade-offs and benefits they 38 | The Future of Jobs Report bring.29 Women’s confidence and aspirations are seen as another barrier. Women are less likely to want a top job— citing the stress or pressure of the role as a deterrent.30 An often cited barrier is a lack of qualified incoming female talent in specific fields, especially in STEM education, 0.2 0.3 0.4 where women currently make up only 32% graduates across the world.31 Finally, where each industry stands specifically is often affected by how recently an industry has improved its gender balance. Given that career choices are disproportionately affected by prior experience and bias, traditionally male dominated professions often find it difficult to attract women. Across all industries, unconscious bias among managers and lack of work-life balance are cited as the two top barriers to women’s workforce integration over the 2015–2020 period.
The proportion of employers reporting these two factors as their main concern is equal—44% for each. Around 36% of respondents also voiced a concern about the availability of qualified talent, in particular employers in the Energy, Information and Communication Technology and Mobility industries. This is reflected in their low estimate of the current share of female junior staff, at 24%, 32% and 28%, respectively (Figure 17).
The Information and Communication Technology industry sees this issue as their main barrier to a more gender balanced workforce. Basic and Infrastructure has a similarly low number of female junior staff, but there is less emphasis by respondents on incoming talent qualification, with unconscious bias by managers instead cited as the top concern. Financial Services & Investors and Professional Services place more emphasis on women’s own aspirations as a barrier, with Professional Services seeing it as the 0.5 .
Table 15: Significance of barriers to gender parity, by industry Share of respondents reporting barrier, % BAS CON EN FS HE ICT MEI MOB PS OVERALL Unconscious bias among managers 50 55 70 37 50 47 46 33 42 44 Lack of work-life balance 42 70 30 53 20 47 54 54 42 44 Lack of role models 44 40 55 47 50 37 31 50 31 39 Lack of qualified incoming talent 33 15 60 20 40 57 15 63 36 36 Women's confidence, aspirations 28 30 10 43 10 37 31 29 50 31 Societal pressures 22 25 25 17 20 17 15 33 39 23 Unclear career paths 31 30 5 20 10 20 23 4 14 17 Lack of talent, leadership development for women 17 0 10 23 20 27 8 13 14 15 Don't know 6 20 15 13 30 7 31 4 17 12 No barriers 6 10 15 13 20 7 23 4 14 10 Lack of parental leave 17 5 0 7 20 0 0 13 0 6 No strategy 0 0 0 3 0 0 0 0 0 0 Barrier Source: Future of Jobs Survey, World Economic Forum. Note: Names of barriers have been abbreviated to ensure legibility. main limiting factor for promoting women’s talent. Lack of work-life balance is perceived as a particular barrier in the Consumer and Financial Services & Investors industries. By contrast, few sectors cited lack of parental leave as an issue (Table 15). WOMEN AND WORK IN THE FOURTH INDUSTRIAL REVOLUTION As the Fourth Industrial Revolution takes hold in different industries and job families, it will affect female and male workers and the dynamics of the industry gender gap in manifold ways. By their very nature, many of the current expected drivers of change have the potential to enable the narrowing of industry gender gaps.
Household work could be further automated, relieving some of the current dual burden and allowing women to put their skills to use in the formal economy. Changes to what have traditionally been men’s roles in the workforce will also reshape the division of labour at home. Similarly, many respondents and industry observers agree on the need to rethink work, taking a holistic approach to workforce planning.
Shaping the new and emerging landscape of flexible working presents an unprecedented opportunity to rebalance the gender divide, for example by providing companies with a chance to explore results-driven rather than presence-driven role evaluation. Harnessed well, the emergence of new flexible working patterns and other similar trends could result in a more gender balanced workplace.32 However, as disruptive change is coming to business models, jobs are displaced and a new labour market materializes out of the vestiges of the old, there is also a risk that these trends and drivers of change might sustain or worsen other existing gendered inequalities.33 At the declining end of the labour market, the drivers of change identified by our respondents will heavily disrupt some of the job families with the largest share of female employees, such as Office and Administrative roles, but also some of those with the largest traditional gender gap, such as Manufacturing and Production. From a net employment outlook perspective—by simply translating job families’ reported current gender composition (Table 14) to the expected absolute job gains and losses over the 2015–2020 period calculated in the previous chapter (Figure 6)—we find that the burden of expected job losses due to disruptive change falls almost equally on women and men: 2.45 million (48%) of the expected total net job loss of 5.1 million falls on women, 2.65 million (52%) of it on men. That, in itself, indicates widening gender gaps in the workforce, as women make up a smaller share of the overall labour force.
In absolute terms, men will face nearly 4 million job losses and 1.4 million gains, approximately one job gained for every three jobs lost, whereas women will face 3 million job losses and only 0.55 million gains, more than five jobs lost for every job gained. On current trends and predictions, men will lose more than 1.7 million jobs across the Manufacturing and Production and Construction and Extraction job families, but are set to gain over 600,000 jobs in Architecture and Engineering and Computer and Mathematical functions. Women will only lose 0.37 million jobs in these two male-dominated job families but are set to gain little more than 100,000 jobs in Architecture and Engineering and Computer and Mathematical functions if current gender gap ratios persist over the 2015–2020 period—nearly one new STEM job per four jobs lost for The Future of Jobs Report | 39 .
Figure 18: Significance of strategies for women’s workforce integration, industries overall Share of respondents pursuing strategy, % Promote work-life balance 38% Set targets and measure progress 33% Development and leadership training of women 32% Demonstrate leadership commitment 30% Build awareness of the benefits among managers 29% Offer, support flexible work 28% Transparent career paths, salary structures 19% Support women’s integration into the value chain 17% Source: Future of Jobs Survey, World Economic Forum. Note: Names of strategies have been abbreviated to ensure legibility. men, but only one new STEM job per 20 jobs lost for women. The conclusion is clear. If current industry gender gap trends persist and labour market transformation towards new and emerging roles in computer, technology and engineering-related fields continues to outpace the rate at which women are currently entering those types of jobs, women are at risk of losing out on tomorrow’s best job opportunities while aggravating hiring processes for companies due to a restricted applicant pool and reducing the diversity dividend within the company. However—while substantially more effort will be 0.00 0.05 needed—our data contains some encouraging signs that 0.10 current trends need not continue. As traditionally maledominated job families take on newfound importance and applications in industries that previously housed few such roles but have a strong track record of employing, retaining and leveraging female talent, the current culture may drive future recruitment efforts in new roles. However more deliberate efforts will also be needed to meet talent needs and address gender gaps.
As demand for talent in Architecture and Engineering and Computer and Mathematical fields—with poor gender balance—grows, governments, individuals and companies will need to ensure that the full talent pool of men and women is educated, recruited and promoted. APPROACHES TO LEVERAGING FEMALE TALENT The Report’s findings confirm that targeting female talent is a strategy that is particularly characteristic of those companies that prioritize future workforce planning and change management and that are confident that they are on the right track in their approach to preparing for impending disruptive change. In order to leverage the benefits of gender diversity, companies need to take a holistic approach, starting at the top. Actively managing talent rather than passive commitment has been shown to lead to better returns. While some of the transformations in corporate practices 40 | The Future of Jobs Report and public policies will entail adaptation in the short term by families, companies and the public sector, in the long term, the subsequent expansion of opportunities for women has the potential to transform the economies, societies and demographics of countries as a whole. It is important to emphasize that these interventions do not work as a checklist of actions that will each independently produce results. Flexibility in the workplace is, alone, not enough to guarantee improving gender equality. It must be accompanied by a holistic set of priorities and long-term commitments, and by a deep understanding of the corporate, industry, and cultural context, as well as the 0.15 0.20 0.25 0.30 0.35 0.40 organizational culture and local policy environment. The World Economic Forum’s online Repository of Successful Practices for Gender Parity pools information on the practices that have been successfully used in leading companies worldwide to close gender gaps at the company level, as well as along the companies’ supply chain and surrounding communities.34 The repository suggests six dimensions around which to focus an organization’s gender parity efforts. • Measurement and target setting: Achievable, relevant recruitment and retention targets at all levels, with an embedded accountability mechanism, are critical.
Developing a disaggregated database can help to evaluate the causes of gender imbalances and track progress. Transparent salary bands to track and address male and female salary gaps are additional useful tools to understand the status quo in organizations. • Mentorship and training: Companies have benefitted from programmes that promote guidelines on the value of diversity as an underlying culture of the organization, and impart knowledge on how to manage a more diverse workforce and how to attract, retain and promote female talent. These training programmes, for both men and women, can be relevant for shaping an environment within the broader employee base for women to successfully lead.
In addition, many . Table 16: Significance of strategies for women’s workforce integration, by industry Share of respondents pursuing strategy, % BAS CON EN FS HE ICT MEI MOB PS OVERALL Promote work-life balance 32 50 15 43 10 40 46 63 47 38 Set targets and measure progress 46 30 40 33 50 37 23 21 36 33 Development and leadership training of women 35 45 35 30 30 33 23 42 31 32 Demonstrate leadership commitment 27 25 45 37 30 30 15 29 36 30 Build awareness of the benefits among managers 41 40 30 20 40 33 31 25 25 29 Offer, support flexible work 24 25 25 43 40 30 31 17 36 28 Transparent career paths, salary structures 5 30 25 23 0 37 23 29 8 19 Support women's integration into the value chain 11 25 25 17 30 20 15 21 14 17 Don't know 19 10 10 13 20 10 23 13 17 14 No strategy 22 5 15 20 10 7 15 8 14 13 Create incentives and accountability 8 0 0 7 10 3 15 8 3 5 Subsidize childcare 3 0 10 7 0 3 0 13 8 5 Offer parental leave 3 0 0 3 20 10 8 4 6 5 Promote gender parity through customer outreach 3 10 5 3 0 0 15 0 3 3 Support parents' reintegration after leave 3 0 5 0 0 3 0 4 8 3 Philanthropic and social responsibility efforts 0 0 10 0 0 3 0 4 3 2 Subsidize eldercare 0 0 0 0 0 0 0 0 3 0 Strategies Source: Future of Jobs Survey, World Economic Forum. Note: Names of strategies have been abbreviated to ensure legibility. • • companies have formal mentoring schemes for women seeking leadership positions, although they also find that high-potential women lack the sponsorship and tailored training needed to move into the executive ranks. A repositioning of the human resources function beyond a focus on systems and administration to talent development and training can help address specific roadblocks for women, in addition to better overall talent management. Awareness and accountability: The focus of many companies on building awareness indicates that the case for change still needs to be built to make progress. Accountability of the senior management and transparency of career paths and opportunities have proven to be effective practices. Ensuring that management policies, processes, systems and tools do not harbour gender-based discrimination, as well as enhancing the understanding of unconscious biases can, also make inclusive leadership more tangible. Work environment and work-life balance: Women are often the primary caregiver for both children and the elderly in most countries.
Ensuring smooth on- and • • off-ramping and appropriate childcare options, and developing guidelines on implementation of worklife balance policies and mentoring for women going through a transition are important levers to ensure a sustained career progression towards management. For those companies that already offer parental leave, flexible working hours and other work-life balance programmes, the next steps lie in accelerating their use and acceptance by female and male employees. Leadership and company commitment: Visible leadership by the chief executive and top management on supporting women in management has proven to be one of the most important levers for progress in achieving gender diversity in a corporate context. This includes concrete and symbolic actions by top management and, in many cases, establishment of a position or department to lead diversity efforts. Regular communications by senior management on gender equality have been found to be critical. Responsibility beyond the office: Many companies have leveraged the opportunity to exercise external influence along the value chain, including diversity The Future of Jobs Report | 41 . Box 3: Anticipating the Future of Jobs: Human Capital and Gender Parity in the Oil and Gas Industry In many industries there is a growing scope for collaboration rather than competition to address talent challenges. For example, several human capital challenges in the Oil and Gas sector are directly linked to the cyclical nature of the industry and others, primarily those that affect long-term horizons, are associated with a shortage of qualified employees, a lack of experienced mid-tenure employees, and the need to foster technological innovation. Over this long-term context, the Oil and Gas industry broadly faces obstacles in recruiting workready technical engineers and in developing, attracting and retaining female talent. In order to continue to serve the world’s growing energy needs while improving opportunities for youth in emerging markets and for women, leaders of the Oil and Gas community aim to address these challenges collectively. Given the long-term talent needs and skills gaps in the industry, the Forum’s industry project in this space aims to develop demand-driven criteria for educational institutions working with leading companies in the sector.
The first objective is to produce an industry-endorsed standard curriculum that aims at bridging the gap in training of petroleum engineers across geographies. The curriculum focuses on engineering fundamental knowledge such as mathematics and geology but also non-engineering skills such as project management, finance and communication. In order to prioritize certain regions or countries, the Future of Jobs project’s insights will be used to identify critical skills gaps based on industry needs.
The World Economic Forum will then play a facilitator role bringing together the industry and relevant universities and ministries in order to move forward the common dialogue. The Forum’s analysis illustrates that the Oil and Gas industry, despite on-going efforts in the field of diversity and inclusion, continues to miss out on the diversity dividend, with participation of women in the workforce still lagging behind other training for suppliers, distributors and partners and training to support women-owned businesses in the organization’s value chain. External influence can also be exercised by ensuring gender neutrality in advertising, engaging girls and young women to display possible career paths and developing partnerships with gender parity-focused civil society and public sector initiatives. Beyond individual company practices and challenges, it is clear that there are specific and common gender gap challenges within industries. This is thus an area ripe for intra-industry collaboration and for improved public-private collaboration, to balance both public and business interest. Such collaborations and partnerships are currently relatively rare but there are emerging experiments that indicate the greater efficiency for business and improved societal outcomes are possible through such approaches. The moral case for gender equality has, in the most part, been won.
The business and economic case is also increasingly understood. The Fourth Industrial Revolution now presents an unprecedented opportunity to place women’s equal participation in the workplace at the heart of preparations for the shifts to come. 42 | The Future of Jobs Report major industries. In order to increase efforts to tackle these persistent gender gaps along the Oil and Gas talent pipeline, major players from the industry are also coming together to collectively address contextual and industry-specific factors contributing to these gaps.
Alongside a straightforward desire from many in the sector to create a more diverse workforce, interviews with Oil and Gas executives suggest they also believe that taking advantage of this huge potential talent pool is a critical business objective. Skills gaps and the looming retirement of experienced engineers and technical talent currently present in the Oil and Gas workforce mean that companies need increasingly to look elsewhere to find the talent and knowledge they require. The group looked specifically at data on gender gaps at junior, middle, senior, board and CEO levels. A Call to Action is currently being developed that aims to state the group’s vision and demonstrate the practices major players’ will undertake to advance gender parity.
The declaration includes a set of guiding principles that will underpin the industry’s efforts on gender parity, such as: ensuring visible leadership on gender parity and company commitment at all levels; promoting gender sensitive recruitment, retention and promotion policies and setting challenging but achievable goals for gender diversity. This Call to Action will also serve as a platform to help Oil and Gas business leaders, their companies, owners and shareholders around the world address the factors contributing to the gender gap. Members of the Oil and Gas community also encourage companies to share best practices, creating an opportunity to learn from and build upon successful interventions for the benefit of the entire industry.
This pilot project points to collaborative mechanisms that can be applied across other industries, in partnership with governments and educational institutions. . Endnotes 1 McLeod, Scott and Karl Fisch, “Shift Happens”, https://shifthappens. wikispaces.com. 2 The structure of our survey means the base sample—the unique data points that can be used for our analysis—commonly refers to these 1,346 occupation-level responses, although in some cases it is restricted to the 371 company-level responses. For details on our survey design, or any of the other points discussed in this section, please refer to Appendix A: Report Methodology. 3 Please refer to: www.onetonline.org. 4 See Autor, D., 2013. 5 A recent World Economic Forum report, in collaboration with the Global Agenda Council on the Future of Software and Society, found that a significant number of disruptive technological changes are expected to reach a‑in the early years of the next decade, with the earliest expected to fully take hold by 2018 and the latest by 2027 (see: “Deep Shift: Technology Tipping Points and Societal Impact”). 6 See, for example: Pew Research Centre, Key Insights: Expert Views on Artificial Intelligence, Robotics, and the Future of Jobs, 2014. 7 Estimated employment effects have been converted into compound growth rates for the 2015–2020 period, i.e. the mean growth rate over the specified period of time if employment had grown or declined at a steady rate, which is unlikely to be the pattern observed in reality. A compound growth rate can be thought of as a way to smooth out a rate of change so that it may be more easily understood (for details, see Appendix A: Report Methodology). 8 For details of our net employment estimation, please see Appendix A: Report Methodology. 9 Source: International Labour Organization, World Employment and Social Outlook - Trends 2015, www.ilo.org/global/about-the-ilo/ newsroom/news/WCMS_336884/lang--en/index.htm. 10 For a fuller discussion of the coverage and representativeness of our perception survey-based data, please refer to Appendix A: Report Methodology. 11 See, for example: Chui, Michael, James Manyika and Mehdi Miremadi, “Four fundamentals of workplace automation,” McKinsey Quarterly, November 2015; and Cognizant, The Robot and I: How New Digital Technologies Are Making Smart People and Businesses Smarter by Automating Rote Work, Cognizant Center for the Future of Work, 2015. 12 See: Infosys, Amplifying human potential: Education and skills for the fourth industrial revolution, 2016. 13 McLeod, Scott and Karl Fisch, “Shift Happens”, https://shifthappens. wikispaces.com. 14 Bessen, James, “Employers Aren’t Just Whining – the “Skills Gap” Is Real”, Harvard Business Review, 14 August 25, https://hbr. org/2014/08/employers-arent-just-whining-the-skills-gap-is-real. 18 See: ManpowerGroup, Teachable Fit: A New Approach to Easing the Talent Mismatch, 2010, http://www.manpowergroup.com/ sustainability/teachable-fit-inside.html. 19 See: World Economic Forum and the Global Agenda Council on Employment, Matching Skills and Labour Market Needs: Building Social Partnerships for Better Skills and Better Jobs, 2014. 20 See: Gvaramadze, 2010, and Voss, 2009. 21 See: World Economic Forum, Disrupting Unemployment: Business-led Solutions for Action, 2015. 22 World Economic Forum, Global Gender Gap Report, 2015. 23 See, for example: Page, S., The Difference: How the Power of Diversity Creates Better Groups, Firms, Schools, and Societies, 2007. 24 See, for example: Deloitte, Global Human Capital Trends 2014: Engaging the 21st Century Workforce, 2014.
However, the kind of diversity women bring to teams today and in the future can be debated. Existing research suggests women are seen as more collaborative and flexible, while men are more results-orientated and have more invested in topic expertise. These characteristics mirror the roles that are socially encouraged for men and women today.
It might be misplaced to infer flexibility and team cohesion are the indefinite quality to women’s contribution to the diversity of opinions; it might be that when traditional workplace roles for men and women are disrupted, current polarizations cease to hold true. 25 Department for Business, Innovation and Skills, Women on Boards, 2011. 26 See: Catalyst, Buying Power: Global Women, 2015, www.catalyst.org/ knowledge/buying-power-global-women, and Silverstein, M. and K. Sayre, “The Female Economy”, Harvard Business Review, September 2009. 27 OECD, “Cooking and Caring, Building and Repairing: Unpaid Work around the World”, in Society at a Glance 2011: OECD Social Indicators, 2011. 28 McKinsey & Company, Women in the Workplace, 2015. 29 Centre for Talent Innovation, Women Want Five Things, 2014. 30 Ibid. 31 Source: UNESCO Institute for Statistics (UIS) database (September 2015); calculated from percentage of tertiary-level STEM graduates (female, male). 32 See: Mercer, When Women Thrive Businesses Thrive, 2014. 33 Voss, G., “The Second Shift in the Second Machine Age: Automation, Gender and the Future of Work”, in Our Work Here is Done: Visions of a Robot Economy, NESTA, 2014. 34 See: www.weforum.org/gender-parity/closing-gender-gap. 15 Our empirical analysis of the O*NET Content Model found that the core skill set of most occupations consists of a range of combinations of these 35 core skills and abilities, in addition to occupation-specific specialist knowledge. Note that, unlike for occupations, a widely agreed or internationally comparable definition or taxonomy of the term ‘skills’ does not exist (see, for example: European Training Foundation Anticipating and Matching Skills Demand and Supply: Synthesis of National Reports, 2012).
For details of the Report’s adaption of O*NET’s work-relevant core skills please refer to Appendix A: Report Methodology. 16 For details of the methodology used in this section, please refer to Appendix A. 17 Also see: World Economic Forum and the Global Agenda Council on Employment, Matching Skills and Labour Market Needs: Building Social Partnerships for Better Skills and Better Jobs, 2014. The Future of Jobs Report | 43 . . References and Further Reading DRIVERS OF CHANGE, TRENDS AND DISRUPTIONS Annunziata, M. and S. Biller, The Future of Work, GE Discussion Paper, General Electric, 2014. Bessen, J., “Toil and Technology: Innovative technology is displacing workers to new jobs rather than replacing them entirely”, IMF Finance and Development Magazine, March 2015. Pew Research Centre, Key Insights: Expert Views on Artificial Intelligence, Robotics, and the Future of Jobs, 2014. PwC, The Future of Work: A Journey to 2022 & Global Megatrends, 2014, http://www.pwc.com/gx/en/issues/megatrends/index.jhtml. Salazar-Xirinachs, J.M. Trends and disruptions and their implications for the Future of Jobs, Discussion Paper, 2014. Boston Consulting Group, Man and Machine in Industry 4.0: How Will Technology Transform the Industrial Workforce Through 2025?, 2015. Silverstein, M.
and K. Sayre, “The Female Economy”, Harvard Business Review, September 2009. Brynjolfsson, E. and A.
McAfee, The Second Machine Age: Work, Progress, and Prosperity in a Time of Brilliant Technologies, 2014. Stewart, I., D. De and A. Cole, Technology and people: The great jobcreating machine: Deloitte Discussion Paper, December 2014. Burrow, S., “How will climate change affect jobs?”, Forum Agenda Blog, December 2015. Talwar, R.
and T. Hancock, The shape of jobs to come: Possible New Careers Emerging from Advances in Science and Technology (20102030), Fast Future Research, 2010. Cappelli, P. and J.
Keller, “Classifying Work in the New Economy”, Academy of Management, vol. 38, no. 4, 2013, pp.
575–596. Catalyst, Buying Power: Global Women, 2015. Christensen, C., M. Raynor and R. McDonald, “What is Disruptive Innovation?”, Harvard Business Review, December 2015, pp.
44-53. Citi, “Technology at Work: The Future of Innovation and Employment”, Citi GPS: Global Perspectives & Solutions, February 2015. Frey, C. and M. Osborne, The Future of Employment: How Susceptible are Jobs to Computerisation? Oxford Martin School Programme on the Impacts of Future Technology, September 2013. GE Reports and The Economist, “Infographic: No seriously, wearables will be a thing - How this fast-growing sector will change the way we work”, GE Look Ahead, 2014. IndustriALL Global Union, Industry 4.0 the industrial revolution happening now, 4 December 2015, www.industriall-union.org/industry-40-theindustrial-revolution-happening-now. Institut der deutschen Wirtschaft Köln, “The Effects of Digitalization on Employment – First Impressions from the IW Human Resources Panel”, IW-Trends 3/2015 (in German). International Labour Organisation (ILO), World Economic and Social Outlook 2015, 2015. Karabarbounis, L.
and B. Neiman, The Global Decline of the Labour Share, NBER Working Paper 19136, National Bureau of Economic Research, 2013. TATA Consultancy Services, Workplace of the Future: A View from European Youth, 2014. The Economist Intelligence Unit, Automated, creative & dispersed: The Future of Work in the 21st Century, 2015. The Economist, “Special Report: The Third Great Wave”, 2014. The Financial Times, “World will have 13 ‘super-aged’ nations by 2020”, 6 August 2014, http://www.ft.com/cms/s/0/f356f8a0-1d8c-11e4-8f0c00144feabdc0.html. World Economic Forum, The Human Capital Report 2015, 2015. World Economic Forum Global Agenda Council on the Future of Software and Society, Deep Shift: Technology Tipping Points and Societal Impact, World Economic Forum Global Agenda Council White Paper, 2015. INDUSTRY AND REGIONAL FOCUS Annunziata, M. and R.
Rostom, Mapping the Future of Work in MENAT, General Electric, 2014. Committee for Economic Development of Australia, Australia’s Future Workforce?, 2015. EY, Fuelling the next generation: A study of the UK upstream oil and gas workforce, 2014. ManpowerGroup, Entering the Human Age, 2013. European Commission, “EU employment in a global context: where will new jobs come from and what will they look like?”, Employment and Social Developments in Europe 2013, 2014, http://ec.europa.eu/social/main. jsp?catId=738&langId=en&pubId=7684&visible=1. McKinsey Global Institute, Disruptive technologies: Advances that will transform life, business, and the global economy, 2013. Freelancer’s Union and Upwork, Freelancing in America: A National Survey of the New Workforce, 2015. McKinsey Quarterly, Manager and machine: The new leadership equation, 2014. Government of Ireland, Expert Group on Future Skills Needs, Reports on Future Skills Requirements, various sectors, 2008-2013. Mishel, L, H. Shierholz and J. Schmitt, Don’t Blame the Robots: Assessing the Job Polarization Explanation of Growing Wage Inequality, Economic Policy Institute and Center for Economic Policy Research Working Paper, 2013. Institute for the Future, The Future of California’s Workforce, 2012. Keynes, J.M.
Economic Possibilities for our Grandchildren, 1930. Mokyr, J, C. Vickers and N. Ziebarth, “The History of Technological Anxiety and the Future of Economic Growth: Is This Time Different?”, Journal of Economic Perspectives, vol.
29, no. 3, Summer 2015, pp. 31–50. Mandel, M.
“Where are the Big Data Jobs?”, Progressive Policy Institute, 2014. — —, Where the Jobs Are: The App Economy, TechNet, 2012. — McKinsey Global Institute, Help wanted: The Future of Work in Advanced Economies: Discussion Paper, 2012. O’Connor, S., “The human cloud: A new world of work”, Financial Times, 8 October 2015. — —, India’s technology opportunity: Transforming work, empowering — people, 2014. Organisation for Economic Co-operation and Development (OECD), Jobs Quality, Directorate for Employment, Labour and Social Affairs – Employment, Labour and Social Affairs Committee, 16-17 October 2014. National Skill Development Corporation of India, Human Resource and Skill Requirements for 2022 Sector Reports, various sectors, 2014, http:// www.nsdcindia.org/nsdcreports. UK Commission for Employment and Skills, Careers of the Future, Evidence Report 89, 2014. The Future of Jobs Report | 45 . — —, The Future of Work: Jobs and skills in 2030, Evidence Report 84, — 2014. . US Bureau of Labor Statistics, Employment Projections 2012-2022, 2013. Ely, R., Ibarra, H. and D. Kolb, “Taking Gender Into Account: Theory and Design for Women’s Leadership Development Programs”, INSEAD Working Paper, 2011. World Economic Forum, Industry Transformation Briefings, various sectors [see Appendix B], 2014. Institut der deutschen Wirtschaft Köln, “Fachkräfteengpässe in Unternehmen: Geschlechterunterschiede in Engpassberufen”, Studie 2/2015 (in German). SKILL SETS OF THE FUTURE International Labour Organization (ILO), “The Gender Divide in Skills Development: Progress, Challenges and Policy Options for Empowering Women”, Skills for Employment Policy Brief, 2014. Anderson, C.
and J. Gantz, Skills Requirements for Tomorrow’s Best Jobs: Helping Educators Provide Students with Skills and Tools They Need, IDC Opinion, October 2013. Autor, D., The “Task Approach” to Labor Markets: An Overview, IZA Discussion Paper No. 7178, 2013. — —, The Polarization of Job Opportunities in the U.S.
Labor Market: — Implications for Employment and Earnings, Center for American Progress and The Hamilton Project, 2010. Autor, D, F. Levy and R. Murnane, “The Skill Content of Recent Technological Change: An Empirical Exploration”, Quarterly Journal of Economics, vol.
118, no. 4, 2003, pp. 1,279-1,333. Burning Glass Technologies, Crunched by the Numbers: The Digital Skills Gap in the Workforce, 2015. Cappelli, P.
Skill Gaps, Skill Shortages and Skill Mismatches: Evidence and Arguments for the US, NBER Working Paper 20382, National Bureau of Economic Research, 2014. Deming, D., The Growing Importance of Social Skills in the Labor Market, NBER Working Paper 21473, National Bureau of Economic Research, 2015. European Centre for the Development of Vocational Training (CEDEFOP), Piloting a European Employer Survey on Skill Needs: Illustrative Findings, CEDEFOP Research Paper No. 36, 2013. — —, Quantifying Skills Needs in Europe – Occupational Skills Profiles: — Methodology and Application, CEDEFOP Research Paper No. 30, 2013. — —, Skills supply and demand in Europe: Medium-term forecast up to — 2020, 2010. Infosys, Amplifying human potential: Education and skills for the fourth industrial revolution, 2016. Institute for the Future and the University of Phoenix, Future Work Skills 2020, 2011. International Labour Organisation (ILO) and the European Union, Research Brief: Anticipating skills needs for the low carbon economy? Difficult, but not impossible, 2012. ILO and the CEDEFOP, Skills for Green Jobs: A Global View – Synthesis Report Based on 21 Country Studies, 2011. Katz, L.
and R. Margo, Technical Change and the Relative Demand for Skilled Labour: The United States in Historical Perspective, NBER Working Paper 18752, National Bureau of Economic Research, 2013. NESTA, Creativity vs Robots: The Creative Economy and the Future of Employment, 2015. — —, Skills of the Datavores: Talent and the Data Revolution, 2015. — Organisation for Economic Co-operation and Development (OECD), “Skills and Jobs in the Internet Economy”, OECD Digital Economy Papers No. 242, 2014. — —, OECD Skills Outlook 2013: First Results from the Survey of Adult — Skills, 2013. The Economist Intelligence Unit, Changing roles: How technology is transforming business functions, 2015. Kaplan, J., “The Age of the Robot Worker Will Be Worse for Men: The jobs that are least vulnerable to automation tend to be held by women”, The Atlantic Magazine, 2015. Lewis, C., “Women and Jobs in the Robot Economy”, RobotEnomics Blog, 2014, http://robotenomics.com/2014/01/03/women-and-jobs-in-therobot-economy. McKinsey & Company, Women in the Workplace, 2015. OECD, “Cooking and Caring, Building and Repairing: Unpaid Work around the World”, in Society at a Glance 2011: OECD Social Indicators, 2011. Voss, G., “The Second Shift in the Second Machine Age: Automation, Gender and the Future of Work” in Our Work Here is Done: Visions of a Robot Economy, NESTA, 2014. CHANGE MANAGEMENT AND FUTURE WORKFORCE PLANNING Accenture, Burning Glass Technologies and Harvard Business School, Bridge the Gap: Re-Building America’s Middle Skills, 2015. Arias, O., “Are skills really a panacea for unemployment?”, Forum Agenda Blog, 2014. Boston Consulting Group and the International Confederation of Private Employment Services (CIETT), Adapting to Change: How private employment services facilitate adaptation to change, better labour markets and decent work, 2014. Cognizant, The Robot and I: How New Digital Technologies Are Making Smart People and Businesses Smarter by Automating Rote Work, Cognizant Center for the Future of Work, 2015. Deloitte, Global Human Capital Trends 2015: Leading in the new world of work, 2015. — —, Global Human Capital Trends 2014: Engaging the 21st Century — Workforce, 2014. Department for Work and Pensions, “A New Vision for Older Workers: Retain, Retrain, Recruit”, report to Government by the Business Champion for Older Workers, United Kingdom, 2015. Everis, Preparing for the digitisation of the workforce, The Economist Intelligence Unit, 2015. Federal Ministry of Education and Research and the National Academy of Science and Engineering, Securing the future of German manufacturing industry: Recommendations for implementing the strategic initiative INDUSTRIE 4.0, final report of the Industrie 4.0 Working Group, 2013. Federal Ministry of Labour and Social Affairs, Arbeit Weiter Denken: Grünbuch Arbeiten 4.0, 2015 (in German). Freeman, R., “Who owns the robots rules the world: Workers can benefit from technology that substitutes robots or other machines for their work by owning part of the capital that replaces them”, IZA World of Labor, vol. 2014, no.
5, 2014. World Economic Forum Global Agenda Council on Ageing, How 21st-Century Longevity Can Create Markets and Drive Economic Growth, World Economic Forum Global Agenda Council White Paper, 2015. IMPLICATIONS FOR GENDER PARITY Graber, S., “It’s Not HR’s Job to Be Strategic”, HBR Blog Network, 2014. Black, S. and A. Spitz-Oener, “Explaining Women’s Success: Technological Change and the Skill Content of Women’s Work”, The Review of Economics and Statistics, vol.
92, no. 1, 2010, pp. 187-194. Gratton, L.
Adapting to the Future of HR: 3 Trends to Watch, Hot Spots Movement, 2015. Centre for Talent Innovation, Women Want Five Things, 2014. Deming, D., The Growing Importance of Social Skills in the Labor Market, NBER Working Paper 21473, National Bureau of Economic Research, 2015. Department for Business, Innovation and Skills, Women on Boards, 2011. 46 | The Future of Jobs Report Gvaramadze, I., “Low-skilled workers and adult vocational skills-upgrading strategies in Denmark and South Korea”, Journal of Vocational Education and Training, vol. 62, no. 1, 2010, pp.
51-61. ILO, A Skilled Workforce for Strong, Sustainable and Balanced Growth: A G20 Training Strategy; PART I: Global drivers of change: opportunities and challenges for training and skills development, 2010. . Janah, L., Labor looks different in the 21st century – so should job training”, Quartz, 2015, http://qz.com/496297/us-job-training-must-catch-up-tothe-work-the-labor-force-will-do. Jeon, S. “Enhancing Employment for Women, Youth and Older Workers: Why Skills Strategies Matter”, in, Global Talent Competitiveness Index 2014, edited by B. Lanvin and P. Evans, pp.
65–74, 2015. KPMG, Turn Silver Grey into Gold: Empowering Companies and Organisations to tackle the Ageing Workforce Challenge, 2011. Laurenceau, C. and C. Sloman, Being digital: Embrace the future of work and your people will embrace it with you, Accenture Strategy, 2015. World Economic Forum, Disrupting Unemployment: Business-led Solutions for Action, 2015. — —, Education and Skills 2.0: New Targets and Innovative Approaches, — 2014. — —, Industrial Internet: Unleashing the Business and Socioeconomic — Potential of Connected Products and Services, 2015. World Economic Forum and the Global Agenda Council on Employment, Matching Skills and Labour Market Needs: Building Social Partnerships for Better Skills and Better Jobs, 2014. Lindzon, J., “Welcome to the New Era of Human Resources – The Function of Human Resources Departments has Remained the Same for Over 100 Years.
That’s all About to Change”, FastCompany Magazine, 2015. Lippman, L., Ryberg, R., Carney, R. and K. Moore, Workforce Connections: Key “Soft Skills” that foster Youth Workforce Success: Toward a Consensus Across Fields, June 2015. Littler Mendelson, “The Transformation of the Workplace Through Robotics, Artificial Intelligence, and Automation: Employment and Labour Law Issues, Solutions, and the Legislative and Regulatory Response”, The Littler Report, 2014. ManpowerGroup, Seven Steps to Conscious Inclusion: A Practical Guide to Accelerating More Women Into Leadership, 2015. — —, Teachable Fit: A New Approach to Easing the Talent Mismatch, 2010, — http://www.manpowergroup.com/sustainability/teachable-fit-inside. html. McKinsey Global Institute, A Labor Market that Works: Connecting Talent with Opportunity in the Digital Age, 2015. — —, Building capabilities for performance, 2014. — Mercer, When Women Thrive, Businesses Thrive, 2014. NESTA, Building the Digital Talent Pipeline: The Business Benefits and How to Get Involved, 2015. North, M.
and H. Hershfield, “Four Ways to Adapt to an Aging Workforce”, Harvard Business Review, 2014. Oxford Economics, Global Talent 2021: How the new geography of talent will transform human resource strategies, 2012. Oxford Economics and SAP, Workforce 2020 – Research Report and Country Fact Sheets, 2014. Page, S., The Difference: How the Power of Diversity Creates Better Groups, Firms, Schools, and Societies, 2007. PwC, 17th Annual Global CEO Survey: The talent challenge, 2014. Ryder, G., “How can we create decent jobs in the digital age?”, Forum Agenda Blog, 2015. Shapiro, H., “Emerging Skills, Knowledge & Competencies for the HRST Workforce – Do Higher Education Systems Get It Right?”, contribution to the Innovation Union, DG Research, 2013. SHRM Foundation, “Engaging and Integrating a Global Workforce”, The Economist Intelligence Unit, 2015. Strack, R, J. Baier, and A.
Fahlander, “Managing Demographic Risk”, Harvard Business Review, 2008. The B Team and Virgin Unite, New Ways of Working, 2015. The Economist, Over the horizon: Three issues that should preoccupy managers in the next 50 years, 6 September 2014. The Economist Intelligence Unit, Working in The Future, research report sponsored by Fujitsu, 2015. Tyson, L. and L. Mendonca, “Worker Protection in the Gig Economy”, Project Syndicate, November 2015. UNI Global Union, Including You In a New World of Work: Background Paper, 2014. Unum, The Future Workplace: Key trends that will affect employee wellbeing and how to prepare for them today, 2014. Voss, E., “Organising Transitions in Response to Restructuring: Study on instruments and schemes of job and professional transition and re-conversion at national, sectoral or regional level in the EU”, Final Report, European Commission, 2009. West, D., What happens if robots take the jobs? The impact of emerging technologies on employment and public policy, Brookings Center for Technology Innovation, 2015. The Future of Jobs Report | 47 .
. Appendix A: Report Methodology RESEARCH FRAMEWORK AND SURVEY DESIGN The analysis that forms the basis of this Report is the result of an extensive survey of Chief Human Resources and Chief Strategy Officers of leading global employers, and consists of four interrelated parts, providing a uniquely flexible dataset that can be recombined in various ways to obtain further specific insights into relevant dimensions of interest (see Figure A1). The aim of our survey was to understand as comprehensively as possible expectations regarding the future of jobs, work and skills by the largest employers in some of the world’s biggest economies, in order to ultimately contribute to a more informed debate on these issues and provide an evidence base and guidance to businesses, governments and civil society organizations such as labour unions and education providers. As a starting point, we designed a survey targeted at heads of human resources departments, as well as chief strategy officers, as these are likely to hold the most detailed information on corporate policies and strategic workforce planning in light of current industry trends and disruptions. Our research framework has been informed by an extensive literature review on the various dimensions covered by the survey and by continuous consultation with leading experts from academia, international organizations, business and civil society through the World Economic Forum’s Global Agenda Council on the Future of Jobs and Global Agenda Council on Gender Parity, which served as partners and advisory bodies to the study. The survey collection process was carried out via online questionnaire in the first half of 2015, whereby the World Economic Forum’s Employment and Gender Challenge Initiative teams worked in close collaboration with Global Agenda Council Members, Global Challenge Partners and the Forum’s industry and regional teams to ensure a maximum number of responses from target companies. The World Economic Forum team, supported by Global Agenda Council Members, used the Hoovers and Bloomberg company databases to identify target companies and compile an extensive database of contact details of human resources department directors. For target companies for which we were not able to obtain contact information, Global Agenda Council Members carried out their own research to complete the database. Our pool of respondents comprised, as primary selection criterion, the 100 largest global employers in each target industry sector (as classified by the World Economic Forum; see Appendix B, Table B1), supplemented, as a secondary criterion, by the 50 largest national employers in each of our target countries (see target country list in Figure A1 : Survey Framework PART I Drivers of Change PART II Employment Trends PART III Skills Stability PART IV Workforce Strategy Appendix B, Table B2), if these were not already included as part of the first group.1 This approach was chosen in order to ensure sufficient geographic diversity and coverage to be able to provide balanced country-level as well as industrylevel results. Furthermore, a number of leading, fastgrowing small and medium-sized companies were identified qualitatively through the World Economic Forum network and included in the survey pool to account for significant future job creators and ‘disruptors.
In total, our target survey pool consisted of 2,450 companies. In various instances the largest employers in a country comprised the local units of well-known multinational enterprises, meaning that our survey approach entailed The Future of Jobs Report | 49 . obtaining results from these companies both at a global, headquarter-level and from one or more of their national operations. When looking at results through a country lens, this approach was considered the most appropriate given the importance of many of these large employers in their respective local labour markets. However, when looking at results through an industry lens, it was important to avoid skewing results by double counting responses from local units of the same company. We addressed this complexity through our survey design, by asking respondents to clearly associate all employment and occupation-related responses to a specific geography. In total, 371 individual companies responded to our survey over the first half of 2015, providing us with 1,346 unique data points around employment and occupations based in specific geographic locations across these companies’ global operations.
As outlined, the structure of our survey means that the sampling unit and base sample— the unique data points that can be used for most of our analysis—commonly refer to these 1,346 occupation-level responses; although in some cases, such as when looking at results through an overall industry lens, it is restricted to the 371 company-level responses to avoid double counting. In light of the above, companies were required to provide their name as well as the title and contact information of the person filling in the survey. Respondents were assured of strict confidentiality of their data at the level of individual company-level results. In addition, participating companies were given the option to be informed of their individual results relative to the range of responses in their country and/or industry. Our initial target list of countries comprised the three largest economies, by either GDP or population, in every world region.
In addition, through industry networks, the survey was carried out in companies based in other non-targeted countries. To ensure quality of results, only countries with a critical mass of responses have been included in the final Report. Our threshold for inclusion was a minimum of 30 unique data points per country.
Countries in our original target list for which we were unable to obtain a representative sample include Argentina, Colombia, Russian Federation, Republic of Korea, Egypt and Nigeria. In addition, due to an insufficient number of individual country-level responses, we have aggregated responses for a number of significant economies into two broader regional groupings: the Association of South East Asian Nations (ASEAN), combining results for Indonesia, Malaysia, Thailand and Singapore; and the Gulf Cooperation Council (GCC), combining results for Kuwait, Qatar, Saudi Arabia and the United Arab Emirates. The difficulty of obtaining responses from some geographies despite the dedicated work and support of Global Agenda Council Members and the Forum’s industry and regional teams appears to stem from a variety of causes, including sensitivity around the topic, concerns about confidentiality and business culture norms. There was near gender balance (54% female, 46% male) among the Chief Human Resources Officers and other senior executives who answered the survey. 50 | The Future of Jobs Report Interpretation of Results: Sample Coverage and Representativeness Overall, our survey sample represents more than 13 million employees across nine industry sectors (Financial Services & Investors; Information and Communication Technology; Energy; Basic and Infrastructure; Mobility; Consumer; Healthcare; Media, Entertainment and Information; and Professional Services) in 13 major developed and emerging economies (Australia, Brazil, China, France, Germany, India, Italy, Japan, Mexico, South Africa, Turkey, United Kingdom, United States) and two broader regional groupings, ASEAN (combining results for Indonesia, Malaysia, Singapore, Thailand) and the GCC (combining results for Kuwait, Qatar, Saudi Arabia, and the United Arab Emirates). In line with the Report’s overall aim of contributing to a more informed conversation on the future of jobs and providing guidance to businesses, governments and civil society organizations, the survey largely consisted of perception-based questions, with response options designed to focus on the key issues outcomes and trends as perceived by decision-makers. In addition there were a number of quantitative baseline questions. That is, our study is designed to reveal what the world’s leading employers think will happen, when they think it will happen, and what they propose to do about it.
While, between them, the expectations and corporate practices of the leading employers represented in our sample will significantly shape the future global employment landscape, it should be stated explicitly that our trend data hopes to be roughly right rather than precisely wrong. Similarly, in highlighting companies’ current thinking concerning intended change management and future workforce strategies, the Report aims to point to potential shortcomings and inconsistencies as a basis for further, more informed debate, rather than offering these as ready-made good practice solutions. In taking this perspective, the Report consciously focuses on actors with a key role in shaping the evolution of the global labour market. While only a minority of the world’s workforce is directly employed by large and emerging multinational employers such as the ones covered by our sample, these companies often act as anchors for smaller local firms, as suppliers within global value chains and as catalysts for the development of local entrepreneurship ecosystems.
In addition to their own significant share of employment, workforce-planning decisions by these firms therefore have the potential to transform local labour markets through indirect employment effects that set the pace for changing skills and occupational requirements. Similarly, the inclusion of medium-sized high-growth enterprises in our sample ensures representation of the category of companies generally considered the largest source of new net job creation in most economies.2 Nevertheless, given the Report’s aim of providing guidance and stimulating discussion, it is important to treat with caution the extent to which it is possible to generalize and extrapolate from our findings in a manner that could be considered representative of all trends across an entire industry or country. . Representativeness at the country level As a first important caveat, our survey only covers wage employment jobs in the formal economy, whereas the majority of the workforce in some developing countries may be based in agriculture or in the informal sector. According to the World Bank, roughly half of the world’s working population of more than 3 billion people are small farmers or self-employed in low productivity activities such as street vending, limiting our findings’ applicability in these contexts. It should be noted, however, that many informal sector jobs are also subject to dramatic change due to the same drivers of change, trends and disruptions affecting those based in large established firms. For example, the increasing ubiquity of mobile phones in developing countries has led to a mobile payments revolution, whereby a large range of informal sector transactions are now taking place via such platforms. Similarly, several technological trends hold out the promise of integrating an increasing number of informal sector workers into the global labour market in unprecedented ways, including by formally linking them to large established employers.3 A second consideration regarding representativeness of our results at the country level concerns the question of what percentage of the formal sector labour force is employed in large firms such as the ones in our sample. The available data suggests that, in general, fewer people in lower income countries are employed in large firms, limiting the generalizability of findings in these countries.4 In summary, the Report’s survey design seems wellsuited to the target countries studied, namely: developed economies and large emerging markets, with certain caveats on generalizability for the latter.
It seems less applicable for extrapolating results directly for developing economies not covered by the survey, although we believe our findings may provide valuable information for long-term human capital development strategies in these countries. More broadly, the Report focuses on two types of job categories in any particular country, rather than on the entirety of the national labour market as a whole: firstly, on mass employment jobs currently held by a large share of the labour force in that country; secondly, on strategic or specialist jobs that are critical to a company’s operations and may link the country to the worldwide network of international production and global value chains. The first category takes its significance from the number of employees directly affected; the second category provides an outlook primarily on high-skilled jobs, often including those with a particular bearing on opportunities and threats for the country’s positioning within the global economy. Representativeness at the industry level The main questions regarding representativeness of our findings at the industry level concern the extent to which the large employers in our sample are representative of a typical company in their industry sector as a whole, and, therefore, what percentage of the industry’s workforce is employed in companies such as the ones covered by our survey. Available data shows, for example, that there are systematic differences between larger and smaller firms with regard to the amount of in-house training and skills upgrading they are offering, so our analysis of future workforce strategies will be more applicable to industry sectors with a larger share of employment in large firms. Economic theory suggests that (in a competitive market, i.e. leaving aside monopolies, cartels and regulatory policies) firm size distribution in an industry is mostly the result of underlying structural factors—for example, some goods and services are naturally better produced in large firms; others, in smaller ones.5 A good approximation of the prevalence of employment in large firms in an industry is the degree of industry concentration, as measured by indicators such as the Herfindahl index6 and the concentration ratio7, which calculates the share in total industry output of the industry’s five largest firms.
Total output and gross value added in a number of industries—such as Energy, Mining and Metals, and Information and Communication Technology—are highly concentrated in a handful of large companies with tens of thousands of employees each. These large companies included in our sample account for a very large share of total employment in their industries. For some other industries, our sample population is more representative of the industry’s leading employers, rather than of the industry’s total workforce as a whole. Overall, because of the differences between large enterprises and small and medium-sized ones, especially when it comes to talent management and HR strategies, it is clear that our findings are mainly applicable to larger firms—the biggest employers in each industry in particular. A second consideration regarding representativeness of our results at the industry level concerns cross-country differences in public and private ownership. Our survey was designed to be applicable to workforces in both sectors. However, to date we have been able to obtain a critical mass of responses only from state-owned enterprises, not from public sector employers such as government departments.
This caveat affected our sample selection particularly in industry sectors such as healthcare and education, which are public in some countries and partly or wholly private in others, since business databases such as Hoovers and Bloomberg do not cover entities such as public hospitals. These are a major source of employment in many countries and are undergoing similar workforce challenges and transformations as private sector companies. Given sufficient interest from these constituents, we envisage a follow-up project to the present Report for public sector employees, covering not only the public sector but also civil society and international organisations as a distinct industry sector. Finally, a methodologically interesting question is the extent to which the identified trends and disruptions might themselves affect the validity of our conclusions regarding representativeness, for example by changing industry concentrations and structures through drivers of change such as 3D printing and sharing economy platforms.8 In general, while many of these trends point to a rise in importance of freelance work and contractors, evidence suggests that much of this work will continue The Future of Jobs Report | 51 .
Table A1: Definition of core work-related skills, based on the O*NET Content Model Skill/ability family Skill/ability Definition Cognitive Flexibility The ability to generate or use different sets of rules for combining or grouping things in different ways. Creativity The ability to come up with unusual or clever ideas about a given topic or situation, or to develop creative ways to solve a problem. Logical Reasoning The ability to combine pieces of information to form general rules or conclusions (includes finding a relationship among seemingly unrelated events) and/or to apply general rules to specific problems to produce answers that make sense. Problem Sensitivity The ability to tell when something is wrong or is likely to go wrong. It does not involve solving the problem, only recognizing there is a problem. Mathematical Reasoning The ability to choose the right mathematical methods or formulas to solve a problem. Visualization The ability to imagine how something will look after it is moved around or when its parts are moved or rearranged. Manual Dexterity and Precision The ability to make precisely coordinated movements to grasp, manipulate or assemble objects. Physical Strength The ability to exert maximum muscle force to lift, push, pull, or carry objects. Active Learning Understanding the implications of new information for both current and future problemsolving and decision-making. Oral Expression Talking to others to convey information effectively. Reading Comprehension Understanding written sentences and paragraphs in work-related documents. Written Expression Communicating effectively in writing as appropriate for the needs of the audience. ICT Literacy Using digital technology, communications tools, and networks to access, manage, integrate, evaluate and create information. Active Listening Giving full attention to what other people are saying, taking time to understand the points being made, asking questions as appropriate and not interrupting at inappropriate times. Critical Thinking Using logic and reasoning to identify the strengths and weaknesses of alternative solutions, conclusions or approaches to problems. Monitoring Self and Others Monitoring/assessing performance of yourself, other individuals or organizations to make improvements or take corrective action. ABILITIES Cognitive Abilities Physical Abilities BASIC SKILLS Content Skills Process Skills to be influenced by the workforce practices and sourcing decisions of large, established employers,9 validating the Report’s research framework. Classifying Occupations: ISCO and O*NET Given the Report’s major aim of bringing specificity to predictions about the future of jobs at the occupation level and moving beyond broad categorizations, we have based our analysis on a recognized reference system widely used by labour market researchers: a streamlined version of the Occupational Information Network (O*NET), developed by the US Department of Labor in collaboration with its Bureau of Labor Statistics’ Standard Classification of Occupations (SOC). In its unabridged form, the O*NET-SOC taxonomy includes detailed information on 974 individual occupations in the United States, grouped into approximately 20 broader job families, which are regularly revised and updated for new and emerging occupations to keep up 52 | The Future of Jobs Report with the changing occupational landscape. The virtually unparalleled level of descriptive detail of O*NET allows us to dive deep into the job profile of individual occupations and to supplement our analysis with a range of job-specific further information, compiled in collaboration with industry experts and HR practitioners. For example, in addition to a complete profile of the skills and abilities currently perceived as required to perform a job successfully, O*NET provides further detailed information such as common qualifying degrees or certifications, typical activities performed on-thejob and physical working conditions—nuances which have been used by researchers such as Frey and Osborne (2013) to predict the extent of upcoming job task automation and which enable us to directly link our findings to these bodies of research for further customized analysis going forward. O*NET also provides hard data on compensation, absolute employment numbers by occupation and their growth outlook to 2022 for the United States, which we .
Table A1: Definition of core work-related skills, based on the O*NET Content Model (cont’d.) Skill/ability family Skill/ability Definition CROSS-FUNCTIONAL SKILLS Complex Problem Solving Skills Complex Problem Solving Developed capacities used to solve novel, ill-defined problems in complex, real-world settings. Resource Management Skills Management of Financial Resources Determining how money will be spent to get the work done, and accounting for these expenditures. Management of Material Resources Obtaining and seeing to the appropriate use of equipment, facilities and materials needed to do certain work. People Management Motivating, developing and directing people as they work, identifying the best people for the job. Time Management Managing one's own time and the time of others. Coordinating with Others Adjusting actions in relation to others' actions. Emotional Intelligence Being aware of others' reactions and understanding why they react as they do. Negotiation Bringing others together and trying to reconcile differences. Persuasion Persuading others to change their minds or behaviour. Service Orientation Actively looking for ways to help people. Training and Teaching Others Teaching others how to do something. Judgement and Decision Making Considering the relative costs and benefits of potential actions to choose the most appropriate one. Systems Analysis Determining how a system should work and how changes in conditions, operations and the environment will affect outcomes. Equipment Maintenance and Repair Performing routine maintenance on equipment and determining when and what kind of maintenance is needed and/or repairing machines or systems using the needed tools. Equipment Operation and Control Watching gauges, dials or other indicators to make sure a machine is working properly; controlling operations of equipment or systems. Programming Writing computer programmes for various purposes. Quality Control Conducting tests and inspections of products, services or processes to evaluate quality or performance. Technology and User Experience Design Generating or adapting equipment and technology to serve user needs. Troubleshooting Determining causes of operating errors and deciding what to do about it. Social Skills Systems Skills Technical Skills used as one of several reference points to sense-check and calibrate our perception-based results. In addition, the O*NET-SOC taxonomy can be converted into corresponding occupations under the International Labour Organization’s International Standard Classification of Occupations (ISCO), allowing for internationalization of results.10 We have made use of this possibility, for example, when estimating the absolute number of employees by job family in the Report’s Country Profiles. Note that, due to differences in the two classification systems, an O*NET-ISCO harmonized list of occupations reduces to around 350 from O*NET’s original list of 974 occupations, and it is this streamlined list of occupations that we have used in practice in the survey and Report. Furthermore, respondents to the Future of Jobs Survey had the ability to self-specify additional occupations they considered of particular relevance if they did not find these reflected in pre-given response options. Finally, one implication of the structure of our survey questionnaire is that we have received an uneven number of responses per occupation—with, on the one hand, a strong convergence of data points around largest occupations in terms of employment and occupations perceived as critical/strategic for particular industries and, on the other hand, a relatively long tail of responses distributed across occupations with a lower number of individual mentions, affecting the reliability and margins of error of any individual predictions for the latter. In general, we address this by making use of O*NET’s two-level structure to report results aggregated at the broader job family level, not at the level of individual occupations. Employment Effects Estimated employment effects have been converted into compound growth rates for the 2015–2020 period, i.e.
the mean growth rate over the specified period of time if employment were to grow or decline at a steady The Future of Jobs Report | 53 . rate. The compound annual growth rate is essentially a representational figure that describes the rate at which a quantity would have grown if it had grown at a constant rate. The simplest limitation of a compound growth rate is that because it calculates the smooth average of growth over a period, it ignores volatility and implies that the growth during that time was steady, which is rarely the case. Reported employment outlook totals for job families have been weighted for the frequency of underlying occupation-level data points, using the standard weighted n arithmetic mean formula: ⌺wi,xi x = i=1 n ⌺wi i=1 on the simplifying assumption that more frequently mentioned occupations will also tend to employ a correspondingly larger absolute number of people in the concerned job family. It is possible to calculate the net absolute number of jobs expected to be created or lost in the job family whenever the underlying quantity of workers employed in the corresponding occupation is known for the country or industry. In practice, we have chosen only do this on an illustrative basis for our sample as a whole in order to keep the focus of our analysis firmly on the relative outlook for particular job types and job families compared to each other over the 2015–2020 period. Skills Stability Classifying skills The concept of skills is used in many different and sometimes ambiguous ways in different contexts and, unlike for occupations, a widely agreed shared definition or taxonomy of the term at the international level does not exist.11 In a general sense, the term skills is used to refer to the work-related capabilities of people to perform a job successfully.
It should be distinguished from the concept of abilities, which refers to more fundamental and enduring attributes of an individual, such as physical or cognitive abilities that are formed over a longer period, often beginning in early childhood education. In national and international statistics, achieved education levels or qualifications are often used as a proxy for or representation of skills. However, this approach is of limited use for the purposes of our Report and has been at the heart of conflicting perceptions about the current state of skills mismatches and the availability of qualified talent between education providers and employers. The education sector refers mainly to formal qualifications and credentials, whereas actors from the employment side refer to the actual practical capabilities or competences that employees (or new graduates) are able to use. Given the unprecedented rate of change of both on-the-job skills required to perform in an occupation successfully and of the content or hard knowledge of the core curriculum in many academic fields, we felt that the Report should adopt a taxonomy that would allow for the highest level of nuance, detail and specificity possible in order to adequately capture the pace of skill set disruption. 54 | The Future of Jobs Report Accordingly, the Report’s analysis of skills focuses on a core set of 35 specific and widely used work-relevant skills and abilities that have been empirically derived from today’s most-frequently cited skills and abilities across all occupations and job families in the O*NET database.
Our analysis found that the core skill set of most occupations consisted of a range of combinations of these 35 core skills. In addition, respondents to the Future of Jobs Survey had the possibility to self-specify further occupation-specific skills they considered essential if they did not already find these reflected in the pre-given response options. Table A1 shows the full list of work-related core skills and abilities that we have adapted from the O*NET database. A number of these skills have been manually combined, renamed or reclassified from their original designation within O*NET for concision and clarity.12 Calculating skills stability The Report repeatedly uses the concept of skills stability to illustrate the degree to which, by the year 2020, particular occupations and job types are expected to require competence in new skills that have hitherto not been part of that occupation’s core skill set today. The data points for this calculation are derived from our executive survey, in which respondents were twice asked to specify the top five skills most frequently used by their specified occupation: once for today, once for the year 2020. Respondents could select their answer from the 35 skills shown in Table A1, and also had the option to selfspecify skills requirements should they not be satisfied by the response options given.
The degree of skills stability refers to the share of skills mentioned both in today’s core skill set and re-mentioned as a core skill for the year 2020. Growing skills demand refers to skills only mentioned as part of occupations’ specified core skill set in 2020. Declining skills demand refers to skills only mentioned as part of today’s core skill set but not re-mentioned for 2020. The various skills stability measures used throughout the Report are the result of aggregating these data points for the unit of analysis in question, such as a job family or industry sector. As elsewhere, our approach represents a streamlining of the full O*NET taxonomy—which uses a longer list of skills—in order to make it amenable for use in an executive survey. In practice, limiting what we refer to as an occupation’s “core skillset” to the top five skills might mean certain skills that enter or drop out of the top five are merely experiencing a relative shift in importance, rather than being wholly new or ‘never used again thereafter’. However, even such relative shifts still strongly imply substantial ongoing change and transformation of skills requirements, convincing us of the soundness and validity of skills stability as a concept as used in the Report. .
NOTES 1 For example, the 50 largest national employers in the United States are all simultaneously part of the 100 largest employers in their respective industry globally, meaning that we did not supplement our survey pool with additional respondents from the United States. By contrast, few of South Africa’s largest national employers are part of the 100 largest employers in their industry globally; in this case, we supplemented our survey pool with additional large employers from South Africa, to ensure a representation of at least 50 South Africa based companies in the sample. 2 See, for example, Djordjevic, 2013. UK Office for National Statistics, Concentration ratios for businesses by industry in 2004, 2006, http://www.ons.gov.uk/ons/rel/elmr/economictrends--discontinued-/no--635--october-2006/concentration-ratiosfor-businesses-by-industry-in-2004.pdf. World Bank, Small vs. Young Firms across the World Contribution to Employment, Job Creation, and Growth, Policy Research Working Paper 5631, 2011. Zervas, G, D. Proserpio and J.
Byers, The Rise of the Sharing Economy: Estimating the Impact of Airbnb on the Hotel Industry, Working Paper, Boston University, 2015. 3 See, for example, McKinsey Global Institute, 2015. 4 World Bank, 2011. 5 Kumar, Rajan and Zingales, 2001. 6 http://en.wikipedia.org/wiki/Herfindahl_index. 7 http://en.wikipedia.org/wiki/Concentration_ratio. 8 See, for example, Zervas, Proserpio and Byers, 2015. 9 See, for example, Cappelli and Keller, 2013. 10 Official conversion tables are available at: www.bls.gov/soc/ISCO_ SOC_Crosswalk.xls. 11 See, for example: European Training Foundation, Anticipating and Matching Skills Demand and Supply: Synthesis of National Reports, 2012. 12 A full overview of O*NET’s complete skills taxonomy is available at: www.onetonline.org/skills/. METHODOLOGICAL REFERENCES International Standard Classification of Occupations (ISCO), International Labour Organization, http://www.ilo.org/public/english/bureau/stat/ isco/. The Occupational Information Network (O*NET), US Department of Labor, Employment and Training Administration, https://www.onetonline.org. Standard Occupational Classification (SOC), US Department of Labor, Bureau of Labor Statistics, http://www.bls.gov/soc/. O*NET-ISCO Conversion Tables, http://www.bls.gov/soc/ISCO_SOC_ Crosswalk.xls. Cappelli, P. and J. Keller, “Classifying Work in the New Economy”, Academy of Management, vol.
38, no. 4, 2013, pp. 575–596. Djordjevic, J., Why Becoming Large Matters: How Scalable, High-Growth Entrepreneurs Can Help Solve the Jobs Crisis, Endeavor Insight and Omidyar Network, 2013. European Centre for the Development of Vocational Training (CEDEFOP), Piloting a European Employer Survey on Skill Needs: Illustrative Findings, CEDEFOP Research Paper No.
36, 2013. — —, Quantifying Skills Needs in Europe – Occupational Skills Profiles: — Methodology and Application, CEDEFOP Research Paper No. 30, 2013. European Training Foundation, Anticipating and Matching Skills Demand and Supply: Synthesis of National Reports, 2012. Frey, C. and M.
Osborne, The Future of Employment: How Susceptible are Jobs to Computerisation?, Oxford Martin School Programme on the Impacts of Future Technology, 2013. ILO and GIZ, Is Small Still Beautiful? Literature Review of Recent Empirical Evidence on the Contribution of SMEs to Employment Creation, 2013. Kumar, K, R. Rajan and L. Zingales, What Determines Firm Size?, University of Chicago Graduate School of Business, Working Paper No.
496, 2001. McKinsey Global Institute, A Labor Market that Works: Connecting Talent with Opportunity in the Digital Age, 2015. National Center for O*NET Development, New and Emerging Occupations: Methodology Development Report, 2006. Pajarinen, M, P. Rouvinen and A. Ekeland, Computerization and the Future of Jobs in Norway, Discussion Paper, Research Institute of the Finnish Economy and Statistics Norway, 2015. The Future of Jobs Report | 55 .
. Appendix B: Industry and Regional Classifications Table B1: Classification of industries Industry Group Industry Sector Basic and Infrastructure Chemicals Infrastructure and Urban Development Mining and Metals Agriculture, Food and Beverage Consumer Retail, Consumer Goods and Lifestyle Energy Utilities and Technology Energy Oil and Gas Renewable Energy Financial Services & Investors Banking and Capital Markets Insurance and Asset Management Private Investors Institutional Investors, Sovereign Funds, Family Offices Healthcare Global Health and Healthcare Information and Communication Technology Information Technology Telecommunications Media, Entertainment and Information Media, Entertainment and Information Mobility Aviation and Travel Automotive Supply Chain and Transportation Professional Services Professional Services Table B2: Classification of regions ASIA AND THE PACIFIC EUROPE AND CENTRAL ASIA MIDDLE EAST AND NORTH AFRICA SUB-SAHARAN AFRICA THE AMERICAS ASEAN Australia China India Japan France Germany Italy Turkey United Kingdom Gulf Cooperation Council South Africa Brazil Mexico United States The Future of Jobs Report | 57 . . Part 2 Industry, Regional and Gender Gap Profiles . . User’s Guide: How to Read the Industry, Regional and Gender Gap Profiles Part II of the Report presents findings through an industry, regional and gender lens, with the aim of providing specific practical information to decision-makers and experts from academia, business, government and civil society. It provides deeper analysis of the overview of results in Part I through Industry Profiles, Country and Regional Profiles and Industry Gender Gap Profiles. In addition, the various Profiles are intended to provide interested companies with the opportunity to benchmark themselves relative to the range of expectations prevalent in their country and/or industry. This User’s Guide provides a detailed explanation of the information contained in the various Profiles and its appropriate interpretation. Industry Proï¬le Basic and Infrastructure Drivers of Change Workforce Disruption Top Trends Impacting Business Models Climate change, natural resources Changing nature of work, flexible work 46% New energy supplies and technologies 38% Geopolitical volatility 28% Middle class in emerging markets 15% Robotics, autonomous transport 15% Longevity, ageing societies 13% Rapid urbanization Industry Average 49% 13% STABLE 1 13% HARD HARDER Skills stability Current share of female workforce Ease of recruitment, current Ease of recruitment, 2020 Main Job Families Skills stability Current share of female workforce Ease of recruitment, current Ease of recruitment, 2020 Manufacturing and Production Assembly and Factory Workers Chemical Processing Plant Operators Expected change, 2015–2020 decline –1.84% 62% 9% hard harder Architecture and Engineering Chemical Engineers Civil Engineers stable 0.73% 59% 11% hard harder Construction and Extraction Mining and Petroleum Extraction Workers Construction Laborers decline –2.18% 72% 9% hard harder Management stable Business Services and Administration Managers 0.41% Manufacturing, Mining and Construction Managers 44% 11% hard harder Job families Expected Time to Impact on Employee Skills 2 Climate change, natural resources 58% Employment outlook 3 Changing nature of work, flexible work New energy supplies and technologies Expected Impact on Job Quality 42% 42% Impact 2015– felt already 2017 16% 2018– 2020 22% 2021– 2025 44% Impact 2015– felt already 2017 28% 6% 2018– 2020 40% 2021– 2025 46% Impact 2015– felt already 2017 7% 2018– 2020 2021– 2025 ⬆ ⬇ ⬆ Compensation Job security Work-life balance 7% INDUSTRY PROFILES Industry Proï¬le DRIVERS OF CHANGE The first section of each Industry Profile provides an overview of the top trends and disruptions expected to affect the industry in question over the coming years, as well as the timeframe within which these trends and disruptions are expected to require modification to the skill sets of key job functions within the industry. Basic and Infrastructure Skills Forecast Change Management and Future Workforce Planning Skills Change, Overall Industry Barriers Current 2020 Technical skills Insufï¬cient understanding of disruptive changes ...........................................
59% Social skills Resource constraints................................................................................... 54% Pressure from shareholders, short-term proï¬tability ...................................... 51% Cognitive abilities Workforce strategy not aligned to innovation strategy ...................................
38% Resource management skills Insufï¬cient priority by line management ....................................................... 30% Process skills Insufï¬cient priority by top management ........................................................ 27% Content skills Complex problem solving skills Systems skills Strategies Physical abilities Invest in re-skilling current employees 15 20 â– stable skills demand 25 30 41% 38% 35% Attract foreign talent 35% Collaborate, other companies in industry 10 65% Target female talent 5 â– growing skills demand Support mobility and job rotation Collaborate, educational institutions 0 19% â– declining skills demand Emerging Job Family in Focus: Business and Financial Operations Occupations Expected Time to Impact on Employee Skills The diagram illustrates the expected timeframe within which the top three mentioned trends or disruptions affecting business models in the industry in question are expected to require modification of skill sets of key job functions within the industry—either in order to equip employees with the skills needed to seize new business opportunities created by the trend or disruption or in order to avoid losing competitiveness due to the obsolescence of current employees’ existing skill sets.
Due to the different business models and different combinations of trends and disruptions prevalent in each industry, the same drivers of change may be felt differently in various industries. Key skills for 2020 Skills bundle Human Resources Specialists Top Trends Impacting Business Models The bar chart represents the share of survey respondents from the industry in question who selected the stated trend or disruption as one of the top three drivers of change affecting business models in their industry. For a detailed description of each driver of change, please see Table 2 in Part I of the Report. 53% believe future workforce planning is a leadership priority Problem Sensitivity Cognitive Abilities Offer apprenticeships 14% Accountants and Auditors Active Learning Content Skills Target minorities’ talent 14% Investment Fund Managers Critical Thinking Process Skills Management of Financial Resources Resource Management Skills Persuasion 36% are conï¬dent strategies are suitable Social Skills WORKFORCE DISRUPTION The second section of each Industry Profile aims to provide a consolidated overview of the major expected developments until the year 2020 for the industry’s workforce as a whole and within each main job family in the industry in question. Industry Average This section provides an aggregate summary of the relative outlook for all occupations and job functions mentioned by survey respondents from the industry in question. All reported averages are simple averages across the job families and functions mentioned, i.e.
results have not been weighted by the absolute number of workers employed in any given occupation. For a detailed explanation of each covered dimension, please see the next section, Main Job Families. The Future of Jobs Report | 61 . Main Job Families The table gives a detailed overview of expected developments in the four job families most frequently mentioned by survey respondents from the industry in question. Categorization of occupations and job families is based on the O*NET labour market information system (see Appendix A for details).1 All reported values are simple averages across mentioned occupations within the job family, i.e. results have not been weighted by the absolute number of employees in any given occupation. The individual occupations listed underneath each job family are for illustrative purposes and report the two occupations in the job family most frequently cited by survey respondents from the industry in question. The table covers the following dimensions: • Expected change, 2015–2020: The employment outlook for the job family, converted to a compound growth rate for the 2015–2020 period.
The thresholds for the qualitative scale are: +/–1%: “stable”; +/–1% to +/–5%: “growth / decline”; more than +/–5%: “strong growth / strong decline”. • Skills stability: The share of an occupation’s five most frequently used skills that have been identified as such by industry respondents both for today and for the year 2020, aggregated across all occupations mentioned for the job family. For a detailed description of each skill, please see Figure 9 and Table A1 in Part I of the Report. • Current share of female workforce: The reported share of current female employees for all occupations mentioned as part of the job family, aggregated as a simple average, i.e. not weighted by the absolute number of employees in any given occupation. • Ease of recruitment, current: The industry’s perceived current ease or difficulty of hiring competent and qualified employees for a given role, on a qualitative –2 (“very hard”) to +2 (“very easy”) scale, aggregated for the job family as a simple average, i.e.
not weighted by the absolute number of employees in any given occupation. The thresholds for the qualitative scale are: –2 to –1: “very hard”; –1 to –0.5: “hard”; –0.5 to +0.5: “neutral”; +0.5 to +1: “easy”; +1 to +2: “very easy”. • Ease of recruitment, 2020: The industry’s expected cumulative change in ease of recruitment over the 2015-2020 period, aggregated across roles for the job family as a simple average. The qualitative statement is relative to the previously reported current value. Expected Impact on Job Quality The arrows indicate the expected cumulative change in the three dimensions listed over the 2015–2020 period, as identified by survey respondents from the industry in question on a qualitative –2 (“strong decrease”) to +2 (“strong increase”) scale.
Reported values are simple 62 | The Future of Jobs Report averages across all job families mentioned for the industry and have not been weighted by the absolute number of workers employed in any given occupation. The three dimensions listed are based on a conceptual framework of job quality under development by the Organisation for Economic Co-operation and Development (OECD).2 • Compensation: The extent to which employment contributes to material living standards. • Job security: The risk of job loss and its consequences. • Work-life balance: The nature and content of work performed, working-time arrangements and workplace relationships. SKILLS FORECAST The third section provides an outlook on the expected evolution of skills demand over the 2015–2020 period. It looks at skills requirements both from an overall industry perspective as well as from the perspective of key skills that will be in demand as part of important new and emerging jobs in the sector.
Categorization of skills is based on the O*NET labour market information system. For a detailed description of each skill, please see Figure 9 and Table A1 in Part I of the Report. Skills Change, Overall Industry The stacked bar chart is a diagrammatic representation of overall demand for the industry’s most frequently used skills across all occupations and job families over the 2015– 2020 period. The stacked bars are ordered by the overall magnitude of demand for the category of skills indicated and add up to 100%—the industry’s total skills demand profile.
The dark blue part of the stacked bars represents the share of skills from the given category for which demand is expected to remain stable. The grey part of the stacked bar represents the share of skills from the given category which is in demand today but for which demand will be on the decline by the year 2020. The bright blue part of the bar represents the share of skills from the given category that is anticipated to be in demand by the year 2020, even though this demand has not yet fully materialized today. Accordingly, the dark blue and grey parts of the bar chart combined represent the industry’s current overall skills demand profile while the bright blue and dark blue parts of the bar chart combined represent overall skills demand in the industry as expected for the year 2020.
Comparing the contours of the two demand profiles and the relative change in length of the various bars provides a visual overview of skills change in the industry. Emerging Job Family in Focus This part of the Industry Profile dives deep into the job family that corresponds to the occupations most frequently mentioned as new and emerging by survey respondents from the industry in question. The left-hand side of the table lists the top-mentioned emerging occupations expected to . become increasingly influential in the industry by the year 2020. The right-hand side of the table lists the individual skills expected to be in demand as part of skills profile of these occupations and their corresponding skills family. Categorization of occupations and skills is based on the O*NET labour market information system. Country Proï¬le Australia Workforce Disruption Sample Overview Main Industries Employment Outlook by Main Job Family CURRENT Current workforce (thousands) 2020 Employment outlook, 2015–2020 Local share of recruitment, specialists Ease of recruitment, overall Local share of recruitment, specialists Ease of recruitment, overall Professional Services stable 0.91% 76–100% hard 51–75% harder Basic and Infrastructure decline –1.67% — easy — neutral Energy growth 76–100% hard 76–100% harder Information and Communication Technology growth 3.57% 76–100% hard 76–100% harder Industry Industries 1,452 Sales and Related 962 Occupation types Mass Employment Petroleum and Natural Gas Reï¬ning Plant Operators Strategic/Specialist Sales Representatives, Wholesale and Technical Products 9% 13% 43% 35% Up to 500 500– 5,000 5,000– 50,000 More than 50,000 New and Emerging Robotics Engineers Country/region neutral Sample average hard Country/region Construction and Extraction Installation and Maintenance 457 Farming, Fishing and Forestry 455 2020 Computer, Mathematical and Science 458 CURRENT Manufacturing and Production 593 Ease of Recruitment Business, Legal and Financial 683 550 Number of Employees Transportation and Logistics 685 â– Professional Services .........................................27% â– Basic and Infrastructure .....................................26% â– Energy ..............................................................22% â– Information and Communication Technology........16% â– Others.................................................................9% Ofï¬ce and Administrative 897 3.57% CHANGE MANAGEMENT AND FUTURE WORKFORCE PLANNING The final section of each Industry Profile focuses on the measures and strategies for adapting to the top trends and disruptions expected to affect the industry in question over the coming years that companies intend to undertake, as well as the biggest perceived barriers to successfully carrying out these measures and the perceived degree of preparedness prevalent across the industry. Management 1,052 Education and Training Sample average harder neutral Arts, Design, Entertainment, Sports, and Media 416 hard hard harder harder — — hard hard Architecture and Engineering 386 N/A Growing Declining Stable Not shown: Social and Protective Services (782), Healthcare Practitioners (343), Hospitality and Food Related (634), Personal Care and Service (761) Country Proï¬le Barriers The table lists the biggest perceived barriers to preparing the industry’s workforce for disruptive change, as measured by the share of survey respondents from the industry in question who selected the stated obstacle as one of the top three impediments to successful workforce change management faced by their industry. For a detailed discussion of each barrier, please refer to Part I of the Report. To the right of the table is the percentage of respondents who believe that future workforce planning to prepare for disruptive change is either a “somewhat high” or “very high” priority for their organization’s senior leadership. Strategies The bar chart represents the share of survey respondents from the industry in question who selected the stated measure as one of the top three future workforce and change management strategies they expect to undertake in their company.
For a detailed discussion of each measure, please refer to Part I of the Report. To the right of the table is the percentage of respondents from the industry who stated that they were either “somewhat confident” or “highly confident” in the adequacy of the selected strategies. COUNTRY AND REGIONAL PROFILES SAMPLE OVERVIEW The first section of each Country or Regional Profile contextualizes the information presented according to the industry and company size mix of received responses. Overall representativeness of country-level findings should be understood according to the primary country, industry sector(s) and/or company size segments of interest. In addition to 13 Country Profiles, there are two Regional Profiles—ASEAN and GCC. WORKFORCE DISRUPTION The second section of each Country and Regional Profile aims to provide a consolidated overview of the major expected developments over the 2015–2020 period for the Australia Drivers of Change Change Management and Future Workforce Planning Top Trends Impacting Industries Changing nature of work, flexible work Climate change, natural resources 38% New energy supplies and technologies 38% Mobile internet, cloud technology 29% Processing power, Big Data 24% Geopolitical volatility 24% Sharing economy, crowdsourcing 19% Women’s economic power, aspirations Barriers 52% 14% Resource constraints..........................................................................
93% Pressure from shareholders, short-term proï¬tability ............................. 71% Workforce strategy not aligned to innovation strategy .......................... 57% Insufï¬cient understanding of disruptive changes ..................................
57% Insufï¬cient priority by top management ............................................... 57% 45% believe future workforce planning is a leadership priority Strategies Invest in re-skilling current employees 60% 2015– 2017 2018– 2020 33% Collaborate, other companies across industries 28% Target minorities’ talent 22% Collaborate, other companies in industry 22% Collaborate, educational institutions 17% Attract foreign talent 40% Impact already felt 33% Target female talent Expected Impact on Employment Outlook: Neutral 61% Support mobility and job rotation Disruption in Focus: Changing Nature of Work, Flexible Work Expected Time to Impact on Employee Skills 6% 55% are conï¬dent strategies are suitable 2021– 2025 country’s workforce as a whole across key industries, job types and job families. Main Industries The table gives a detailed overview of changes in the employment landscape across key industries in the country covered by survey respondents. Reported values are a simple average of all responses received for the industry. The table covers the following dimensions: • Employment outlook, 2015–2020: The expected employment change for the industry, across all job families, converted to a compound growth rate for the 2015–2020 period.
The thresholds for the qualitative scale are: +/–1%: “stable”; +/–1% to +/–5%: “growth / decline”; more than +/–5%: “strong growth / strong decline”. • Local share of recruitment, specialists: The current and expected share of strategic and specialist job functions anticipated by respondents from the corresponding industry to be recruited locally in the country. On the one hand, a very low local recruitment share may indicate skills shortages and a very high reliance on expatriate talent that might present an opportunity for the country to build up its talent pool in a targeted manner. On the other hand, a very high local recruitment share might indicate underutilized The Future of Jobs Report | 63 .
opportunities to diversify experience and increase knowledge transfer to the local workforce from international experts. • Ease of recruitment, overall: The current and expected ease or difficulty of hiring competent and qualified employees across all roles in the industry specified, on a qualitative –2 (“very hard”) to +2 (“very easy”) scale, aggregated for the entire industry in question as a simple average, i.e. not weighted by the absolute number of employees in any given occupation. The thresholds for the qualitative scale are: –2 to –1: “very hard”; –1 to –0.5: “hard”; –0.5 to +0.5: “neutral”; +0.5 to +1: “easy”; +1 to +2: “very easy”. The qualitative scale for “2020” is relative to the current values reported. Ease of Recruitment The table in this section gives a detailed overview of the perceived current and future aggregate ease of recruitment for occupations across three types of jobs: Mass Employment, Strategic/Specialist and New and Emerging. The individual occupations listed underneath each job type are for illustrative purposes and report the occupations most frequently cited by survey respondents across all industries in the country.
Categorization of occupations and job families is based on the O*NET labour market information system. The thresholds for the qualitative ease of recruitment scale are the same as for the table above. Values are reported both for the country or region in question as well as for the global sample average, indicating job types in which the country or region may have a comparative advantage as well as those in which recruitment is expected to be more difficult than the world average. Employment Outlook by Main Job Family The bubble chart visualizes estimated total employment in different job families in the country.
The colour of the bubbles indicates the job family’s aggregate employment outlook on the following scale: +/–1%: “Stable”; more than +/–1%: “Growing / Declining”. Insufficient response data available for job families is labelled “N/A”. Estimated total employment by job family is derived from ILOSTAT data, classified according to the International Standard Classification of Occupations (ISCO) and converted to corresponding O*NET job families using the O*NET-SOC taxonomy’s official conversion tables (please see Appendix A for details).
No internationally comparable data was available for China and India. Estimates for ASEAN are based on Malaysia, Thailand and Vietnam, and estimates for GCC are based on Saudi Arabia only. Due to the nature of our employment survey and its target audience of large multinational employers, insufficient response data for robust predictions was generally available for the four job families not shown. 64 | The Future of Jobs Report DRIVERS OF CHANGE The third section of each Country and Regional Profile provides an overview of the top trends and disruptions expected to affect industries in the country in question over the coming years and an in-depth look at the top-mentioned trend or disruption across all industries. Top Trends Impacting Industries The bar chart represents the share of survey respondents across industries located in the country or region in question who selected the stated trend or disruption as one of the top three drivers of change affecting business models in their industry.
For a detailed description of each driver of change, please see Table 2 in Part I of the Report. Disruption in Focus This section dives deep into the top-mentioned trend or disruption across industries in the country or region in question. The diagram illustrates the expected time frame within which it is expected to require modification of skill sets of key job types in the country or region— either in order to equip the country’s workforce with the skills needed to seize new opportunities created by the trend or disruption in question or in order to avoid losing competitiveness due to the obsolescence of the workforce’s existing skill sets. The section also reports the trend’s or disruption’s expected overall impact on employment outlook in the country or region. CHANGE MANAGEMENT AND FUTURE WORKFORCE PLANNING The final section of each Country and Regional Profile focuses on the measures and strategies for adapting to the anticipated top trends and disruptions that companies across industries located in the country or region in question intend to undertake, as well as the biggest perceived barriers to successfully carrying out these measures and the perceived degree of preparedness prevalent across industries in the country or region. Barriers The table lists the biggest perceived barriers to preparing the country’s or region’s workforce for disruptive change, as measured by the share of companies across industries located in the country or region in question who selected the stated obstacle as one of the top three impediments to successful workforce change management faced by their industry.
For a detailed discussion of each barrier, please refer to Part I of the Report. To the right of the table is the percentage of respondents who believe that future workforce planning to prepare for disruptive change is either a “somewhat high” or “very high” priority for their organization’s senior leadership. . Strategies The bar chart represents the share of survey respondents across industries located in the country or region in question who selected the stated measure as one of the top three future workforce and change management strategies they expect to undertake in their company. For a detailed discussion of each measure, please refer to Part I of the Report. To the right of the table is the percentage of respondents who stated that they were either “somewhat confident” or “highly confident” in the adequacy of the selected strategies. Industry Gender Gap Proï¬le Basic and Infrastructure Composition by Role and Level Workforce Disruption, 2015–2020 Percentage of Women Industry Average STABLE 58% 13% 35% HARDER NEUTRAL Employment outlook Skills stability Current share of women Gender wage gap Relative ease of recruitment, current Relative ease of recruitment, 2020 2% Current share of women Gender wage gap Relative ease of recruiting women, current 62% 9% 42% much harder 11% 19% harder neutral decline –2.18% 72% 9% 38% much harder harder stable 0.41% 44% 11% 64% harder neutral Skills stability decline –1.84% stable 0.73% Manufacturing and Production Assembly and Factory Workers Board Members harder 59% Employment outlook Job families 35% CEOs Main Job Families Relative ease of recruiting women, 2020 Chemical Processing Plant Operators Architecture and Engineering Chemical Engineers Current Expected in 2020 Civil Engineers Construction and Extraction Mining and Petroleum Extraction Workers Construction Laborers Management Business Services and Administration Managers 22% 13% 9% 29% 21% 17% Junior level Manufacturing, Mining and Construction Managers Middle level Senior level Junior level Middle level Senior level Job Family in Focus: Management Job family with largest share of women ⬆ ⬇ ⬆ 14% 20% 23% 27% Compensation Job security Work-life balance Line roles Staff roles Line roles Staff roles INDUSTRY GENDER GAP PROFILES WORKFORCE DISRUPTION, 2015–2020 The first section of each Industry Gender Gap Profile aims to provide a consolidated overview of the major expected developments over the coming years for each of the industry’s main job families and its workforce as a whole, with a particular focus on their implications for the evolution of the gender gap in the industry in question. Industry Gender Gap Proï¬le Basic and Infrastructure Companies’ Rationales for Gender Parity Companies’ Approaches to Leveraging Female Talent Fairness and equality 39% Barriers Enhance innovation 33% Unconscious bias among managers ............................................................. 50% External pressuresreputation 28% Lack of role models ....................................................................................
44% Government regulation 22% Lack of work-life balance ............................................................................ 42% Enhance decision-making 19% Lack of qualiï¬ed incoming talent ................................................................. 33% No rationale 17% Reflect gender composition of customer base 14% 10% Industry Average This section provides an aggregate summary of the relative outlook for all occupations and job functions mentioned by survey respondents from the industry in question.
All reported averages are simple averages across the job families and functions mentioned, i.e. results have not been weighted by the absolute number of workers employed in any given occupation. For a detailed explanation of each covered dimension, please see the next section, Main Job Families. Main Job Families The table gives a detailed overview of expected developments in the four job families most frequently mentioned by survey respondents from the industry in question.
Categorization of occupations and job families is based on the O*NET labour market information system. All reported values are simple averages across mentioned occupations within the job family, i.e. results have not been weighted by the absolute number of employees in any given occupation. The individual occupations listed underneath each job family are for illustrative purposes and report the two occupations in the job family most frequently cited by survey respondents from the industry in question. The table covers the following dimensions: • Employment outlook: The expected employment change for the job family, converted to a compound growth rate for the 2015–2020 period.
The thresholds for the qualitative scale are: +/–1%: “stable”; +/–1% to +/–5%: “growth / decline”; more than +/–5%: “strong growth / strong decline”. Perceive women’s economic power, aspirations as a driver of change Unclear career paths ................................................................................... 31% Women’s conï¬dence, aspirations ................................................................. 28% 35% Perceive attracting female talent as a key future workforce strategy 35% Perceive a gender wage gap for equally qualiï¬ed employees in the same role Strategies Set targets and measure progress 46% Build awareness of the beneï¬ts among managers 41% Development and leadership training of women 26% 30% Current 2020 Business-to-consumer 21% of total customers 18% 24% Current 24% No strategy 28% 2020 27% Offer, support flexible work 16% 32% Demonstrate leadership commitment Current 35% Promote work-life balance Female Share of Customer Base Business-to-business 58% of total customers 50% believe that gender parity is a leadership priority 22% Don’t know 58% 19% are conï¬dent strategies are suitable 2020 Business-to-government 20% of total customers • Skills stability: The share of an occupation’s five most frequently used skills that have been identified as such by industry respondents both for today and for the year 2020, aggregated across all occupations mentioned for the job family.
For a detailed description of each skill, please see Figure 9 and Table A1 in Part I of the Report. • Current share of women: The reported share of current female employees for all occupations mentioned as part of the job family, aggregated as a simple average, i.e. not weighted by the absolute number of employees in any given occupation. • Gender wage gap: The share of survey respondents from the industry in question who stated that there was a wage gap for equally qualified female employees in the same roles for the reported job family. Results have been aggregated as a simple average, i.e.
not weighted by the absolute number of employees in any given occupation. • Relative ease of recruiting women, current: The industry’s perceived current ease or difficulty of hiring competent and qualified female talent for a given role, relative to the perceived current ease or difficulty of hiring men, on a qualitative –2 (“much harder”) to +2 (“much easier”) scale, aggregated for the job family The Future of Jobs Report | 65 . as a simple average, i.e. not weighted by the absolute number of employees in any given occupation. The thresholds for the qualitative scale are: –2 to –1: “much harder”; –1 to –0.5: “harder”; –0.5 to +0.5: “neutral”; +0.5 to +1: “easier”; +1 to +2: “much easier”. • Relative ease of recruiting women, 2020: The industry’s expected future ease or difficulty of hiring competent and qualified female talent for a given role by the year 2020, relative to the expected future ease or difficulty of hiring men, aggregated across roles for the job family as a simple average. Job Family in Focus This part of the Industry Gender Gap Profile dives deep into the job quality of the industry’s job family that has the largest share of women. The arrows indicate the expected cumulative change in the three dimensions listed over the 2015–2020 period, as identified by survey respondents from the industry in question on a qualitative –2 (“strong decrease”) to +2 (“strong increase”) scale.
The three dimensions listed are based on a conceptual framework of job quality under development by the Organisation for Economic Co-operation and Development (OECD). • Compensation: The extent to which employment contributes to material living standards. • Job security: The risk of job loss and its consequences. • Work-life balance: The nature and content of work performed, working-time arrangements and workplace relationships. A comparison can be made with the industry’s overall job quality trends, as reported in the Industry Profile. COMPOSITION BY ROLE AND LEVEL The second section of the Industry Gender Gap Profile provides an overview of the size of the workforce gender gap in the industry today and its expected evolution by the year 2020. The first part of the section reports the current share of female CEOs and Board Members in the industry today. The second part of the section documents reported current and estimated future female representation at junior, middle and senior levels. Somewhat simplified, the bar chart can be understood as a talent pipeline, whereby the share of today’s junior level female talent partially translates to 2020’s share of mid-level talent and today’s mid-level female talent partially translates to 2020’s senior level talent. Large upward or downward divergences from this pattern indicate either expected leakages of female talent leaving the industry or the materialized benefits of intensified promotion, retention and external recruitment efforts.
Similarly, the difference between the share of female talent in 2020’s junior level cohort relative to the industry’s current junior 66 | The Future of Jobs Report level cohort provides a sense of the anticipated longer term evolution of the gender gap beyond 2020. The final part of the section documents reported current and estimated future female representation across line roles and staff roles. A line role is one that directly advances an organization in its core work, including, in particular, the production and sales functions. A staff role supports the organization with advisory and support functions, typically including human resources, accounting, public relations and legal roles.
Line managers generally have supervisory authority over those who report directly to them, whereas staff workers’ primary responsibility consists in creating, collecting and analysing information that flows to line workers in the form of advice. Experience in line management functions is generally considered a stepping stone to senior leadership roles within an organization and gender gaps in these roles have historically been especially pronounced. Conversely, certain staff functions, such as human resources, have historically experienced a reverse gender gap. COMPANIES’ RATIONALES FOR GENDER PARITY The bar chart represents the share of survey respondents from the industry in question who selected the stated rationale as one of the top three motivations for promoting gender parity in their company.
For a detailed discussion of each rationale, please refer to Part I of the Report. This section of each Industry Gender Gap Profile also reports the share of survey respondents from the industry in question who perceived women’s rising economic influence as one of the top three drivers of change affecting business models in their industry, who perceived attracting female talent as one of their company’s top three future workforce strategies, and who reported a gender wage gap for equally qualified employees across key roles in their industry. FEMALE SHARE OF CUSTOMER BASE The fourth section of each Industry Gender Gap Profile further examines two of the key economic driving forces and rationales behind companies’ growing commitment to women’s workforce integration: The rising economic power of women as consumers and companies’ desire to reflect their customer base in their workforce composition. Globally, women in 2013 controlled 64% of household spending and $30 trillion of consumer spending—a figure that is is predicted to rise by almost a third over the five years to 2018.3 The three bar charts in this section represent the reported current and expected future share of female clients across business-to-business, business-to-consumer and business-to-government market segments, including situations in which women are ultimately responsible for purchasing decisions, for example, as procurement managers, etc. The share of the corresponding market segment in the industry’s current overall revenue structure is reported at the bottom of each bar chart—providing further information about the dynamics through which trends and disruptions are affecting business models in the industry. Note that the customer base of the three market segments .
may not sum to 100% exactly in all instances due to omitted other market segments (for example, non-governmental organizations). COMPANIES’ APPROACHES TO LEVERAGING FEMALE TALENT The final section of each Industry Gender Gap Profile focuses on the measures and strategies for harnessing female talent and promoting workplace gender parity that companies intend to undertake, as well as the biggest perceived barriers to successfully carrying out these measures and the perceived degree of urgency and determination to tackle these issues prevalent across the industry in question. Barriers The table lists the biggest perceived barriers to promoting workplace gender parity and leveraging female talent, as measured by the share of survey respondents from the industry in question who selected the stated obstacle as one of the top three impediments faced by women in their industry. For a detailed discussion of each barrier, please refer to Part I of the Report. To the right of the table is the percentage of respondents who believe that tackling gender parity issues and closing the industry gender gap is either a “somewhat high” or “very high” priority for their organization’s senior leadership. Strategies The bar chart represents the share of survey respondents from the industry in question who selected the stated measure as one of the top three strategies for promoting workplace gender parity they expect to undertake in their company. For a detailed discussion of each measure, please refer to Part I of the Report.
To the right of the table is the percentage of respondents from the industry who stated that they were either “somewhat confident” or “highly confident” in the adequacy of the selected strategies. NOTES 1 www.onetonline.org. 2 Organisation for Economic Co-operation and Development (OECD), Job Quality, Directorate for Employment, Labour and Social Affairs – Employment, Labour and Social Affairs Committee, 16-17 October 2014. 3 See: Catalyst, Buying Power: Global Women, 2015, www.catalyst.org/ knowledge/buying-power-global-women; Silverstein, M. and K. Sayre, “The Female Economy”, Harvard Business Review, September 2009. The Future of Jobs Report | 67 .
68 | The Future of Jobs Report . List of Industry, Regional and Gender Gap Profiles Industry Profiles Industry Country and Regional Profiles Page Industry Industry Gender Gap Profiles Page Industry Page Basic and Infrastructure 72 Association of South East Asian Nations 92 Basic and Infrastructure 124 Consumer 74 Australia 94 Consumer 126 Energy 76 Brazil 96 Energy 128 Financial Services & Investors 78 China 98 Financial Services & Investors 130 Healthcare 80 France 100 Healthcare 132 Information and Communication Technology 82 Germany 102 Information and Communication Technology 134 Media, Entertainment and Information 84 Gulf Cooperation Council 104 Media, Entertainment and Information 136 Mobility 86 India 106 Mobility 138 Professional Services 88 Italy 108 Professional Services 140 Japan 110 Mexico 112 South Africa 114 Turkey 116 United Kingdom 118 United States 120 The Future of Jobs Report | 69 . . Industry Profiles . 72 | The Future of Jobs Report Industry Profile Basic and Infrastructure Drivers of Change Workforce Disruption Top Trends Impacting Business Models Industry Average Climate change, natural resources 49% Changing nature of work, flexible work 46% New energy supplies and technologies 38% Geopolitical volatility 28% Middle class in emerging markets 15% Robotics, autonomous transport 15% Longevity, ageing societies 13% Rapid urbanization 13% STABLE 1 2 13% HARD HARDER Employment outlook Skills stability Current share of female workforce Ease of recruitment, current Ease of recruitment, 2020 Main Job Families Expected change, 2015–2020 Job families 42% 42% 16% 2018– 2018– 2020 2020 Ease of recruitment, current Ease of recruitment, 2020 3 9% hard harder stable 0.73% 59% 11% hard harder Construction and Extraction Mining and Petroleum Extraction Workers Construction Laborers decline –2.18% 72% 9% hard harder Management stable Business Services and Administration Managers 0.41% Manufacturing, Mining and Construction Managers New energy supplies and technologies 62% Architecture and Engineering Chemical Engineers Civil Engineers Changing nature of work, flexible work 22% 2021– 2021– 2025 2025 Current share of female workforce decline –1.84% 44% 11% hard harder Expected Impact on Job Quality Impact 2015– Impact 2015– felt already 2017 felt already 2017 Skills stability Manufacturing and Production Assembly and Factory Workers Chemical Processing Plant Operators Expected Time to Impact on Employee Skills Climate change, natural resources 58% 44% Impact 2015– Impact 2015– felt already 2017 felt already 2017 28% 6% 2018– 2018– 2020 2020 2021– 2021– 2025 2025 40% 46% Impact 2015– Impact 2015– felt already 2017 felt already 2017 7% 7% 2018– 2018– 2020 2020 2021– 2021– 2025 2025 ⬆ Compensation ⬇ Job security ⬆ Work-life balance . Industry Profile Basic and Infrastructure Skills Forecast Change Management and Future Workforce Planning Skills Change, Overall Industry Barriers Current 2020 Technical skills Insufficient understanding of disruptive changes............................................ 59% Social skills Resource constraints.................................................................................... 54% Pressure from shareholders, short-term profitability....................................... 51% Cognitive abilities Workforce strategy not aligned to innovation strategy....................................
38% Resource management skills Insufficient priority by line management........................................................ 30% Process skills 53% believe future workforce planning is a leadership priority Insufficient priority by top management......................................................... 27% Content skills Complex problem solving skills Systems skills Strategies Invest in reskilling current employees 0.10 10 n growing skills demand 0.15 15 0.20 20 n stable skills demand 0.25 25 0.30 30 41% 38% 35% Attract foreign talent 35% Collaborate, other companies in industry 0.05 5 Support mobility and job rotation Target female talent 0.00 0 65% Collaborate, educational institutions Physical abilities 19% n declining skills demand Emerging Job Family in Focus: Business and Financial Operations Occupations Key skills for 2020 Skills family Human Resources Specialists Problem Sensitivity Cognitive Abilities Offer apprenticeships 14% Accountants and Auditors Active Learning Content Skills Target minorities’ talent 14% Investment Fund Managers Critical Thinking Process Skills Management of Financial Resources Resource Management Skills Persuasion Social Skills 73 | The Future of Jobs Report 36% are confident strategies are suitable .
74 | The Future of Jobs Report Industry Profile Consumer Drivers of Change Workforce Disruption Top Trends Impacting Business Models Industry Average Changing nature of work, flexible work 42% Middle class in emerging markets 42% Geopolitical volatility 25% Climate change, natural resources 21% New energy supplies and technologies 21% Women’s economic power, aspirations 21% Consumer ethics, privacy issues 21% Longevity, ageing societies 17% STABLE 1 2 27% HARD HARDER Employment outlook Skills stability Current share of female workforce Ease of recruitment, current Ease of recruitment, 2020 Main Job Families Expected change, 2015–2020 Skills stability Current share of female workforce Ease of recruitment, current Ease of recruitment, 2020 Manufacturing and Production decline Assembly and Factory Workers –3.57% Food Processing and Related Trades Workers 62% 22% neutral harder Sales and Related stable Shop Salespersons 0.83% Sales Representatives, Wholesale and Technical 78% 52% hard harder Business and Financial Operations Sales and Marketing Professionals Management and Organisation Analysts stable –0.88% 67% 44% hard harder Management decline General and Operations Managers –1.00% Business Services and Administration Managers 70% 22% hard neutral Job families Expected Time to Impact on Employee Skills Changing nature of work, flexible work 70% Middle class in emerging markets 3 Geopolitical volatility Expected Impact on Job Quality 30% 40% Impact 2015– Impact 2015– felt already 2017 felt already 2017 30% 2018– 2018– 2020 2020 40% 2021– 2021– 2025 2025 30% Impact 2015– Impact 2015– felt already 2017 felt already 2017 30% 2018– 2018– 2020 2020 33% 2021– 2021– 2025 2025 50% Impact 2015– Impact 2015– felt already 2017 felt already 2017 17% 2018– 2018– 2020 2020 2021– 2021– 2025 2025 ⬆ Compensation ⬇ Job security ⬌ Work-life balance . Industry Profile Consumer Skills Forecast Change Management and Future Workforce Planning Skills Change, Overall Industry Current 2020 Barriers Social skills Insufficient understanding of disruptive changes............................................ 60% Cognitive abilities Resource constraints.................................................................................... 55% Resource management skills Pressure from shareholders, short-term profitability....................................... 50% Technical skills Workforce strategy not aligned to innovation strategy....................................
50% Insufficient priority by top management......................................................... 20% Process skills 70% believe future workforce planning is a leadership priority No barriers.................................................................................................. 15% Systems skills Content skills Complex problem solving skills Strategies Physical abilities Invest in reskilling current employees 75% Support mobility and job rotation 45% Offer apprenticeships 35% Collaborate, educational institutions 30% Target female talent 25% Attract foreign talent 25% Collaborate, other companies across industries 20% Hire more short-term workers 20% 0.00 0 0.05 5 0.10 10 n growing skills demand 0.15 15 0.20 20 n stable skills demand 0.25 25 n declining skills demand Emerging Job Family in Focus: Architecture and Engineering Occupations Key skills for 2020 Skills bundle Biochemical Engineers Complex Problem Solving Complex Problem Solving Skills Materials Engineers Critical Thinking Process Skills Mechanical Engineers Cognitive Flexibility Cognitive Abilities Creativity Cognitive Abilities Mathematical Reasoning Cognitive Abilities 75 | The Future of Jobs Report 0.30 30 50% are confident strategies are suitable .
76 | The Future of Jobs Report Industry Profile Energy Drivers of Change Workforce Disruption Top Trends Impacting Business Models Industry Average New energy supplies and technologies 71% Climate change, natural resources 50% Changing nature of work, flexible work 46% Geopolitical volatility 29% STABLE 2 Current share of female workforce Ease of recruitment, current Ease of recruitment, 2020 Expected change, 2015–2020 Skills stability Current share of female workforce Ease of recruitment, current Ease of recruitment, 2020 growth 1.70% 65% 11% hard neutral 62% 22% neutral easier Management growth General and Operations Managers 2.06% Business Services and Administration Managers 92% 16% hard neutral 100% 15% easy harder Job families Architecture and Engineering Energy and Petroleum Engineers Electrotechnology Engineers Expected Time to Impact on Employee Skills 1 Skills stability Construction and Extraction Mining and Petroleum Extraction Workers Mining and Petroleum Plant Operators 13% New energy supplies and technologies NEUTRAL Manufacturing and Production decline Assembly and Factory Workers –3.11% Petroleum and Natural Gas Refining Plant Operators 13% Rapid urbanization HARD Main Job Families 13% Longevity, ageing societies 15% Employment outlook Young demographics in emerging markets 17% Women’s economic power, aspirations 70% Climate change, natural resources 3 Changing nature of work, flexible work Expected Impact on Job Quality 41% 35% Impact 2015– Impact 2015– felt already 2017 felt already 2017 18% 6% 2018– 2018– 2020 2020 2021– 2021– 2025 2025 42% 42% Impact 2015– Impact 2015– felt already 2017 felt already 2017 8% 8% 2018– 2018– 2020 2020 2021– 2021– 2025 2025 9% 73% Impact 2015– Impact 2015– felt already 2017 felt already 2017 18% 2018– 2018– 2020 2020 2021– 2021– 2025 2025 ⬆ Compensation decline –1.15% ⬆ Job security ⬆ Work-life balance . Industry Profile Energy Skills Forecast Change Management and Future Workforce Planning Skills Change, Overall Industry Current 2020 Barriers Social skills Insufficient understanding of disruptive changes............................................ 55% Technical skills Resource constraints.................................................................................... 55% Cognitive abilities Pressure from shareholders, short-term profitability....................................... 41% Resource management skills Don’t know..................................................................................................
36% Workforce strategy not aligned to innovation strategy.................................... 32% Process skills 80% believe future workforce planning is a leadership priority Insufficient priority by top management......................................................... 18% Complex problem solving skills Systems skills Physical abilities Strategies Content skills Invest in reskilling current employees 59% Support mobility and job rotation 50% Attract foreign talent 41% Target female talent 36% Offer apprenticeships 23% Collaborate, educational institutions 23% Collaborate, other companies in industry 18% Collaborate, other companies across industries 14% 0.00 0 0.05 5 0.10 10 n growing skills demand 0.15 15 0.20 20 n stable skills demand 0.25 25 n declining skills demand Emerging Job Family in Focus: Management Occupations Key skills for 2020 Skills family Managing Directors and Chief Executives Complex Problem Solving Complex Problem Solving Skills General and Operations Managers Critical Thinking Process Skills Business Services and Administration People Management Resource Management Skills Visualization Cognitive Abilities Time Management Resource Management Skills Managers 77 | The Future of Jobs Report 0.30 30 60% are confident strategies are suitable .
78 | The Future of Jobs Report Industry Profile Financial Services & Investors Drivers of Change Workforce Disruption Top Trends Impacting Business Models Industry Average Processing power, Big Data 44% Middle class in emerging markets 41% Mobile internet, cloud technology 41% Changing nature of work, flexible work 26% Geopolitical volatility 26% Young demographics in emerging markets 24% Consumer ethics, privacy issues 18% Sharing economy, crowdsourcing 18% GROWTH 1 2 29% HARD HARDER Employment outlook Skills stability Current share of female workforce Ease of recruitment, current Ease of recruitment, 2020 Main Job Families Expected change, 2015–2020 Job families 60% 27% 13% 2018– 2018– 2020 2020 Ease of recruitment, current Ease of recruitment, 2020 3 36% hard neutral growth 4.50% 60% 35% hard harder Sales and Related Securities and Finance Dealers and Brokers Sales and Purchasing Agents and Brokers stable –0.68% 70% 38% neutral neutral Management growth General and Operations Managers 2.20% Business Services and Administration Managers Mobile internet, cloud technology 63% Computer and Mathematical Data Analysts Information Security Analysts Middle class in emerging markets 50% 2021– 2021– 2025 2025 Current share of female workforce stable 0.79% 48% 26% hard neutral Expected Impact on Job Quality Impact 2015– Impact 2015– felt already 2017 felt already 2017 Skills stability Business and Financial Operations Financial and Investment Advisers Investment Fund Managers Expected Time to Impact on Employee Skills Processing power, Big Data 56% 29% Impact 2015– Impact 2015– felt already 2017 felt already 2017 21% 2018– 2018– 2020 2020 64% 2021– 2021– 2025 2025 36% Impact 2015– Impact 2015– felt already 2017 felt already 2017 2018– 2018– 2020 2020 2021– 2021– 2025 2025 ⬆ Compensation ⬆ Job security ⬆ Work-life balance . Industry Profile Financial Services & Investors Skills Forecast Change Management and Future Workforce Planning Skills Change, Overall Industry Current 2020 Barriers Social skills Insufficient understanding of disruptive changes............................................ 67% Cognitive abilities Workforce strategy not aligned to innovation strategy.................................... 53% Process skills Pressure from shareholders, short-term profitability....................................... 47% Resource management skills Resource constraints....................................................................................
43% Insufficient priority by top management......................................................... 27% Systems skills 67% believe future workforce planning is a leadership priority Insufficient priority by line management........................................................ 27% Content skills Technical skills Complex problem solving skills Strategies Physical abilities Invest in reskilling current employees 67% Support mobility and job rotation 47% Target female talent 30% Attract foreign talent 23% Offer apprenticeships 20% Collaborate, educational institutions 20% Collaborate, other companies across industries 17% Don’t know 17% 0.00 0 0.05 5 0.10 10 n growing skills demand 0.15 15 0.20 20 n stable skills demand 0.25 25 n declining skills demand Emerging Job Family in Focus: Computer and Mathematical Occupations Key skills for 2020 Skills family Information Security Analysts Complex Problem Solving Complex Problem Solving Skills Database and Network Professionals Programming Technical Skills Data Analysts Logical Reasoning Cognitive Abilities Critical Thinking Process Skills Creativity Cognitive Abilities 79 | The Future of Jobs Report 0.30 30 53% are confident strategies are suitable .
80 | The Future of Jobs Report Industry Profile Healthcare Drivers of Change Workforce Disruption Top Trends Impacting Business Models Industry Average Mobile internet, cloud technology 50% Middle class in emerging markets 40% Longevity, ageing societies 40% STABLE 71% 38% HARD HARDER Employment outlook Skills stability Current share of female workforce Ease of recruitment, current Ease of recruitment, 2020 Main Job Families Expected change, 2015–2020 Skills stability Current share of female workforce Ease of recruitment, current Ease of recruitment, 2020 stable 0.79% 85% 42% hard neutral Life, Physical, and Social Sciences stable Biologists and Geneticists –0.71% Chemists and Chemical Laboratory Scientists 100% 40% hard harder Sales and Related decline Shop Salespersons –1.82% Sales Representatives, Technical and Scientific 70% 63% neutral harder — 85% hard harder Job families Manufacturing and Production Chemical Processing Plant Operators Assembly and Factory Workers Expected Time to Impact on Employee Skills 1 Mobile internet, cloud technology 2 Middle class in emerging markets 3 Longevity, ageing societies Personal Care and Service Personal Care Aides Expected Impact on Job Quality 20% 40% Impact 2015– Impact 2015– felt already 2017 felt already 2017 40% 2018– 2018– 2020 2020 50% 2021– 2021– 2025 2025 50% Impact 2015– Impact 2015– felt already 2017 felt already 2017 50% 2018– 2018– 2020 2020 2021– 2021– 2025 2025 50% Impact 2015– Impact 2015– felt already 2017 felt already 2017 2018– 2018– 2020 2020 2021– 2021– 2025 2025 ⬆ Compensation — ⬆ Job security ⬆ Work-life balance . Industry Profile Healthcare Skills Forecast Change Management and Future Workforce Planning Skills Change, Overall Industry Current 2020 Barriers Cognitive abilities Resource constraints.................................................................................... 75% Social skills Insufficient understanding of disruptive changes............................................ 50% Process skills Workforce strategy not aligned to innovation strategy.................................... 50% Technical skills Pressure from shareholders, short-term profitability.......................................
50% Don’t know.................................................................................................. 50% Resource management skills 80% believe future workforce planning is a leadership priority Insufficient priority by top management......................................................... 25% Content skills Complex problem solving skills Systems skills Strategies Physical abilities Invest in reskilling current employees 83% Support mobility and job rotation 50% Attract foreign talent 42% Target minorities’ talent 33% Collaborate, educational institutions 25% Collaborate, other companies in industry 25% Target female talent 17% Don’t know 17% 0.00 0 0.05 5 n growing skills demand 0.10 10 0.15 15 0.20 20 n stable skills demand 0.25 25 n declining skills demand Emerging Job Family in Focus: Business and Financial Operations Occupations Key skills for 2020 Skills family Regulatory and Government Problem Sensitivity Cognitive Abilities Active Learning Content Skills Critical Thinking Process Skills Management of Financial Resources Resource Management Skills Persuasion Social Skills Associate Professionals Sales and Marketing Professionals 81 | The Future of Jobs Report 0.30 30 50% are confident strategies are suitable .
82 | The Future of Jobs Report Industry Profile Information and Communication Technology Drivers of Change Workforce Disruption Top Trends Impacting Business Models Industry Average Mobile internet, cloud technology 69% Processing power, Big Data 44% Changing nature of work, flexible work 36% Internet of Things 33% Consumer ethics, privacy issues 31% New energy supplies and technologies 17% Longevity, ageing societies 14% Sharing economy, crowdsourcing 11% STABLE 1 2 21% HARD HARDER Employment outlook Skills stability Current share of female workforce Ease of recruitment, current Ease of recruitment, 2020 Main Job Families Skills stability Current share of female workforce Ease of recruitment, current Ease of recruitment, 2020 Computer and Mathematical growth Database and Network Professionals 1.74% Software and Applications Developers and Analysts 63% 20% hard harder Sales and Related Telemarketers Sales Representatives, Wholesale and Technical growth 2.14% 64% 44% neutral neutral Installation and Maintenance decline Mechanics and Machinery Repairers –1.19% Electronics and Telecommunications Installers and Repairers 54% 9% hard neutral Architecture and Engineering Electrotechnology Engineers Architects and Surveyors 77% 7% hard harder Expected change, 2015–2020 Job families Expected Time to Impact on Employee Skills Mobile internet, cloud technology 65% Processing power, Big Data 3 Changing nature of work, flexible work Expected Impact on Job Quality 76% 20% Impact 2015– Impact 2015– felt already 2017 felt already 2017 4% 2018– 2018– 2020 2020 56% 2021– 2021– 2025 2025 31% Impact 2015– Impact 2015– felt already 2017 felt already 2017 13% 2018– 2018– 2020 2020 23% 2021– 2021– 2025 2025 54% Impact 2015– Impact 2015– felt already 2017 felt already 2017 23% 2018– 2018– 2020 2020 2021– 2021– 2025 2025 ⬆ Compensation growth 4.12 ⬆ Job security ⬆ Work-life balance . Industry Profile Information and Communication Technology Skills Forecast Change Management and Future Workforce Planning Skills Change, Overall Industry Current 2020 Barriers Technical skills Resource constraints.................................................................................... 74% Social skills Insufficient understanding of disruptive changes............................................ 48% Cognitive abilities Pressure from shareholders, short-term profitability....................................... 42% Process skills Workforce strategy not aligned to innovation strategy....................................
39% Insufficient priority by top management......................................................... 23% Resource management skills 73% believe future workforce planning is a leadership priority Insufficient priority by line management........................................................ 16% Content skills Complex problem solving skills Systems skills Strategies Physical abilities Invest in reskilling current employees 81% Support mobility and job rotation 35% Collaborate, educational institutions 35% Hire more short-term workers 26% Offer apprenticeships 23% Attract foreign talent 19% Target minorities’ talent 16% Target female talent 16% 0.00 0 0.05 5 0.10 10 n growing skills demand 0.15 15 0.20 20 n stable skills demand 0.25 25 0.30 30 n declining skills demand Emerging Job Family in Focus: Computer and Mathematical Occupations Key skills for 2020 Skills family Software and Applications Developers and Analysts Complex Problem Solving Complex Problem Solving Skills Information Security Analysts Critical Thinking Process Skills Data Analysts Cognitive Flexibility Cognitive Abilities Mathematical Reasoning Cognitive Abilities Active Learning 83 | The Future of Jobs Report Content Skills 60% are confident strategies are suitable .
84 | The Future of Jobs Report Industry Profile Media, Entertainment and Information Drivers of Change Workforce Disruption Top Trends Impacting Business Models Industry Average Mobile internet, cloud technology 57% Processing power, Big Data 36% Changing nature of work, flexible work 36% GROWTH 73% 30% HARD HARDER Employment outlook Skills stability Current share of female workforce Ease of recruitment, current Ease of recruitment, 2020 Main Job Families Skills stability Current share of female workforce Ease of recruitment, current Ease of recruitment, 2020 Arts, Design, Entertainment, Sports, and Media stable Advertising and Public Relations Professionals –0.59% Telecommunications and Broadcasting Technicians 66% 49% very hard harder Computer and Mathematical strong growth Data Analysts 6.94% Software and Applications Developers and Analysts 88% 23% hard harder Sales and Related growth Cashiers and Ticket Clerks 2.69% Door-To-Door Sales Workers, News and Street Vendors 86% 39% neutral neutral Management General and Operations Managers Business Services and Administration Managers 67% 12% hard neutral Expected change, 2015–2020 Job families Expected Time to Impact on Employee Skills 1 Mobile internet, cloud technology 2 Processing power, Big Data 3 Changing nature of work, flexible work Expected Impact on Job Quality 75% 25% Impact 2015– Impact 2015– felt already 2017 felt already 2017 40% 2018– 2018– 2020 2020 2021– 2021– 2025 2025 60% Impact 2015– Impact 2015– felt already 2017 felt already 2017 60% 2018– 2018– 2020 2020 2021– 2021– 2025 2025 40% Impact 2015– Impact 2015– felt already 2017 felt already 2017 2018– 2018– 2020 2020 2021– 2021– 2025 2025 ⬆ Compensation growth 1.67% ⬇ Job security ⬆ Work-life balance . Industry Profile Media, Entertainment and Information Skills Forecast Change Management and Future Workforce Planning Skills Change, Overall Industry Current 2020 Barriers Social skills Pressure from shareholders, short-term profitability....................................... 64% Process skills Workforce strategy not aligned to innovation strategy.................................... 50% Resource management skills Resource constraints.................................................................................... 36% Technical skills Insufficient understanding of disruptive changes............................................
36% Insufficient priority by line management........................................................ 21% Cognitive abilities 69% believe future workforce planning is a leadership priority Don’t know.................................................................................................. 14% Content skills Complex problem solving skills Strategies Systems skills Invest in reskilling current employees 0.10 10 n growing skills demand 0.20 20 n stable skills demand 0.25 25 0.30 30 n declining skills demand Emerging Job Family in Focus: Management Occupations Key skills for 2020 Skills family Managing Directors and Chief Executives Critical Thinking Process Skills Organisational Development Specialists People Management Resource Management Skills General and Operations Managers Complex Problem Solving Complex Problem Solving Skills Monitoring Self and Others Process Skills Management of Financial Resources Resource Management Skills 85 | The Future of Jobs Report Collaborate, educational institutions 38% 31% 23% Collaborate, other companies across industries 0.15 15 46% Hire more short-term workers 0.05 5 Target female talent Offer apprenticeships 0.00 0 77% 23% Support mobility and job rotation 15% Attract foreign talent 15% 46% are confident strategies are suitable .
86 | The Future of Jobs Report Industry Profile Mobility Drivers of Change Workforce Disruption Top Trends Impacting Business Models Industry Average Middle class in emerging markets 39% Changing nature of work, flexible work 35% Climate change, natural resources 32% Robotics, autonomous transport 29% New energy supplies and technologies 26% Mobile internet, cloud technology 16% Geopolitical volatility 16% Artificial Intelligence 16% STABLE 1 2 16% HARD HARDER Employment outlook Skills stability Current share of female workforce Ease of recruitment, current Ease of recruitment, 2020 Main Job Families Expected change, 2015–2020 Job families 58% 34% 8% 2018– 2020 Ease of recruitment, current Ease of recruitment, 2020 3 18% neutral harder growth 4.83% 62% 13% hard harder Transportation and Logistics Supply Chain and Logistics Specialists Transportation Attendants and Conductors growth 3.13% 63% 13% hard harder Sales and Related decline Sales and Marketing Professionals –1.88% Sales Representatives, Wholesale and Technical Climate change, natural resources 66% Architecture and Engineering Electrotechnology Engineers Industrial and Production Engineers Changing nature of work, flexible work 45% 2021– 2025 Current share of female workforce decline –1.43% 4% 16% hard neutral Expected Impact on Job Quality Impact 2015– felt already 2017 Skills stability Manufacturing and Production Assembly and Factory Workers Sheet and Structural Metal Workers Expected Time to Impact on Employee Skills Middle class in emerging markets 61% 37% Impact 2015– Impact 2015– felt already 2017 felt already 2017 18% 2018– 2018– 2020 2020 70% 2021– 2021– 2025 2025 20% Impact 2015– Impact 2015– felt already 2017 felt already 2017 10% 2018– 2018– 2020 2020 2021– 2021– 2025 2025 ⬆ Compensation ⬇ Job security ⬆ Work-life balance . Industry Profile Mobility Skills Forecast Change Management and Future Workforce Planning Skills Change, Overall Industry Current 2020 Barriers Social skills Insufficient understanding of disruptive changes............................................ 58% Technical skills Resource constraints.................................................................................... 50% Cognitive abilities Pressure from shareholders, short-term profitability....................................... 38% Resource management skills Insufficient priority by line management........................................................
33% Insufficient priority by top management......................................................... 21% Process skills 71% believe future workforce planning is a leadership priority Workforce strategy not aligned to innovation strategy.................................... 17% Content skills Complex problem solving skills Systems skills Strategies Physical abilities Invest in reskilling current employees 83% Support mobility and job rotation 54% Collaborate, educational institutions 29% Offer apprenticeships 29% Attract foreign talent 25% Target female talent 21% Hire more short-term workers 17% Target minorities’ talent 13% 0.00 0 0.05 5 0.10 10 n growing skills demand 0.15 15 0.20 20 n stable skills demand 0.25 25 n declining skills demand Emerging Job Families in Focus: Computer and Mathematical & Arts and Design Occupations Key skills for 2020 Skills family Data Analysts Creativity Cognitive Abilities Software and Applications Developers and Analysts Active Learning Content Skills Commercial and Industrial Designers Time Management Resource Management Skills Negotiation Social Skills Programming Technical Skills 87 | The Future of Jobs Report 0.30 30 67% are confident strategies are suitable .
88 | The Future of Jobs Report Industry Profile Professional Services Drivers of Change Workforce Disruption Top Trends Impacting Business Models Industry Average Changing nature of work, flexible work 65% Processing power, Big Data 43% Mobile internet, cloud technology 38% Sharing economy, crowdsourcing 25% Consumer ethics, privacy issues 20% Internet of Things 15% Women’s economic power, aspirations 15% Middle class in emerging markets 13% STABLE 1 2 30% HARD HARDER Employment outlook Skills stability Current share of female workforce Ease of recruitment, current Ease of recruitment, 2020 Main Job Families Expected change, 2015–2020 Skills stability Current share of female workforce Ease of recruitment, current Ease of recruitment, 2020 stable 0.33% 77% 48% neutral harder Computer and Mathematical strong growth Data Analysts 5.31% Software and Applications Developers and Analysts 54% 17% hard harder Management growth General and Operations Managers 1.00% Business Services and Administration Managers 65% 29% hard neutral Sales and Related Sales and Marketing Professionals Real Estate Sales Agents 54% 56% hard harder Job families Business and Financial Operations Management and Organisation Analysts Human Resources Specialists Expected Time to Impact on Employee Skills Changing nature of work, flexible work 67% Processing power, Big Data 3 Mobile internet, cloud technology Expected Impact on Job Quality 56% 32% Impact 2015– Impact 2015– felt already 2017 felt already 2017 8% 2018– 2018– 2020 2020 4% 2021– 2021– 2025 2025 62% 38% Impact 2015– Impact 2015– felt already 2017 felt already 2017 60% 2018– 2018– 2020 2020 2021– 2021– 2025 2025 40% Impact 2015– Impact 2015– felt already 2017 felt already 2017 2018– 2018– 2020 2020 2021– 2021– 2025 2025 ⬆ Compensation decline –3.21% ⬇ Job security ⬆ Work-life balance . Industry Profile Professional Services Skills Forecast Change Management and Future Workforce Planning Skills Change, Overall Industry Current 2020 Barriers Social skills Insufficient understanding of disruptive changes............................................ 51% Cognitive abilities Resource constraints.................................................................................... 49% Process skills Workforce strategy not aligned to innovation strategy.................................... 37% Content skills Pressure from shareholders, short-term profitability.......................................
35% Insufficient priority by top management......................................................... 23% Resource management skills 61% believe future workforce planning is a leadership priority Don’t know.................................................................................................. 19% Technical skills Complex problem solving skills Systems skills Strategies Physical abilities Invest in reskilling current employees 56% Support mobility and job rotation 40% Offer apprenticeships 33% Collaborate, other companies across industries 28% Target female talent 21% Collaborate, educational institutions 14% Collaborate, other companies in industry 14% Hire more virtual workers 12% 0.00 0 0.05 5 0.10 10 n growing skills demand 0.15 15 0.20 20 n stable skills demand 0.25 25 0.30 30 n declining skills demand Emerging Job Family in Focus: Computer and Mathematical Occupations Key skills for 2020 Skills family Mathematicians, Actuaries and Statisticians Complex Problem Solving Complex Problem Solving Skills Geospatial Information Scientists and Technologists Problem Sensitivity Cognitive Abilities Data Analysts Logical Reasoning Cognitive Abilities Mathematical Reasoning Cognitive Abilities ICT Literacy Content Skills 89 | The Future of Jobs Report 58% are confident strategies are suitable .
. Country and Regional Profiles . 92 | The Future of Jobs Report Regional Profile Association of Southeast Asian Nations Workforce Disruption Sample Overview Main Industries Employment Outlook by Main Job Family CURRENT Current workforce (thousands) 2020 Employment outlook, 2015–2020 Local share of recruitment, specialists Ease of recruitment, overall Local share of recruitment, specialists Ease of recruitment, overall Consumer — — easy — harder Energy — — hard — easier Financial Services & Investors — — easy 51–75% easier Professional Services — — very hard — harder Industry Industries 20,120 Farming, Fishing and Forestry 12,525 Transportation and Logistics 11,579 Sales and Related 10,317 Office and Administrative 6,907 Occupation types Mass Employment Assembly and Factory Workers Strategic/Specialist Financial Analysts 18% 18% 41% 24% Up to 500 500– 5,000 5,000– 50,000 More than 50,000 New and Emerging Business Services and Administration Managers Country/region Sample average Country/region hard harder neutral easy hard neutral harder — — hard hard Business, Legal and Financial Computer, Mathematical and Science 2,712 Arts, Design, Entertainment, Sports, and Media 2,700 Education and Training 2,195 Architecture and Engineering Sample average neutral Installation and Maintenance 3,604 2020 CURRENT Construction and Extraction 4,945 Ease of Recruitment Management 5,372 Number of Employees Manufacturing and Production 9,113 n Professional Services..........................................15% n Energy...............................................................15% n Financial Services & Investors.............................15% n Consumer..........................................................14% n Others................................................................41% 9,342 N/A l Growing l Declining l Stable Not shown: Social and Protective Services (7,226), Healthcare Practitioners (2,419), Hospitality and Food Related (7,046), Personal Care and Service (10,862) . Regional Profile Association of Southeast Asian Nations Drivers of Change Change Management and Future Workforce Planning Top Trends Impacting Industries Mobile internet, cloud technology Changing nature of work, flexible work 38% Processing power, Big Data 38% New energy supplies and technologies 38% Middle class in emerging markets 31% Climate change, natural resources 31% Geopolitical volatility 23% Consumer ethics, privacy issues Barriers 46% 15% Pressure from shareholders, short-term profitability.............................. 40% Resource constraints........................................................................... 40% Workforce strategy not aligned to innovation strategy........................... 35% Insufficient understanding of disruptive changes...................................
25% Don’t know......................................................................................... 20% 64% believe future workforce planning is a leadership priority Strategies Support mobility and job rotation 67% 17% 17% Impact already felt 2015– 2017 2018– 2020 93 | The Future of Jobs Report 2021– 2025 31% Hire more short-term workers 31% Collaborate, educational institutions 23% Target female talent 15% Target minorities’ talent 8% Collaborate, other companies in industry Expected Impact on Employment Outlook: Negative 46% Invest in reskilling current employees Expected Time to Impact on Employee Skills 54% Attract foreign talent Disruption in Focus: Mobile internet, Cloud Technology 8% 50% are confident strategies are suitable . 94 | The Future of Jobs Report Country Profile Australia Workforce Disruption Sample Overview Main Industries Employment Outlook by Main Job Family CURRENT Current workforce (thousands) 2020 Employment outlook, 2015–2020 Local share of recruitment, specialists Ease of recruitment, overall Local share of recruitment, specialists Ease of recruitment, overall Professional Services stable 0.91% 76–100% hard 51–75% harder Basic and Infrastructure decline –1.67% — easy — neutral Energy growth 76–100% hard 76–100% harder 76–100% hard 76–100% harder Industry Industries 1,452 Management 1,052 Sales and Related Number of Employees Occupation types Mass Employment Petroleum and Natural Gas Refining Plant Operators Strategic/Specialist Sales Representatives, Wholesale and Technical Products 9% 13% 43% 35% Up to 500 500– 5,000 5,000– 50,000 More than 50,000 New and Emerging Robotics Engineers Sample average Country/region hard harder neutral hard hard harder Construction and Extraction Installation and Maintenance Farming, Fishing and Forestry 455 Education and Training Arts, Design, Entertainment, Sports, and Media Architecture and Engineering Sample average neutral Computer, Mathematical and Science 386 Country/region Manufacturing and Production 416 2020 CURRENT Business, Legal and Financial 457 Ease of Recruitment 685 458 n Professional Services..........................................27% n Basic and Infrastructure......................................26% n Energy...............................................................22% n Information and Communication Technology.........16% n Others..................................................................9% Transportation and Logistics 550 growth 3.57% 897 593 Information and Communication Technology Office and Administrative 683 3.57% 962 harder — — hard hard N/A l Growing l Declining l Stable Not shown: Social and Protective Services (782), Healthcare Practitioners (343), Hospitality and Food Related (634), Personal Care and Service (761) . Country Profile Australia Drivers of Change Change Management and Future Workforce Planning Top Trends Impacting Industries Changing nature of work, flexible work Climate change, natural resources 38% New energy supplies and technologies 38% Mobile internet, cloud technology 29% Processing power, Big Data 24% Geopolitical volatility 24% Sharing economy, crowdsourcing 19% Women’s economic power, aspirations Barriers 52% 14% Resource constraints........................................................................... 93% Pressure from shareholders, short-term profitability.............................. 71% Workforce strategy not aligned to innovation strategy........................... 57% Insufficient understanding of disruptive changes...................................
57% Insufficient priority by top management................................................ 57% 45% believe future workforce planning is a leadership priority Strategies Invest in reskilling current employees 60% 40% Impact already felt 2015– 2017 95 | The Future of Jobs Report 2018– 2020 2021– 2025 33% Collaborate, other companies across industries 28% Target minorities’ talent 22% Collaborate, other companies in industry 22% Collaborate, educational institutions 17% Attract foreign talent Expected Impact on Employment Outlook: Neutral 33% Target female talent Expected Time to Impact on Employee Skills 61% Support mobility and job rotation Disruption in Focus: Changing Nature of Work, Flexible Work 6% 55% are confident strategies are suitable . 96 | The Future of Jobs Report Country Profile Brazil Workforce Disruption Sample Overview Main Industries Employment Outlook by Main Job Family CURRENT Current workforce (thousands) 2020 Employment outlook, 2015–2020 Local share of recruitment, specialists Ease of recruitment, overall Local share of recruitment, specialists Ease of recruitment, overall Professional Services stable –0.71% 76–100% hard — harder Mobility growth 3.08% 76–100% hard 76–100% harder Consumer decline –1.11% 76–100% hard 76–100% neutral Basic and Infrastructure decline –2.00% — easy — neutral Information and Communication Technology strong decline — neutral — harder Energy strong decline –6.00% — neutral — neutral Industry 18,329 Farming, Fishing and Forestry n Professional Services..........................................24% n Mobility..............................................................23% n Consumer..........................................................14% n Basic and Infrastructure......................................11% n Energy.................................................................8% n Information and Communication Technology...........8% n Others................................................................14% Number of Employees Occupation types Mass Employment Assembly and Factory Workers Strategic/Specialist Software and Applications Developers and Analysts 3% 16% 34% 47% Up to 500 500– 5,000 5,000– 50,000 More than 50,000 New and Emerging Biochemical Engineers Country/region Sample average Country/region hard neutral neutral hard hard harder harder — — hard 7,146 Office and Administrative 7,042 Manufacturing and Production 5,510 Management 5,237 Construction and Extraction Installation and Maintenance Business, Legal and Financial Computer, Mathematical and Science 1,376 Arts, Design, Entertainment, Sports, and Media 1,371 Education and Training Architecture and Engineering Sample average neutral Sales and Related 1,115 2020 CURRENT 8,062 1,830 Ease of Recruitment Transportation and Logistics 4,075 –5.00% 9,175 2,507 Industries hard N/A l Growing l Declining l Stable Not shown: Social and Protective Services (4,699), Healthcare Practitioners (1,227), Hospitality and Food Related (4,992), Personal Care and Service (8,257) . Country Profile Brazil Drivers of Change Change Management and Future Workforce Planning Top Trends Impacting Industries Middle class in emerging markets Changing nature of work, flexible work 42% Processing power, Big Data 27% New energy supplies and technologies 27% Mobile internet, cloud technology 24% Climate change, natural resources 21% Sharing economy, crowdsourcing 18% Consumer ethics, privacy issues Barriers 45% 12% Insufficient understanding of disruptive changes................................... 55% Workforce strategy not aligned to innovation strategy........................... 48% Pressure from shareholders, short-term profitability.............................. 48% Resource constraints...........................................................................
34% Insufficient priority by top management................................................ 28% 69% believe future workforce planning is a leadership priority Strategies Invest in reskilling current employees 73% 20% Impact already felt 2015– 2017 97 | The Future of Jobs Report 7% 2018– 2020 2021– 2025 28% Collaborate, educational institutions 28% Attract foreign talent 28% Target minorities’ talent 17% Collaborate, other companies across industries 14% Offer apprenticeships Expected Impact on Employment Outlook: Negative 52% Target female talent Expected Time to Impact on Employee Skills 59% Support mobility and job rotation Disruption in Focus: Middle class in emerging markets 14% 52% are confident strategies are suitable . 98 | The Future of Jobs Report Country Profile China Workforce Disruption Sample Overview Main Industries Employment Outlook by Main Job Family CURRENT Current workforce (thousands) 2020 Employment outlook, 2015–2020 Local share of recruitment, specialists Ease of recruitment, overall Local share of recruitment, specialists Ease of recruitment, overall — Architecture and Engineering Professional Services decline –1.48% 51–75% hard 51–75% harder — Arts, Design, Entertainment, Sports, and Media Mobility growth 3.06% 51–75% hard 76–100% harder — Business and Financial Operations — Social and Protective Services Basic and Infrastructure stable 0.50% 76–100% hard 26–50% harder — Computer and Mathematical Energy growth 2.06% 26–50% hard 76–100% neutral — Construction and Extraction — Education and Training Financial Services & Investors growth 76–100% hard 26–50% harder — Farming, Fishing and Forestry Consumer stable –0.56% 51–75% hard 51–75% harder — Healthcare Practitioners — Hospitality and Food Related — Installation and Maintenance — Life, physical, and social sciences — Legal — Management — Manufacturing and Production — Office and Administrative — Personal Care and Service — Sales and Related — Transportation and Logistics Industry Industries n Professional Services..........................................20% n Mobility..............................................................15% n Basic and Infrastructure......................................15% n Energy...............................................................14% n Financial Services & Investors.............................13% n Consumer............................................................9% n Others................................................................14% Number of Employees 2.06% Ease of Recruitment 2020 CURRENT Occupation types 16% 41% 31% 500– 5,000 5,000– 50,000 More than 50,000 Country/region Sample average hard hard harder neutral Strategic/Specialist Sales Representatives, Wholesale and Technical Products Up to 500 Sample average Mass Employment Assembly and Factory Workers 12% Country/region hard hard harder harder New and Emerging Financial and Investment Advisers — — hard hard N/A l Growing l Declining l Stable . Country Profile China Drivers of Change Change Management and Future Workforce Planning Top Trends Impacting Industries Middle class in emerging markets Changing nature of work, flexible work 33% Processing power, Big Data 31% Mobile internet, cloud technology 29% Internet of Things 21% Sharing economy, crowdsourcing 21% Climate change, natural resources 19% Consumer ethics, privacy issues Barriers 38% 17% Insufficient understanding of disruptive changes................................... 64% Resource constraints........................................................................... 55% Workforce strategy not aligned to innovation strategy........................... 50% Pressure from shareholders, short-term profitability..............................
39% Insufficient priority by top management................................................ 34% 61% believe future workforce planning is a leadership priority Strategies Invest in reskilling current employees 55% 25% 20% Impact already felt 2015– 2017 2018– 2020 99 | The Future of Jobs Report 2021– 2025 20% Collaborate, educational institutions 18% Target minorities’ talent 18% Offer apprenticeships 18% Attract foreign talent 11% Collaborate, other companies across industries Expected Impact on Employment Outlook: Neutral 36% Target female talent Expected Time to Impact on Employee Skills 48% Support mobility and job rotation Disruption in Focus: Middle class in emerging markets 11% 50% are confident strategies are suitable . 100 | The Future of Jobs Report Country Profile France Workforce Disruption Sample Overview Main Industries Employment Outlook by Main Job Family CURRENT Current workforce (thousands) 2020 Employment outlook, 2015–2020 Local share of recruitment, specialists Ease of recruitment, overall Local share of recruitment, specialists Ease of recruitment, overall Professional Services decline –3.53% 76–100% hard — harder Mobility growth — hard — harder 76–100% neutral — neutral n Professional Services..........................................62% n Mobility..............................................................12% n Financial Services & Investors.............................12% n Others................................................................14% Number of Employees Ease of Recruitment Occupation types Up to 500 500– 5,000 58% 32% 5,000– 50,000 More than 50,000 Sample average Country/region 2,151 Management Business, Legal and Financial Manufacturing and Production Farming, Fishing and Forestry Computer, Mathematical and Science Construction and Extraction hard neutral neutral hard hard harder harder New and Emerging Sales Representatives, Wholesale and Technical Products — — neutral hard Arts, Design, Entertainment, Sports, and Media 874 Education and Training 840 Installation and Maintenance 693 Architecture and Engineering Sample average neutral Strategic/Specialist Sales and Marketing Professionals 5% Country/region Mass Employment Sales and Marketing Professionals 5% Office and Administrative 920 2020 CURRENT 2,209 1,120 growth 0.00% Transportation and Logistics 1,334 Financial Services & Investors 2,453 1,618 1.25% Sales and Related 1,181 Industries 2,464 1,753 Industry N/A l Growing l Declining l Stable Not shown: Social and Protective Services (1,745), Healthcare Practitioners (849), Hospitality and Food Related (1,420), Personal Care and Service (1,843) . Country Profile France Drivers of Change Change Management and Future Workforce Planning Top Trends Impacting Industries Changing nature of work, flexible work Mobile internet, cloud technology 33% Sharing economy, crowdsourcing 33% Middle class in emerging markets 27% Processing power, Big Data 27% New energy supplies and technologies 27% Young demographics in emerging markets 20% Consumer ethics, privacy issues Barriers 60% 20% Workforce strategy not aligned to innovation strategy........................... 67% Don’t know......................................................................................... 67% Resource constraints........................................................................... 50% Insufficient understanding of disruptive changes...................................
42% Pressure from shareholders, short-term profitability.............................. 42% 75% believe future workforce planning is a leadership priority Strategies Invest in reskilling current employees 62% 13% 25% Impact already felt 2015– 2017 2018– 2020 101 | The Future of Jobs Report 2021– 2025 25% Support mobility and job rotation 25% Offer apprenticeships 25% Collaborate, educational institutions 25% Attract foreign talent 25% Collaborate, other companies in industry Expected Impact on Employment Outlook: Negative 33% Target female talent Expected Time to Impact on Employee Skills 33% Collaborate, other companies across industries Disruption in Focus: Changing Nature of Work, Flexible Work 8% 58% are confident strategies are suitable . 102 | The Future of Jobs Report Country Profile Germany Workforce Disruption Sample Overview Main Industries Employment Outlook by Main Job Family CURRENT Current workforce (thousands) 2020 Employment outlook, 2015–2020 Local share of recruitment, specialists Ease of recruitment, overall Local share of recruitment, specialists Ease of recruitment, overall Basic and Infrastructure growth 1.88% 26–50% hard 51–75% harder Mobility decline –3.67% 51–75% hard 51–75% harder Professional Services stable 0.56% 76–100% very hard 26–50% harder Energy decline –1.00% 26–50% easy 51–75% neutral stable 51–75% neutral 26–50% harder — hard — neutral n Basic and Infrastructure......................................21% n Mobility..............................................................21% n Professional Services..........................................17% n Energy...............................................................13% n Financial Services & Investors.............................10% n Information and Communication Technology...........8% n Others................................................................12% Number of Employees Financial Services & Investors Information and Communication Technology Ease of Recruitment 2020 CURRENT Occupation types Country/region Sample average Country/region hard harder neutral Strategic/Specialist Sales Representatives, Wholesale and Technical Products hard hard harder harder New and Emerging Sales Representatives, Wholesale and Technical Products — — hard 8% 22% 46% Up to 500 500– 5,000 5,000– 50,000 More than 50,000 Transportation and Logistics 2,883 Business, Legal and Financial 2,622 Manufacturing and Production 2,282 Management 2,244 Construction and Extraction Computer, Mathematical and Science Installation and Maintenance Arts, Design, Entertainment, Sports, and Media 1,373 Education and Training 1,184 Farming, Fishing and Forestry Architecture and Engineering hard Mass Employment Assembly and Factory Workers 24% 3,447 Sample average neutral Sales and Related 1,075 growth 3.33% 4,460 1,482 –0.63% Office and Administrative 1,841 Industries 4,480 1,867 Industry N/A l Growing l Declining l Stable Not shown: Social and Protective Services (2,569), Healthcare Practitioners (1,390), Hospitality and Food Related (1,978), Personal Care and Service (2,471) . Country Profile Germany Drivers of Change Change Management and Future Workforce Planning Top Trends Impacting Industries Mobile internet, cloud technology Middle class in emerging markets 32% Climate change, natural resources 29% Changing nature of work, flexible work 23% New energy supplies and technologies 23% Consumer ethics, privacy issues 23% Longevity, ageing societies 16% Processing power, Big Data Barriers 32% 16% Insufficient understanding of disruptive changes................................... 70% Resource constraints........................................................................... 63% Pressure from shareholders, short-term profitability.............................. 52% Workforce strategy not aligned to innovation strategy...........................
33% Insufficient priority by line management............................................... 26% 74% believe future workforce planning is a leadership priority Strategies Invest in reskilling current employees Expected Impact on Employment Outlook: Neutral 60% 40% Impact already felt 2015– 2017 103 | The Future of Jobs Report 30% Attract foreign talent Expected Time to Impact on Employee Skills 56% Support mobility and job rotation Disruption in Focus: Mobile internet, cloud technology 30% Collaborate, educational institutions 22% Target female talent 19% Target minorities’ talent 19% Collaborate, other companies in industry 15% Collaborate, vocational training and cert. providers 15% 2018– 2020 2021– 2025 52% are confident strategies are suitable .
104 | The Future of Jobs Report Regional Profile Gulf Cooperation Council Workforce Disruption Sample Overview Main Industries Employment Outlook by Main Job Family CURRENT Current workforce (thousands) 2020 Employment outlook, 2015–2020 Local share of recruitment, specialists Ease of recruitment, overall Local share of recruitment, specialists Ease of recruitment, overall Consumer stable 0.00% 51–75% hard 26–50% neutral Information and Communication Technology stable 0.56% 51–75% hard 26–50% hard Professional Services decline –2.73% — hard — hard Financial Services & Investors growth 3.75% 26–50% hard 26–50% hard Energy growth 51–75% neutral 76–100% easier 26–50% hard 0–25% easier Industry 1,165 Sales and Related n Consumer..........................................................19% n Information and Communication Technology.........17% n Professional Services..........................................15% n Financial Services & Investors.............................14% n Energy...............................................................14% n Basic and Infrastructure......................................11% n Others................................................................10% Number of Employees Basic and Infrastructure decline –1.43% 2020 CURRENT Occupation types 10% 60% 30% 500– 5,000 5,000– 50,000 More than 50,000 Sample average Country/region hard neutral neutral hard hard neutral harder — — very hard hard Office and Administrative 700 Management 603 Farming, Fishing and Forestry 528 Manufacturing and Production 484 Business, Legal and Financial Computer, Mathematical and Science Construction and Extraction Education and Training 271 Arts, Design, Entertainment, Sports, and Media 258 Installation and Maintenance 225 Architecture and Engineering Sample average hard Strategic/Specialist General and Operations Managers Up to 500 Country/region Mass Employment Assembly and Factory Workers 771 275 Ease of Recruitment Transportation and Logistics 365 2.14% 957 332 Industries New and Emerging Managing Directors and Chief Executives N/A l Growing l Declining l Stable Not shown: Social and Protective Services (1,383), Healthcare Practitioners (238), Hospitality and Food Related (1,288), Personal Care and Service (1,226) . Regional Profile Gulf Cooperation Council Drivers of Change Change Management and Future Workforce Planning Top Trends Impacting Industries New energy supplies and technologies Mobile internet, cloud technology 44% Changing nature of work, flexible work 33% Young demographics in emerging markets 33% Climate change, natural resources 22% Consumer ethics, privacy issues 22% Women’s economic power, aspirations 22% Geopolitical volatility Barriers 56% 22% Resource constraints........................................................................... 56% Workforce strategy not aligned to innovation strategy........................... 56% Insufficient understanding of disruptive changes................................... 33% No barriers.........................................................................................
33% Insufficient priority by top management................................................ 22% 67% believe future workforce planning is a leadership priority Strategies Invest in reskilling current employees Expected Impact on Employment Outlook: Positive 60% Impact already felt 40% 2015– 2017 105 | The Future of Jobs Report 2018– 2020 2021– 2025 44% Attract foreign talent Expected Time to Impact on Employee Skills 44% Collaborate, educational institutions Disruption in Focus: New Energy Supplies and Technologies 33% Support mobility and job rotation 22% Target female talent 22% Offer apprenticeships 22% Collaborate, other companies in industry 11% Collaborate, vocational training and cert. providers 11% 89% are confident strategies are suitable .
106 | The Future of Jobs Report Country Profile India Workforce Disruption Sample Overview Main Industries Employment Outlook by Main Job Family CURRENT Current workforce (thousands) 2020 Employment outlook, 2015–2020 Local share of recruitment, specialists Ease of recruitment, overall Local share of recruitment, specialists Ease of recruitment, overall — Architecture and Engineering Information and Communication Technology stable –0.38% 51–75% neutral 51–75% neutral — Arts, Design, Entertainment, Sports, and Media Mobility growth 1.15% 76–100% neutral 76–100% neutral — Business and Financial Operations — Community, Social and Protective Services Energy growth 1.36% 76–100% hard 76–100% harder — Computer and Mathematical Basic and Infrastructure growth 3.13% 76–100% hard 51–75% harder — Construction and Extraction — Education and Training strong growth 51–75% easy 26–50% harder — Farming, Fishing and Forestry strong growth 76–100% 5.00% hard 51–75% neutral — Healthcare Practitioners — Hospitality and Food Related — Installation and Maintenance — Life, physical, and social sciences — Legal — Management — Manufacturing and Production — Office and Administrative — Personal Care and Service — Sales and Related — Transportation and Logistics Industry Industries n Information and Communication Technology.........27% n Mobility..............................................................18% n Energy...............................................................15% n Basic and Infrastructure......................................14% n Professional Services..........................................11% n Consumer............................................................6% n Others................................................................10% Number of Employees Professional Services 5.00% Consumer Ease of Recruitment 2020 CURRENT Occupation types Mass Employment Database and Network Professionals Strategic/Specialist Software and Applications Developers and Analysts 2% 20% 41% 37% Up to 500 500– 5,000 5,000– 50,000 More than 50,000 New and Emerging Data Analysts Country/region Sample average Country/region Sample average neutral hard neutral neutral hard hard harder harder — — hard hard N/A l Growing l Declining l Stable . Country Profile India Drivers of Change Change Management and Future Workforce Planning Top Trends Impacting Industries Changing nature of work, flexible work Climate change, natural resources 40% Processing power, Big Data 33% Mobile internet, cloud technology 27% Middle class in emerging markets 27% New energy supplies and technologies 23% Young demographics in emerging markets 17% Women’s economic power, aspirations Barriers 43% 17% Insufficient understanding of disruptive changes................................... 68% Resource constraints........................................................................... 48% Pressure from shareholders, short-term profitability.............................. 40% Workforce strategy not aligned to innovation strategy...........................
28% Insufficient priority by line management............................................... 24% 76% believe future workforce planning is a leadership priority Strategies Invest in reskilling current employees 8% 69% 23% Impact already felt 2015– 2017 2018– 2020 107 | The Future of Jobs Report 2021– 2025 28% Target female talent 24% Attract foreign talent 12% Target minorities’ talent 12% Offer apprenticeships 8% Collaborate, other companies across industries Expected Impact on Employment Outlook: Positive 48% Collaborate, educational institutions Expected Time to Impact on Employee Skills 48% Support mobility and job rotation Disruption in Focus: Changing Nature of Work, Flexible Work 8% 60% are confident strategies are suitable . 108 | The Future of Jobs Report Country Profile Italy Workforce Disruption Sample Overview Main Industries Employment Outlook by Main Job Family CURRENT Current workforce (thousands) 2020 Employment outlook, 2015–2020 Local share of recruitment, specialists Ease of recruitment, overall Local share of recruitment, specialists Ease of recruitment, overall Mobility stable 0.18% 76–100% hard 51–75% easier Basic and Infrastructure stable –0.58% 51–75% hard 51–75% neutral Consumer decline –1.82% 76–100% hard 51–75% harder Information and Communication Technology stable 0.56% 76–100% hard — harder Energy growth 1.67% 51–75% hard 26–50% easier Industries n Mobility..............................................................29% n Basic and Infrastructure......................................26% n Consumer..........................................................24% n Information and Communication Technology.........10% n Energy.................................................................6% n Others..................................................................5% 2,411 Sales and Related 2,304 Office and Administrative 2,025 Transportation and Logistics 1,574 Manufacturing and Production 1,339 Construction and Extraction 1,306 Business, Legal and Financial 1,143 Management 1,097 Industry Installation and Maintenance 980 Number of Employees 873 Ease of Recruitment 2020 CURRENT Occupation types Mass Employment Assembly and Factory Workers Strategic/Specialist Electrotechnology Engineers 27% 52% 9% 12% Up to 500 500– 5,000 5,000– 50,000 More than 50,000 New and Emerging Materials Engineers Country/region Sample average Country/region hard neutral neutral hard hard neutral harder — — very hard hard Computer, Mathematical and Science 683 Arts, Design, Entertainment, Sports, and Media 645 Education and Training 510 Architecture and Engineering Sample average neutral Farming, Fishing and Forestry N/A l Growing l Declining l Stable Not shown: Social and Protective Services (1,511), Healthcare Practitioners (632), Hospitality and Food Related (1,303), Personal Care and Service (1,706) . Country Profile Italy Drivers of Change Change Management and Future Workforce Planning Top Trends Impacting Industries Changing nature of work, flexible work New energy supplies and technologies 46% Climate change, natural resources 42% Middle class in emerging markets 23% Geopolitical volatility 23% Robotics, autonomous transport 23% Mobile internet, cloud technology 15% Consumer ethics, privacy issues Barriers 46% 15% Pressure from shareholders, short-term profitability.............................. 46% Resource constraints........................................................................... 38% Insufficient understanding of disruptive changes................................... 33% Workforce strategy not aligned to innovation strategy...........................
29% Insufficient priority by top management................................................ 29% 63% believe future workforce planning is a leadership priority Strategies Invest in reskilling current employees 25% 58% 17% Impact already felt 2015– 2017 2018– 2020 109 | The Future of Jobs Report 2021– 2025 38% Support mobility and job rotation 29% Offer apprenticeships 17% Collaborate, other companies in industry 17% Hire more short-term workers 17% Target female talent Expected Impact on Employment Outlook: Negative 42% Collaborate, educational institutions Expected Time to Impact on Employee Skills 50% Attract foreign talent Disruption in Focus: Changing Nature of Work, Flexible Work 13% 46% are confident strategies are suitable . 110 | The Future of Jobs Report Country Profile Japan Workforce Disruption Sample Overview Main Industries Employment Outlook by Main Job Family CURRENT Current workforce (thousands) 2020 Employment outlook, 2015–2020 Local share of recruitment, specialists Ease of recruitment, overall Local share of recruitment, specialists Ease of recruitment, overall Information and Communication Technology growth 2.78% 51–75% hard 76–100% harder Professional Services stable 0.00% 76–100% hard 51–75% harder Basic and Infrastructure stable 0.20% 51–75% hard 51–75% harder Media, Entertainment and Information stable 0.00% 51–75% very hard 76–100% harder Financial Services & Investors decline 76–100% hard 76–100% harder 76–100% hard 76–100% harder n Information and Communication Technology.........22% n Professional Services..........................................19% n Basic and Infrastructure......................................19% n Media, Entertainment and Information...................9% n Consumer............................................................8% n Financial Services & Investors...............................8% n Others................................................................15% Number of Employees Consumer 2020 CURRENT Occupation types 14% 48% 14% Up to 500 500– 5,000 5,000– 50,000 More than 50,000 Sample average Country/region hard harder neutral hard hard harder — hard 4,694 Manufacturing and Production 3,091 Farming, Fishing and Forestry 2,926 Construction and Extraction 2,546 Installation and Maintenance Business, Legal and Financial Management Computer, Mathematical and Science 1,671 Education and Training Arts, Design, Entertainment, Sports, and Media Architecture and Engineering harder — Transportation and Logistics Sample average hard Strategic/Specialist Electrotechnology Engineers 24% Country/region Mass Employment Sales Representatives, Wholesale and Technical Products 6,431 1,428 Ease of Recruitment Office and Administrative 1,507 decline –4.44% 8,201 2,173 –3.00% Sales and Related 2,308 Industries 8,246 2,443 Industry hard New and Emerging Personal Care Workers in Health Services N/A l Growing l Declining l Stable Not shown: Social and Protective Services (4,683), Healthcare Practitioners (1,230), Hospitality and Food Related (4,205), Personal Care and Service (4,507) . Country Profile Japan Drivers of Change Change Management and Future Workforce Planning Top Trends Impacting Industries Changing nature of work, flexible work Mobile internet, cloud technology 47% Internet of Things 26% Longevity, ageing societies 21% Middle class in emerging markets 18% Climate change, natural resources 16% Processing power, Big Data 16% New energy supplies and technologies Barriers 50% 16% Resource constraints........................................................................... 69% Workforce strategy not aligned to innovation strategy........................... 49% Insufficient understanding of disruptive changes................................... 43% Pressure from shareholders, short-term profitability..............................
43% Don’t know......................................................................................... 29% 86% believe future workforce planning is a leadership priority Strategies Invest in reskilling current employees Expected Impact on Employment Outlook: Neutral 24% 41% 29% 6% Impact already felt 2015– 2017 2018– 2020 2021– 2025 111 | The Future of Jobs Report 34% Attract foreign talent Expected Time to Impact on Employee Skills 54% Support mobility and job rotation Disruption in Focus: Changing Nature of Work, Flexible Work 23% Target female talent 23% Offer apprenticeships 14% Collaborate, other companies across industries 14% Collaborate, other companies in industry 11% Hire more short-term workers 9% 43% are confident strategies are suitable . 112 | The Future of Jobs Report Country Profile Mexico Workforce Disruption Sample Overview Main Industries Employment Outlook by Main Job Family CURRENT Current workforce (thousands) 2020 Employment outlook, 2015–2020 Local share of recruitment, specialists Ease of recruitment, overall Local share of recruitment, specialists Ease of recruitment, overall Consumer stable 0.00% 76–100% hard 76–100% harder Mobility growth 1.54% 51–75% hard 26–50% harder Financial Services & Investors growth 4.00% 76–100% hard 51–75% harder Basic and Infrastructure growth 2.92% 76–100% neutral — harder Information and Communication Technology growth 76–100% hard — easier Energy growth 1.88% 76–100% hard 76–100% easier n Consumer..........................................................27% n Mobility..............................................................18% n Basic and Infrastructure......................................12% n Financial Services & Investors.............................12% n Information and Communication Technology...........8% n Energy.................................................................7% n Others................................................................16% Number of Employees Ease of Recruitment 2020 CURRENT Occupation types Mass Employment Assembly and Factory Workers Strategic/Specialist Business Services and Administration Managers 12% 18% 39% 31% Up to 500 500– 5,000 5,000– 50,000 More than 50,000 New and Emerging Food Processing and Related Trades Workers Country/region Sample average Country/region hard neutral neutral hard hard harder harder — — hard Farming, Fishing and Forestry 4,489 Sales and Related 3,773 Manufacturing and Production 3,255 Office and Administrative 2,566 Construction and Extraction 2,257 Management Installation and Maintenance Business, Legal and Financial Computer, Mathematical and Science Sample average neutral 5,038 1,031 2.50% Transportation and Logistics 1,388 Industries 5,536 1,815 Industry hard 775 Education and Training 770 Arts, Design, Entertainment, Sports, and Media 633 Architecture and Engineering N/A l Growing l Declining l Stable Not shown: Social and Protective Services (3,565), Healthcare Practitioners (681), Hospitality and Food Related (3,834), Personal Care and Service (5,886) . Country Profile Mexico Drivers of Change Change Management and Future Workforce Planning Top Trends Impacting Industries Changing nature of work, flexible work Mobile internet, cloud technology 33% Middle class in emerging markets 31% Climate change, natural resources 25% Processing power, Big Data 25% New energy supplies and technologies 19% Geopolitical volatility 17% Internet of Things Barriers 42% 14% Insufficient understanding of disruptive changes................................... 63% Pressure from shareholders, short-term profitability.............................. 57% Resource constraints........................................................................... 53% Workforce strategy not aligned to innovation strategy...........................
30% Don’t know......................................................................................... 27% 80% believe future workforce planning is a leadership priority Strategies Invest in reskilling current employees Expected Impact on Employment Outlook: Positive 38% 46% 8% 8% Impact already felt 2015– 2017 2018– 2020 2021– 2025 113 | The Future of Jobs Report 30% Support mobility and job rotation Expected Time to Impact on Employee Skills 40% Target female talent Disruption in Focus: Changing Nature of Work, Flexible Work 27% Offer apprenticeships 23% Collaborate, educational institutions 23% Target minorities’ talent 20% Attract foreign talent 17% Collaborate, other companies across industries 13% 63% are confident strategies are suitable . 114 | The Future of Jobs Report Country Profile South Africa Workforce Disruption Sample Overview Main Industries Employment Outlook by Main Job Family CURRENT Current workforce (thousands) 2020 Employment outlook, 2015–2020 Local share of recruitment, specialists Ease of recruitment, overall Local share of recruitment, specialists Ease of recruitment, overall Financial Services & Investors growth 1.25% 76–100% hard 51–75% neutral Basic and Infrastructure decline –3.79% 51–75% hard 51–75% harder Information and Communication Technology decline –3.75% 76–100% hard 76–100% neutral Mobility growth 2.78% 76–100% hard — harder Professional Services decline — easy — harder — neutral — neutral Industry Industries n Financial Services & Investors.............................35% n Basic and Infrastructure......................................28% n Information and Communication Technology.........11% n Mobility..............................................................10% n Professional Services............................................7% n Consumer............................................................5% n Others..................................................................5% 1,609 Sales and Related 1,562 Transportation and Logistics 1,530 Management 1,444 Office and Administrative 1,152 Manufacturing and Production Number of Employees decline –2.00% 2020 CURRENT Occupation types 0% 11% 49% 40% 500– 5,000 5,000– 50,000 More than 50,000 Sample average Country/region hard neutral neutral hard hard neutral harder — — very hard hard Farming, Fishing and Forestry Installation and Maintenance Business, Legal and Financial Computer, Mathematical and Science 219 Arts, Design, Entertainment, Sports, and Media 186 Education and Training 137 Architecture and Engineering Sample average hard Strategic/Specialist Sales and Marketing Professionals Up to 500 Country/region Mass Employment Assembly and Factory Workers 705 259 Ease of Recruitment Construction and Extraction 458 Consumer 896 652 –1.25% New and Emerging Data Analysts N/A l Growing l Declining l Stable Not shown: Social and Protective Services (808), Healthcare Practitioners (218), Hospitality and Food Related (894), Personal Care and Service (1,596) . Country Profile South Africa Drivers of Change Change Management and Future Workforce Planning Top Trends Impacting Industries Processing power, Big Data Changing nature of work, flexible work 34% Middle class in emerging markets 31% Mobile internet, cloud technology 25% Geopolitical volatility 25% Climate change, natural resources 22% Sharing economy, crowdsourcing 22% New energy supplies and technologies Barriers 38% 19% Insufficient understanding of disruptive changes................................... 68% Resource constraints........................................................................... 52% Workforce strategy not aligned to innovation strategy........................... 44% Pressure from shareholders, short-term profitability..............................
36% Insufficient priority by line management............................................... 28% 60% believe future workforce planning is a leadership priority Strategies Invest in reskilling current employees Expected Impact on Employment Outlook: Negative 50% 50% Impact already felt 2015– 2017 115 | The Future of Jobs Report 32% Support mobility and job rotation Expected Time to Impact on Employee Skills 56% Target female talent Disruption in Focus: Processing power, Big Data 32% Attract foreign talent 16% Offer apprenticeships 12% Collaborate, educational institutions 12% Target minorities’ talent 12% Collaborate, other companies across industries 2018– 2020 2021– 2025 4% 44% are confident strategies are suitable . 116 | The Future of Jobs Report Country Profile Turkey Workforce Disruption Sample Overview Main Industries Employment Outlook by Main Job Family CURRENT Current workforce (thousands) 2020 Employment outlook, 2015–2020 Local share of recruitment, specialists Ease of recruitment, overall Local share of recruitment, specialists Ease of recruitment, overall Media, Entertainment and Information stable 0.00% 51–75% very hard 51–75% harder Financial Services & Investors growth 4.62% 51–75% hard 26–50% neutral Consumer growth 4.00% 76–100% hard 76–100% harder Mobility growth 1.00% 76–100% hard 76–100% harder 2,450 Transportation and Logistics 2,003 Manufacturing and Production 1,979 Sales and Related 1,636 Management Office and Administrative 1,594 n Media, Entertainment and Information.................31% n Financial Services & Investors.............................29% n Mobility..............................................................10% n Consumer..........................................................10% n Others................................................................20% Farming, Fishing and Forestry Construction and Extraction 1,318 Industries 5,053 1,628 Industry Installation and Maintenance 665 Number of Employees 582 Ease of Recruitment 2020 CURRENT Occupation types Up to 500 6% 500– 5,000 35% 35% 5,000– 50,000 More than 50,000 Sample average Country/region hard neutral neutral very hard hard harder harder — — hard hard Computer, Mathematical and Science 446 Education and Training 406 Arts, Design, Entertainment, Sports, and Media 380 Architecture and Engineering Sample average hard Strategic/Specialist Assembly and Factory Workers 24% Country/region Mass Employment Assembly and Factory Workers Business, Legal and Financial New and Emerging Nanosystems Engineers N/A l Growing l Declining l Stable Not shown: Social and Protective Services (1,554), Healthcare Practitioners (334), Hospitality and Food Related (1,596), Personal Care and Service (2,309) . Country Profile Turkey Drivers of Change Change Management and Future Workforce Planning Top Trends Impacting Industries Changing nature of work, flexible work Mobile internet, cloud technology 33% Middle class in emerging markets 33% Geopolitical volatility 33% Young demographics in emerging markets 27% Climate change, natural resources 20% Processing power, Big Data 20% Sharing economy, crowdsourcing Barriers 47% 20% Insufficient understanding of disruptive changes................................... 50% Resource constraints........................................................................... 50% Pressure from shareholders, short-term profitability.............................. 50% Workforce strategy not aligned to innovation strategy...........................
50% Don’t know......................................................................................... 36% 64% believe future workforce planning is a leadership priority Strategies Invest in reskilling current employees Expected Impact on Employment Outlook: Positive 14% 57% 29% Impact already felt 2015– 2017 2018– 2020 117 | The Future of Jobs Report 36% Target female talent Expected Time to Impact on Employee Skills 71% Support mobility and job rotation Disruption in Focus: Changing Nature of Work, Flexible Work 29% Offer apprenticeships 29% Collaborate, educational institutions 21% Attract foreign talent 14% Hire more short-term workers 14% Collaborate, other companies across industries 2021– 2025 50% are confident strategies are suitable 7% . 118 | The Future of Jobs Report Country Profile United Kingdom Workforce Disruption Sample Overview Main Industries Employment Outlook by Main Job Family CURRENT Current workforce (thousands) 2020 Employment outlook, 2015–2020 Local share of recruitment, specialists Ease of recruitment, overall Local share of recruitment, specialists Ease of recruitment, overall Professional Services stable 0.16% 51–75% neutral 26–50% neutral Financial Services & Investors stable 0.00% 76–100% neutral 51–75% harder Media, Entertainment and Information growth 2.50% 76–100% hard 51–75% harder Information and Communication Technology growth 1.36% 51–75% hard 51–75% harder Energy growth 26–50% hard 0–25% harder — neutral — neutral n Professional Services..........................................32% n Financial Services & Investors.............................16% n Media, Entertainment and Information.................15% n Information and Communication Technology.........14% n Energy...............................................................12% n Basic and Infrastructure........................................4% n Others..................................................................6% Number of Employees Basic and Infrastructure decline –1.00% Ease of Recruitment 2020 CURRENT Occupation types Mass Employment Client Information and Customer Service Workers Strategic/Specialist Lawyers 10% 13% 32% 45% Up to 500 500– 5,000 5,000– 50,000 More than 50,000 New and Emerging Software and Applications Developers and Analysts Country/region Sample average Country/region hard neutral neutral hard hard harder — neutral 2,445 Office and Administrative 2,111 Transportation and Logistics 1,981 Business, Legal and Financial 1,808 Computer, Mathematical and Science 1,463 Manufacturing and Production Education and Training Arts, Design, Entertainment, Sports, and Media Architecture and Engineering 1,192 Construction and Extraction harder — Sales and Related Sample average neutral 2,846 1,198 2.69% Management 1,241 Industries 3,599 1,394 Industry hard 935 Installation and Maintenance 900 Farming, Fishing and Forestry N/A l Growing l Declining l Stable Not shown: Social and Protective Services (2,294), Healthcare Practitioners (1,002), Hospitality and Food Related (1,855), Personal Care and Service (2,218) . Country Profile United Kingdom Drivers of Change Change Management and Future Workforce Planning Top Trends Impacting Industries Mobile internet, cloud technology Changing nature of work, flexible work 45% Processing power, Big Data 40% Middle class in emerging markets 30% Geopolitical volatility 23% New energy supplies and technologies 17% Climate change, natural resources 15% Internet of Things Barriers 49% 13% Insufficient understanding of disruptive changes................................... 62% Resource constraints........................................................................... 55% Pressure from shareholders, short-term profitability.............................. 45% Workforce strategy not aligned to innovation strategy...........................
36% Insufficient priority by top management................................................ 24% 76% believe future workforce planning is a leadership priority Strategies Invest in reskilling current employees 78% 17% Impact already felt 2015– 2017 119 | The Future of Jobs Report 4% 2018– 2020 2021– 2025 36% Offer apprenticeships 19% Collaborate, educational institutions 17% Attract foreign talent 17% Target minorities’ talent 12% Hire more short-term workers Expected Impact on Employment Outlook: Neutral 38% Target female talent Expected Time to Impact on Employee Skills 48% Support mobility and job rotation Disruption in Focus: Mobile internet, cloud technology 5% 57% are confident strategies are suitable . 120 | The Future of Jobs Report Country Profile United States Workforce Disruption Sample Overview Main Industries Employment Outlook by Main Job Family CURRENT Current workforce (thousands) 2020 Employment outlook, 2015–2020 Local share of recruitment, specialists Ease of recruitment, overall Local share of recruitment, specialists Ease of recruitment, overall Professional Services growth 1.77% 51–75% neutral 26–50% harder Financial Services & Investors growth 2.76% 51–75% hard 26–50% neutral Information and Communication Technology stable 0.43% 26–50% neutral 26–50% neutral Basic and Infrastructure stable 0.21% 51–75% hard 26–50% harder Healthcare decline 51–75% hard 26–50% harder 26–50% hard 26–50% neutral Industry Industries 22,766 Office and Administrative 15,423 Sales and Related Number of Employees Energy decline –2.35% 2020 CURRENT Occupation types Country/region Sample average Country/region hard neutral neutral Strategic/Specialist Data Analysts hard hard harder harder New and Emerging Data Analysts — — hard hard Mass Employment Assembly and Factory Workers 12% 12% 36% 40% Up to 500 500– 5,000 5,000– 50,000 More than 50,000 9,216 Education and Training 9,158 Management 8,834 Business, Legal and Financial Construction and Extraction Installation and Maintenance Computer, Mathematical and Science 2,624 Arts, Design, Entertainment, Sports, and Media 2,533 Architecture and Engineering 972 Farming, Fishing and Forestry Sample average neutral Manufacturing and Production 5,379 Ease of Recruitment 9,230 6,502 –2.14% Transportation and Logistics 5,681 n Professional Services..........................................21% n Financial Services & Investors.............................17% n Information and Communication Technology.........13% n Basic and Infrastructure......................................13% n Healthcare.........................................................11% n Energy.................................................................9% n Others................................................................15% 9,749 N/A l Growing l Declining l Stable Not shown: Social and Protective Services (5,909), Healthcare Practitioners (8,236), Hospitality and Food Related (12468), Personal Care and Service (11,623) . Country Profile United States Drivers of Change Change Management and Future Workforce Planning Top Trends Impacting Industries Changing nature of work, flexible work Mobile internet, cloud technology 34% Middle class in emerging markets 33% Processing power, Big Data 29% Climate change, natural resources 23% New energy supplies and technologies 21% Geopolitical volatility 20% Sharing economy, crowdsourcing Barriers 38% 16% Insufficient understanding of disruptive changes................................... 60% Resource constraints........................................................................... 55% Pressure from shareholders, short-term profitability.............................. 48% Workforce strategy not aligned to innovation strategy...........................
40% Insufficient priority by line management............................................... 22% 74% believe future workforce planning is a leadership priority Strategies Invest in reskilling current employees 45% 45% 6% Impact already felt 2015– 2017 2018– 2020 121 | The Future of Jobs Report 2021– 2025 26% Attract foreign talent 21% Collaborate, educational institutions 21% Target minorities’ talent 16% Collaborate, other companies across industries 14% Offer apprenticeships Expected Impact on Employment Outlook: Neutral 38% Target female talent Expected Time to Impact on Employee Skills 51% Support mobility and job rotation Disruption in Focus: Changing Nature of Work, Flexible Work 12% 56% are confident strategies are suitable . . Industry Gender Gap Profiles . 124 | The Future of Jobs Report Industry Gender Gap Profile Basic and Infrastructure Workforce Disruption, 2015–2020 Composition by Role and Level Industry Average Percentage of Women STABLE 58% 13% 35% Employment outlook Skills stability Current share of women Gender wage gap HARDER NEUTRAL Relative ease of recruitment, current Relative ease of recruitment, 2020 2% CEOs Main Job Families Employment outlook Job families Manufacturing and Production Assembly and Factory Workers Skills stability Current share of women Gender wage gap Relative ease of recruiting women, current 62% 9% 42% much harder harder stable 0.73% 59% 11% 19% harder neutral decline –2.18% 72% 9% 38% much harder harder stable 0.41% 44% 11% 64% harder Board Members Relative ease of recruiting women, 2020 decline –1.84% 35% neutral Chemical Processing Plant Operators Architecture and Engineering Chemical Engineers Current Expected in 2020 Civil Engineers Construction and Extraction Mining and Petroleum Extraction Workers Construction Laborers Management Business Services and Administration Managers 22% Job Family in Focus: Management ⬆ Job family with largest share of women Compensation ⬇ Job security ⬆ Work-life balance 13% 9% 29% 21% 17% Junior level Manufacturing, Mining and Construction Managers Middle level Senior level Junior level Middle level Senior level 14% 20% 23% 27% Line roles Staff roles Line roles Staff roles . Industry Gender Gap Profile Basic and Infrastructure Companies’ Rationales for Gender Parity Companies’ Approaches to Leveraging Female Talent Fairness and equality 39% Barriers Enhance innovation 33% Unconscious bias among managers.............................................................. 50% External pressuresreputation 28% Lack of role models..................................................................................... 44% Government regulation 22% Lack of work-life balance............................................................................. 42% Enhance decision-making 19% Lack of qualified incoming talent..................................................................
33% No rationale 17% Reflect gender composition of customer base 14% 10% Perceive women’s economic power, aspirations as a driver of change Women’s confidence, aspirations.................................................................. 28% 35% Perceive attracting female talent as a key future workforce strategy 35% Perceive a gender wage gap for equally qualified employees in the same role Strategies Set targets and measure progress 46% Build awareness of the benefits among managers 41% Development and leadership training of women 28% 26% 30% 18% 24% Current 2020 Current 2020 Business-to-consumer 21% of total customers Business-to-government 20% of total customers 24% No strategy 2020 27% Offer, support flexible work 16% 32% Demonstrate leadership commitment Current 35% Promote work-life balance 125 | The Future of Jobs Report believe that gender parity is a leadership priority Unclear career paths.................................................................................... 31% Female Share of Customer Base Business-to-business 58% of total customers 50% 22% Don’t know 19% 58% are confident strategies are suitable .
126 | The Future of Jobs Report Industry Gender Gap Profile Consumer Workforce Disruption, 2015–2020 Composition by Role and Level Industry Average Percentage of Women STABLE 70% 27% 49% HARDER HARDER Employment outlook Skills stability Current share of women Gender wage gap Relative ease of recruitment, current Relative ease of recruitment, 2020 10% CEOs Main Job Families Employment outlook Job families Manufacturing and Production Assembly and Factory Workers Skills stability Current share of women Gender wage gap Relative ease of recruiting women, current 62% 22% 43% harder harder stable 0.83% 78% 52% 47% harder harder stable –0.88% 67% 44% 83% harder neutral decline –1.00% 70% 22% 50% harder Board Members Relative ease of recruiting women, 2020 decline –3.57% 21% harder Food Processing and Related Trades Workers Sales and Related Shop Salespersons Current Expected in 2020 Sales Representatives, Wholesale and Technical Business and Financial Operations Sales and Marketing Professionals Management and Organisation Analysts Management General and Operations Managers 33% Job Family in Focus: Sales and Related ⬆ Job family with largest share of women Compensation ⬇ Job security ⬌ Work-life balance 26% 16% 37% 33% 24% Junior level Business Services and Administration Managers Middle level Senior level Junior level Middle level Senior level 31% 37% 34% 41% Line roles Staff roles Line roles Staff roles . Industry Gender Gap Profile Consumer Companies’ Rationales for Gender Parity Companies’ Approaches to Leveraging Female Talent Fairness and equality 75% Barriers Reflect gender composition of customer base 35% Lack of work-life balance............................................................................. 70% Expand talent pool 30% Unconscious bias among managers.............................................................. 55% Enhance innovation 20% Lack of role models..................................................................................... 40% External pressuresreputation 20% Unclear career paths....................................................................................
30% Enhance decision-making 15% Financial returns 10% 21% Perceive women’s economic power, aspirations as a driver of change Societal pressures....................................................................................... 25% 25% Perceive attracting female talent as a key future workforce strategy 49% Perceive a gender wage gap for equally qualified employees in the same role Strategies Promote work-life balance 50% Development and leadership training of women 45% Build awareness of the benefits among managers 40% Set targets and measure progress 18% 47% 49% 11% 15% 2020 Current 2020 Current 2020 Business-to-consumer 65% of total customers Business-to-government 11% of total customers 25% Offer, support flexible work 14% 30% Demonstrate leadership commitment Current 30% Transparent career paths, salary structures 127 | The Future of Jobs Report believe that gender parity is a leadership priority Women’s confidence, aspirations.................................................................. 30% Female Share of Customer Base Business-to-business 24% of total customers 60% 25% Support women’s integration into the value chain 25% 55% are confident strategies are suitable .
128 | The Future of Jobs Report Industry Gender Gap Profile Energy Workforce Disruption, 2015–2020 Composition by Role and Level Industry Average Percentage of Women STABLE 70% 15% 31% Employment outlook Skills stability Current share of women Gender wage gap HARDER NEUTRAL Relative ease of recruitment, current Relative ease of recruitment, 2020 0% CEOs Main Job Families Employment outlook Job families Architecture and Engineering Energy and Petroleum Engineers Skills stability Current share of women Gender wage gap Relative ease of recruiting women, current 65% 11% 33% harder neutral decline –3.11% 62% 22% 23% harder neutral growth 2.06% 92% 16% 50% harder easier decline –1.15% 100% 15% 20% harder Board Members Relative ease of recruiting women, 2020 growth 1.70% 32% harder Electrotechnology Engineers Manufacturing and Production Assembly and Factory Workers Current Expected in 2020 Petroleum and Natural Gas Refining Plant Operators Management General and Operations Managers Business Services and Administration Managers Construction and Extraction Mining and Petroleum Extraction Workers 24% Job Family in Focus: Manufacturing and Production ⬆ Job family with largest share of women Compensation ⬇ Job security ⬆ Work-life balance 19% 11% 27% 27% 20% Junior level Mining and Petroleum Plant Operators Middle level Senior level Junior level Middle level Senior level 19% 22% 25% 30% Line roles Staff roles Line roles Staff roles . Industry Gender Gap Profile Energy Companies’ Rationales for Gender Parity Companies’ Approaches to Leveraging Female Talent Fairness and equality 50% Barriers Enhance decision-making 45% Unconscious bias among managers.............................................................. 70% Reflect gender composition of customer base 40% Lack of qualified incoming talent.................................................................. 60% Expand talent pool 25% Lack of role models..................................................................................... 55% Enhance innovation 20% Lack of work-life balance.............................................................................
30% Government regulation 15% Demand by employees 10% 13% Perceive women’s economic power, aspirations as a driver of change Don’t know.................................................................................................. 15% 36% Perceive attracting female talent as a key future workforce strategy 31% Perceive a gender wage gap for equally qualified employees in the same role Strategies Demonstrate leadership commitment 45% Set targets and measure progress 40% Development and leadership training of women 35% Build awareness of the benefits among managers 30% Transparent career paths, salary structures 25% Offer, support flexible work 25% Support women’s integration into the value chain 25% 18% 23% 26% 26% 18% 19% Current 2020 Current 2020 Current 2020 129 | The Future of Jobs Report believe that gender parity is a leadership priority Societal pressures....................................................................................... 25% Female Share of Customer Base Business-to-business 51% of total customers 75% Business-to-consumer 19% of total customers Business-to-government 21% of total customers Promote work-life balance 15% 65% are confident strategies are suitable .
130 | The Future of Jobs Report Industry Gender Gap Profile Financial Services & Investors Workforce Disruption, 2015–2020 Composition by Role and Level Industry Average Percentage of Women GROWTH 57% 29% 38% Employment outlook Skills stability Current share of women Gender wage gap HARDER NEUTRAL Relative ease of recruitment, current Relative ease of recruitment, 2020 9% CEOs Main Job Families Employment outlook Job families Business and Financial Operations Financial and Investment Advisers Skills stability Current share of women Gender wage gap Relative ease of recruiting women, current 63% 36% 36% harder neutral growth 4.50% 60% 35% 27% harder harder stable –0.68% 70% 38% 63% harder easier growth 2.20% 48% 26% 7% harder Board Members Relative ease of recruiting women, 2020 stable 0.79% 35% neutral Investment Fund Managers Computer and Mathematical Data Analysts Current Expected in 2020 Information Security Analysts Sales and Related Securities and Finance Dealers and Brokers Sales and Purchasing Agents and Brokers Management General and Operations Managers 43% Job Family in Focus: Sales and Related ⬇ Job family with largest share of women Compensation ⬇ Job security ⬌ Work-life balance 33% 20% 43% 40% 30% Junior level Business Services and Administration Managers Middle level Senior level Junior level Middle level Senior level 35% 42% 39% 43% Line roles Staff roles Line roles Staff roles . Industry Gender Gap Profile Financial Services & Investors Companies’ Rationales for Gender Parity Companies’ Approaches to Leveraging Female Talent Fairness and equality 60% Barriers Reflect gender composition of customer base 43% Lack of work-life balance............................................................................. 53% Enhance innovation 43% Lack of role models..................................................................................... 47% Enhance decision-making 30% Women’s confidence, aspirations.................................................................. 43% Expand talent pool 23% Unconscious bias among managers..............................................................
37% Financial returns 17% Government regulation 13% 9% Perceive women’s economic power, aspirations as a driver of change Unclear career paths.................................................................................... 20% 30% Perceive attracting female talent as a key future workforce strategy 38% Perceive a gender wage gap for equally qualified employees in the same role Strategies Offer, support flexible work 43% Promote work-life balance 43% Demonstrate leadership commitment 37% Set targets and measure progress 33% Development and leadership training of women 30% Transparent career paths, salary structures 23% Build awareness of the benefits among managers 20% 20% 32% 40% 41% 16% 27% Current 2020 Current 2020 Current 2020 131 | The Future of Jobs Report believe that gender parity is a leadership priority Lack of talent, leadership development for women........................................ 23% Female Share of Customer Base Business-to-business 37% of total customers 63% Business-to-consumer 39% of total customers Business-to-government 16% of total customers No strategy 20% 70% are confident strategies are suitable .
132 | The Future of Jobs Report Industry Gender Gap Profile Healthcare Workforce Disruption, 2015–2020 Composition by Role and Level Industry Average Percentage of Women STABLE 71% 38% 15% Employment outlook Skills stability Current share of women Gender wage gap NEUTRAL NEUTRAL Relative ease of recruitment, current Relative ease of recruitment, 2020 6% CEOs Main Job Families Employment outlook Job families Manufacturing and Production Chemical Processing Plant Operators Skills stability Current share of women Gender wage gap Relative ease of recruiting women, current 85% 42% 0% neutral neutral stable -0.71% 100% 40% 0% neutral neutral decline –1.82% 70% 63% 25% harder neutral — — 85% — easier Board Members Relative ease of recruiting women, 2020 stable 0.79% — harder Assembly and Factory Workers Life, Physical, and Social Sciences Biologists and Geneticists Current Expected in 2020 Chemists and Chemical Laboratory Scientists Sales and Related Shop Salespersons Sales Representatives, Technical and Scientific Personal Care and Service Personal Care Aides 39% 31% 15% 46% 44% 28% Junior level Middle level Senior level Junior level Middle level Senior level Job Family in Focus: Personal Care and Service Job family with largest share of women — — — 44% 41% 49% 48% Compensation Job security Work-life balance Line roles Staff roles Line roles Staff roles . Industry Gender Gap Profile Healthcare Companies’ Rationales for Gender Parity Companies’ Approaches to Leveraging Female Talent Fairness and equality 50% Barriers Reflect gender composition of customer base 40% Unconscious bias among managers.............................................................. 50% Enhance innovation 40% Lack of role models..................................................................................... 50% 30% Lack of qualified incoming talent.................................................................. 40% Enhance decision-making Don’t know..................................................................................................
30% 60% believe that gender parity is a leadership priority Lack of work-life balance............................................................................. 20% Societal pressures....................................................................................... 20% 10% Perceive women’s economic power, aspirations as a driver of change 17% Perceive attracting female talent as a key future workforce strategy 15% Perceive a gender wage gap for equally qualified employees in the same role Strategies Set targets and measure progress 50% Offer, support flexible work 40% Build awareness of the benefits among managers 40% Female Share of Customer Base 60% are confident strategies are suitable 50% 43% 57% 57% 60% 60% Current 2020 Current 2020 Current 2020 Business-to-business 51% of total customers 133 | The Future of Jobs Report Business-to-consumer 31% of total customers Business-to-government 18% of total customers .
134 | The Future of Jobs Report Industry Gender Gap Profile Information and Communication Technology Workforce Disruption, 2015–2020 Composition by Role and Level Industry Average Percentage of Women STABLE 65% 21% 25% HARDER HARDER Employment outlook Skills stability Current share of women Gender wage gap Relative ease of recruitment, current Relative ease of recruitment, 2020 5% CEOs Main Job Families Employment outlook Job families Computer and Mathematical Database and Network Professionals Skills stability Current share of women Gender wage gap Relative ease of recruiting women, current 63% 20% 33% harder harder growth 2.14% 64% 44% 25% harder neutral decline –1.19% 54% 9% 30% harder neutral 77% 7% 8% harder Board Members Relative ease of recruiting women, 2020 growth 1.74% 19% harder Software and Applications Developers and Analysts Sales and Related Telemarketers Current Expected in 2020 Sales Representatives, Wholesale and Technical Installation and Maintenance Mechanics and Machinery Repairers Electronics and Telecommunications Installers and Repairers Architecture and Engineering Electrotechnology Engineers growth 4.12% 32% Job Family in Focus: Sales and Related ⬆ Job family with largest share of women Compensation ⬆ Job security ⬆ Work-life balance 21% 11% 34% 29% 20% Junior level Architects and Surveyors Middle level Senior level Junior level Middle level Senior level 23% 33% 32% 38% Line roles Staff roles Line roles Staff roles . Industry Gender Gap Profile Information and Communication Technology Companies’ Rationales for Gender Parity Companies’ Approaches to Leveraging Female Talent Fairness and equality 63% Barriers Expand talent pool 37% Lack of qualified incoming talent.................................................................. 57% Reflect gender composition of customer base 33% Lack of work-life balance............................................................................. 47% External pressuresreputation 33% Unconscious bias among managers.............................................................. 47% Enhance innovation 27% Lack of role models.....................................................................................
37% Enhance decision-making 23% Government regulation 20% 3% Perceive women’s economic power, aspirations as a driver of change Lack of talent, leadership development for women........................................ 27% 16% Perceive attracting female talent as a key future workforce strategy 25% Perceive a gender wage gap for equally qualified employees in the same role Strategies Promote work-life balance 40% Set targets and measure progress 37% Transparent career paths, salary structures 37% Build awareness of the benefits among managers 33% Development and leadership training of women 25% 33% 24% 30% 17% 21% 2020 Current 2020 Current 2020 Business-to-consumer 29% of total customers Business-to-government 18% of total customers 30% Demonstrate leadership commitment Current 33% Offer, support flexible work 135 | The Future of Jobs Report believe that gender parity is a leadership priority Women’s confidence, aspirations.................................................................. 37% Female Share of Customer Base Business-to-business 53% of total customers 37% 30% Support women’s integration into the value chain 20% 47% are confident strategies are suitable .
136 | The Future of Jobs Report Industry Gender Gap Profile Media, Entertainment and Information Workforce Disruption, 2015–2020 Composition by Role and Level Industry Average Percentage of Women GROWTH 73% 30% 18% HARDER EASIER Employment outlook Skills stability Current share of women Gender wage gap Relative ease of recruitment, current Relative ease of recruitment, 2020 13% CEOs Main Job Families Job families Arts, Design, Entertainment, Sports, and Media Advertising and Public Relations Professionals Employment outlook Skills stability Current share of women Gender wage gap Relative ease of recruiting women, current 66% 49% 15% neutral neutral strong growth 6.94% 88% 23% 11% harder easier growth 2.69% 86% 39% 13% harder easier growth 1.67% 67% 12% 33% harder Board Members Relative ease of recruiting women, 2020 stable –0.59% 22% easier Telecommunications and Broadcasting Technicians Computer and Mathematical Data Analysts Current Expected in 2020 Software and Applications Developers and Analysts Sales and Related Cashiers and Ticket Clerks Door-To-Door Sales Workers, News and Street Vendors Management General and Operations Managers 35% Job Family in Focus: Arts, Design, Entertainment, Sports, and Media ⬌ Job family with largest share of women Compensation ⬇ Job security ⬌ Work-life balance 25% 25% 36% 32% 33% Junior level Business Services and Administration Managers Middle level Senior level Junior level Middle level Senior level 38% 47% 43% 46% Line roles Staff roles Line roles Staff roles . Industry Gender Gap Profile Media, Entertainment and Information Companies’ Rationales for Gender Parity Companies’ Approaches to Leveraging Female Talent Enhance innovation 38% Barriers Fairness and equality 31% Lack of work-life balance............................................................................. 54% Reflect gender composition of customer base 31% Unconscious bias among managers.............................................................. 46% Enhance decision-making 31% Lack of role models..................................................................................... 31% Financial returns 31% Don’t know..................................................................................................
31% Expand talent pool 23% External pressuresreputation 15% 7% Perceive women’s economic power, aspirations as a driver of change 46% believe that gender parity is a leadership priority Women’s confidence, aspirations.................................................................. 31% No barriers.................................................................................................. 23% 46% Perceive attracting female talent as a key future workforce strategy 18% Perceive a gender wage gap for equally qualified employees in the same role Strategies Promote work-life balance Build awareness of the benefits among managers 31% Offer, support flexible work Female Share of Customer Base 46% 31% 62% are confident strategies are suitable 20% 32% 48% 44% 15% 19% Current 2020 Current 2020 Current 2020 Business-to-business 41% of total customers 137 | The Future of Jobs Report Business-to-consumer 42% of total customers Business-to-government 11% of total customers .
138 | The Future of Jobs Report Industry Gender Gap Profile Mobility Workforce Disruption, 2015–2020 Composition by Role and Level Industry Average Percentage of Women STABLE 61% 16% 39% Employment outlook Skills stability Current share of women Gender wage gap HARDER NEUTRAL Relative ease of recruitment, current Relative ease of recruitment, 2020 9% CEOs Main Job Families Employment outlook Job families Manufacturing and Production Assembly and Factory Workers Skills stability Current share of women Gender wage gap Relative ease of recruiting women, current 66% 18% 30% harder neutral growth 4.83% 62% 13% 36% harder harder growth 3.13% 63% 13% 13% harder neutral decline –1.88% 40% 16% 33% harder Board Members Relative ease of recruiting women, 2020 decline –1.43% 17% neutral Sheet and Structural Metal Workers Architecture and Engineering Electrotechnology Engineers Current Expected in 2020 Industrial and Production Engineers Transportation and Logistics Supply Chain and Logistics Specialists Transportation Attendants and Conductors Sales and Related Sales and Marketing Professionals 28% Job Family in Focus: Manufacturing and Production ⬆ Job family with largest share of women Compensation ⬇ Job security ⬇ Work-life balance 21% 13% 33% 30% 21% Junior level Sales Representatives, Wholesale and Technical Middle level Senior level Junior level Middle level Senior level 25% 34% 31% 36% Line roles Staff roles Line roles Staff roles . Industry Gender Gap Profile Mobility Companies’ Rationales for Gender Parity Companies’ Approaches to Leveraging Female Talent Fairness and equality 58% Barriers Enhance innovation 33% Lack of qualified incoming talent.................................................................. 63% Enhance decision-making 29% Lack of work-life balance............................................................................. 54% Expand talent pool 29% Lack of role models..................................................................................... 50% Demand by employees 21% Unconscious bias among managers..............................................................
33% Reflect gender composition of customer base 13% External pressures/reputation 13% 6% Perceive women’s economic power, aspirations as a driver of change Women’s confidence, aspirations.................................................................. 29% 21% Perceive attracting female talent as a key future workforce strategy 39% Perceive a gender wage gap for equally qualified employees in the same role Strategies Promote work-life balance 63% Development and leadership training of women 42% Transparent career paths, salary structures 29% Demonstrate leadership commitment 29% Build awareness of the benefits among managers 25% Set targets and measure progress 21% Support women’s integration into the value chain 21% 21% 30% 21% 27% 16% 19% Current 2020 Current 2020 Current 2020 139 | The Future of Jobs Report believe that gender parity is a leadership priority Societal pressures....................................................................................... 33% Female Share of Customer Base Business-to-business 51% of total customers 54% Business-to-consumer 31% of total customers Business-to-government 18% of total customers Offer, support flexible work 17% 58% are confident strategies are suitable .
140 | The Future of Jobs Report Industry Gender Gap Profile Professional Services Workforce Disruption, 2015–2020 Composition by Role and Level Industry Average Percentage of Women STABLE 67% 30% 22% Employment outlook Skills stability Current share of women Gender wage gap HARDER NEUTRAL Relative ease of recruitment, current Relative ease of recruitment, 2020 9% CEOs Main Job Families Employment outlook Job families Business and Financial Operations Management and Organisation Analysts Skills stability Current share of women Gender wage gap Relative ease of recruiting women, current 77% 48% 15% neutral neutral strong growth 5.31% 54% 17% 31% harder harder growth 1.00% 65% 29% 21% harder easier decline –3.21% 54% 56% 8% neutral Board Members Relative ease of recruiting women, 2020 stable 0.33% 23% neutral Human Resources Specialists Computer and Mathematical Data Analysts Current Expected in 2020 Software and Applications Developers and Analysts Management General and Operations Managers Business Services and Administration Managers Sales and Related Sales and Marketing Professionals 39% Job Family in Focus: Sales and Related ⬆ Job family with largest share of women Compensation ⬇ Job security ⬆ Work-life balance 33% 22% 43% 40% 34% Junior level Real Estate Sales Agents Middle level Senior level Junior level Middle level Senior level 44% 44% 44% 46% Line roles Staff roles Line roles Staff roles . Industry Gender Gap Profile Professional Services Companies’ Rationales for Gender Parity Companies’ Approaches to Leveraging Female Talent Fairness and equality 50% Barriers Reflect gender composition of customer base 39% Women’s confidence, aspirations.................................................................. 50% Enhance innovation 25% Lack of work-life balance............................................................................. 42% Enhance decision-making 25% Unconscious bias among managers.............................................................. 42% Financial returns 22% Societal pressures.......................................................................................
39% External pressuresreputation 14% 15% Perceive women’s economic power, aspirations as a driver of change Lack of role models..................................................................................... 31% 21% Perceive attracting female talent as a key future workforce strategy 22% Perceive a gender wage gap for equally qualified employees in the same role Strategies Promote work-life balance 47% Demonstrate leadership commitment 36% Set targets and measure progress 36% Offer, support flexible work 36% Development and leadership training of women Female Share of Customer Base 31% Build awareness of the benefits among managers 25% Don’t know 31% 45% 32% 30% 20% 28% Current 2020 Current 2020 Current 2020 Business-to-business 61% of total customers 141 | The Future of Jobs Report believe that gender parity is a leadership priority Lack of qualified incoming talent.................................................................. 36% 17% No rationale 42% Business-to-consumer 23% of total customers Business-to-government 17% of total customers 17% Support women’s integration into the value chain 14% 50% are confident strategies are suitable .
. Acknowledgements GLOBAL AGENDA COUNCIL ON THE FUTURE OF JOBS GLOBAL AGENDA COUNCIL ON GENDER PARITY Jeffrey Joerres, Executive Chairman Emeritus, ManpowerGroup; Council Chair J. Frank Brown, Managing Director and Chief Operating Officer, General Atlantic LLC; Council Chair Jamie McAuliffe, President and CEO, Education for Employment; Council Vice-Chair Mara Swan, Executive Vice-President, Global Strategy and Talent, ManpowerGroup; Council Vice-Chair Umran Beba, Senior Vice-President and Chief Human Resources Officer, Asia, Middle East and Africa, PepsiCo Inc. Shelley Bird, Executive Vice-President, Cardinal Health Azita Berar Awad, Director, Employment Policy Department, International Labour Organization (ILO) (since June 2015) Ozlem Denizmen, Head, Social Investments, Dogus Group Tan Chorh-Chuan, President, National University of Singapore Natalie Costello, Vice-President, Chartering and Commercial Operations BP Shipping, BP Elaine J. Dorward-King, Executive Vice-President, Sustainability and External Relations, Newmont Mining Corporation Arturo Condo, President, INCAE Business School Valerie Germain, Global Managing Partner, Functional Practices, Heidrick & Struggles, International Inc. Pascaline Descy, Head, Research and Policy Analysis, European Centre for the Development of Vocational Training (CEDEFOP) Rick Goings, Chairman and Chief Executive Officer, Tupperware Brands Corporation John Evans, General Secretary, Trade Union Advisory Committee to the Organisation for Economic Co-operation and Development John Irons, Managing Director, Rockefeller Foundation Herminia Ibarra, Cora Chaired Professor of Leadership and Learning and Professor of Organizational Behaviour, INSEAD Laura Liswood, Secretary-General, Council of Women World Leaders Yoko Ishikura, Professor Emeritus, Hitotsubashi University Meg McCarthy, Executive Vice-President, Innovation, Technology and Service Operations, Aetna Chauncy Lennon, Senior Program Director, Workforce Development, JPMorgan Chase Gagan Singh, Chief Executive Officer, Business, India and Chairman, Sri Lanka Operations, Jones Lang LaSalle, Inc Andrew McAfee, Principal Research Scientist, MIT Center for Digital Business Alexander Türpitz, Partner and Managing Director, The Boston Consulting Group Patricia Milligan, Global Leader, Multinational Client Group, Mercer Laura D’Andrea Tyson, Professor and Director, Haas School of Business, University of California, Berkeley Vikas Pota, Chief Executive, Varkey Foundation Martina Viarengo, Assistant Professor, International Economics, The Graduate Institute of International and Development Studies José Manuel Salazar Xirinachs, Assistant Director-General for Policy, International Labour Organization (ILO) (until June 2015) Stefano Scarpetta, Director for Employment, Labour and Social Affairs, Organisation for Economic Co-operation and Development (OECD) Bettina Schaller Bossert, Director, Group Public Affairs, Adecco Group (since September 2015) Antje Wessel, Head, Global Leadership Transition Program, Bayer AG A special thank you to the Global Agenda Council on Gender Parity. Mohammed Al Sellemi, Director of Human Resources, Saudi Aramco AT THE WORLD ECONOMIC FORUM Hanne Shapiro, Director, Policy and Business Analysis, Danish Technological Institute Richard Samans, Head of the Centre for the Global Agenda; Member of the Managing Board Jennifer Silberman, Vice-President, Corporate Responsibility, Hilton Saadia Zahidi, Head, Gender Parity and Employment Initiatives; Member of the Executive Committee Mark De Smedt, Chief Human Resources Officer, Adecco Group (until September 2015) Till Alexander Leopold, Project Lead, Employment, Skills and Human Capital Initiative; Council Manager Nigel Twose, Senior Director, Jobs Cross-Cutting Solutions Area, World Bank (until September 2015) Vesselina Ratcheva, Data Analyst, Gender Parity and Employment Initiatives Tae Yoo, Senior Vice-President, Cisco A special thank you to the Global Agenda Council on the Future of Jobs. (Cont’d.) The Future of Jobs Report | 143 . We would like to express our deep gratitude to the Chairs and Vice-Chairs of the Global Agenda Council on the Future of Jobs and the Global Agenda Council on Gender Parity, as well as to all Council Members and Global Challenge Partners for their guidance and support in the execution of the Forum’s Future of Jobs Survey. A very special thank you to Jessica Camus and Tamara Leonardi for their excellent work and inputs on the conception phase of this project. We are also grateful for the invaluable support of our colleagues across the Forum in helping to execute the Future of Jobs Survey, and, in particular, to Yasmina Bekhouche, Kristin Keveloh, Paulina Padilla Ugarte, Valerie Peyre, Pearl Samandari, Susan Wilkinson and Lena Woodward. Thank you to Michael Fisher for his superb editorial work, Neil Weinberg for his excellent graphic design and layout and Kamal Kamaoui and the World Economic Forum’s Publications team. We gratefully acknowledge the support and collaboration of Lutz Finger, Jason Schissel and Mario Rodriguez of LinkedIn and use of LinkedIn’s Economic Graph data as well as the financial support of The Rockefeller Foundation in the production of this Report. 144 | The Future of Jobs Report . Contributors Till Alexander Leopold is a Project Lead of the Global Challenge on Employment, Skills and Human Capital at the World Economic Forum. His responsibilities include leadership of the Global Challenge’s insights and analysis workstream, co-authorship of the Forum’s Human Capital Report, codevelopment of the Future of Jobs project and management of the Global Agenda Council on the Future of Jobs and the Global Agenda Council on Gender Parity. He also co-organizes community activities at the World Economic Forum’s Annual Meeting and regional summits. Till previously served as an economist and project manager at the United Nations and International Labour Organization, where his work focused on policy analysis, research and technical cooperation in the field of entrepreneurship and innovation ecosystems, and as a consultant and analyst in the field of impact investing and social entrepreneurship, with particular first-hand experience in SubSaharan Africa and South Asia.
He has co-authored several research reports on inclusive business and private sector development in emerging and frontier markets and moderated workshops on these topics at international development conferences. Till holds Masters degrees in Social Anthropology, Finance and Development Economics from the University of Cambridge and London University’s School of Oriental and African Studies (SOAS). Vesselina Ratcheva is a Data Analyst working in the World Economic Forum’s Human Capital and Gender Parity team. She is responsible for data processing, analysis and visualization.
Vesselina was previously responsible for Data, Research and Evaluation at National Numeracy, a skills charity in the United Kingdom. She has worked on a variety of research projects for the past 10 years, covering international migration, experiences of urban infrastructure, political mobilization, organizational culture and national identity— consistently using mixed research methods. She holds a PhD in Social Anthropology, an MSc in Comparative and Cross Cultural Research Methods and a BA in Social Anthropology and Maths.
Ratcheva is dedicated to exploring the best ways to ensure more just social and political systems with a specific focus on skills, employment and work, identity (gender, ethnic) and culture. Saadia Zahidi is Head of the Global Challenge on Employment, Skills and Human Capital, Head of the Global Challenge on Gender Parity and Member of the Executive Committee at the World Economic Forum. Zahidi founded and co-authors the Forum’s Global Gender Gap Report, the Corporate Gender Gap Report, the Human Capital Report, the Future of Jobs Report and the Industry Gender Gap Report. In her work on gender as well as employment, Zahidi has translated analysis into action by mobilizing a wide network of constituents—business leaders, governments, civil society and academia—to work together to set targets, share best practices, create new publicprivate partnerships, muster resources and change mindsets. In past roles, she has managed civil society and international organization portfolios at the Forum and was also previously an Economist with the Forum’s Global Competitiveness Programme.
Zahidi serves as a board member and advisor for several organizations and is a frequent speaker at international conferences and in the media. She earned her BA in Economics at Smith College, MPhil in International Economics at the Graduate Institute of International Studies and MPA at the Harvard Kennedy School. Her research interests include issues of gender equality, women’s leadership, skills gaps, employment and human capital.
She is currently writing a book on Womenomics in the Muslim World and was awarded the inaugural Bracken Bower Prize by the Financial Times and McKinsey for this project. She is a native of Pakistan. The Future of Jobs Report | 145 . . The World Economic Forum would like to thank Adecco Group, African Rainbow Minerals, Alghanim Industries, AlixPartners, The Bahrain Economic Development Board, Chobani, The Coca-Cola Company, Edelman, GEMS Education, Infosys, LinkedIn, ManpowerGroup, Mercer (MMC), Microsoft Corporation, Pearson, The Rockefeller Foundation, SAP, Saudi Aramco, Siemens, Tata Consultancy Services, Tupperware Brands Corporation, Uber, Workday, WPP and Zain for their invaluable support of the Global Challenge Initiative on Employment, Skills and Human Capital and this Report. The Adecco Group, based in Zurich, Switzerland, is the world’s leading provider of HR solutions. With more than 32,000 FTE employees and around 5,100 branches in over 60 countries and territories around the world, Adecco Group offers a wide variety of services, connecting around 700,000 associates with its clients every day. The services offered fall into the broad categories of temporary staffing, permanent placement, career transition and talent development, as well as outsourcing and consulting. Adecco inspires individuals and organisations to work more effectively and efficiently and creates greater choice in the domain of work, for the benefit of all concerned. As the world’s leading provider of HR solutions—a business that has a positive impact on millions of people every day—it is conscious of its global role.
Helping people to better work, better life is its common purpose and the way in which it contributes to society. Adecco Group is a Fortune Global 500 company. www.adecco.com African Rainbow Minerals (ARM) is a leading South African diversified mining and minerals company with long-life, low unit cost operations and significant growth opportunities. ARM mines iron ore, manganese ore and alloys, chrome ore and alloys, platinum group metals, copper, nickel and coal.
The company also has an investment in gold through its shareholding in Harmony. ARM is committed to responsible environmental stewardship as a fundamental part of sustainable value creation. www.arm.co.za Alghanim Industries is one of the largest privately owned companies in the Gulf region. Founded in 1932, the company has since grown into a multi-billion dollar conglomerate, employing more than 14,000 employees in 30 businesses and operating in over 40 countries across the Middle East and North Africa, Turkey, India and emerging Asian economies. www.alghanim.com AlixPartners is a global business advisory firm recognized for deep expertise in restoring performance and creating value.
Its managing directors work alongside boards of directors, lenders, investors, government institutions and the legal community to provide complementary services across corporate finance, information management, litigation support and organizational effectiveness to address financial and commercial challenges at all stages of the business lifecycle. www.alixpartners.com The Bahrain Economic Development Board (EDB) is a dynamic public agency with responsibility for attracting inward investment into Bahrain focusing on target economic sectors in which the Kingdom offers significant strengths. Key areas include manufacturing, ICT, and logistics and transport services. The financial services sector in Bahrain is particularly strong and the EDB supports the continuing growth of the banking industry and key sub-sectors, including Islamic finance, wealth management, asset management, and insurance and re-insurance. www.bahrainedb.com The Future of Jobs Report | 147 .
Chobani was founded on the belief that people have great taste—they just need great options. Chobani produces high-quality, authentic, strained Greek yogurt products made with only natural ingredients from its New York and Idaho plants. Chobani is committed to using milk from regional farms and strengthening its surrounding local economies. Chobani gives 10% of its annual profits to charities worldwide through the company’s charitable foundation. Chobani products are available in the US, Australia, in Asia and Latin America. www.chobani.com The Coca-Cola Company (NYSE: KO) is the world’s largest beverage company, refreshing consumers with more than 500 sparkling and still brands.
Led by Coca-Cola, one of the world’s most valuable and recognizable brands, the Company’s portfolio features 16 billion-dollar brands including Diet Coke, Fanta, Sprite, Coca-Cola Zero, vitaminwater, Powerade, Minute Maid, Simply, Georgia and Del Valle. Globally, it is the No. 1 provider of sparkling beverages, readyto-drink coffees, and juices and juice drinks.
Through the world’s largest beverage distribution system, consumers in more than 200 countries enjoy its beverages at a rate of more than 1.8 billion servings a day. With an enduring commitment to building sustainable communities, the Company is focused on initiatives that reduce its environmental footprint, support active, healthy living, create a safe, inclusive work environment, and enhance the economic development of the communities where it operates. Together with its bottling partners, it ranks among the world’s top 10 private employers with more than 700,000 system associates. www.thecocacolacompany.com Edelman is a leading global communications marketing firm that partners with many of the world’s largest and emerging businesses and organizations, helping them evolve, promote and protect their brands and reputations.
It has 65 offices and more than 5,500 employees worldwide, as well as affiliates in more than 30 cities. www.edelman.com GEMS Education is a leading international education provider. It runs high-performing schools and offers consulting services to the public and private sectors. For over 55 years, it has provided high-quality education to hundreds of thousands of children.
GEMS has a global network of award-winning schools which provide high-quality holistic education to more than 250,000 students. It employs over 20,000 education professionals, specialists and staff. Its world-class leadership team combines business and education expertise from around the globe. www.gemseducation.com Infosys is a global leader in consulting, technology, outsourcing and next-generation services.
It enables clients in more than 50 countries to stay a step ahead of the competition. Its expertise spans industries. From helping build lighter and stronger passenger jets and creating more fuel efficient cars, to enabling banks to provide financial inclusion to the most remote corners of the globe, Infosys delivers powerful innovations.
And in doing so, it changes the way the world works and lives. www.infosys.com LinkedIn connects the world’s professionals to make them more productive and successful and transforms the ways companies hire, market and sell. Our vision is to create economic opportunity for every member of the global workforce through the ongoing development of the world’s first Economic Graph. LinkedIn has more than 400 million members and has offices around the world. www.linkedin.com 148 | The Future of Jobs Report .
ManpowerGroup™ (NYSE: MAN) is the world’s workforce expert, creating innovative workforce solutions, for more than 65 years. It connects more than 600,000 people to meaningful work across a wide range of skills and industries every day. Through its ManpowerGroup family of brands—Manpower®, Experis®, Right Management® and ManpowerGroup® Solutions—it helps more than 400,000 clients in 80 countries and territories address their critical talent needs, providing comprehensive solutions to resource, manage and develop talent. In 2015, ManpowerGroup was named one of the World’s Most Ethical Companies for the fifth consecutive year and one of Fortune’s Most Admired Companies, confirming its position as the most trusted and admired brand in the industry.
ManpowerGroup makes powering the world of work humanly possible. www.manpowergroup.com Mercer is a global consulting leader in talent, health, retirement and investments. Mercer helps clients around the world advance the health, wealth and careers of their most vital asset – their people. Mercer’s more than 20,000 employees are based in 43 countries and the firm operates in over 140 countries.
Mercer is a wholly owned subsidiary of Marsh & McLennan Companies (NYSE: MMC), a global professional services firm offering clients advice and solutions in the areas of risk, strategy and people. With annual revenue of $13 billion and 57,000 colleagues worldwide, Marsh & McLennan Companies is also the parent company of Marsh, a leader in insurance broking and risk management; Guy Carpenter, a leader in providing risk and reinsurance intermediary services; and Oliver Wyman, a leader in management consulting. www.mercer.com Microsoft is a worldwide leader in software, services and solutions that help people and businesses realize their full potential. Since it was founded in 1975, it has worked to achieve this mission by creating technology that transforms the way people work, play and communicate. Microsoft does business throughout the world, with over 90,000 employees and offices in more than 100 countries.
Through its people, partnerships and technology, the company helps to address some of the world’s most pressing societal challenges and create social and economic opportunities that improve people’s lives. Microsoft upholds a belief that social and economic opportunity go hand in hand. When individuals, communities and governments thrive, so does business.
To support this cycle, the company focuses on strengthening economies, addressing societal challenges, promoting a healthy online environment and managing a sustainable business. www.microsoft.com Pearson is the world’s leading education company. From pre-school to high school, early learning to professional certification, its curriculum materials, multimedia learning tools and testing programmes help to educate millions of people worldwide—more than any other private enterprise. www.pearson.com The Rockefeller Foundation supports work to advance inclusive economies that expand opportunities for more broadly shared prosperity and to build greater resilience by helping people, communities and institutions prepare for, withstand and emerge stronger from acute shocks and chronic stresses. This affirms its pioneering philanthropic mission—since 1913—to promote the well-being of humanity throughout the world. www.rockefellerfoundation.org The Future of Jobs Report | 149 .
As market leader in enterprise application software, SAP (NYSE: SAP) helps companies of all sizes and industries run better. From back office to boardroom, warehouse to storefront, desktop to mobile device, SAP empowers people and organizations to work together more efficiently and use business insight more effectively to stay ahead of the competition. SAP applications and services enable more than 296,000 customers to operate profitably, adapt continuously and grow sustainably. www.sap.com Saudi Aramco is a leading, globally integrated energy and chemicals company. From producing approximately one in every eight barrels of the world’s crude oil supply to developing new energy technologies, Saudi Aramco’s global team is dedicated to creating positive impacts. The company relentlessly pursues the ideas that make its resources more dependable, more sustainable, and more useful.
By strategically conducting its commercial activities in ways that trigger economic multiplier effects, the company delivers added value to the communities in which it operates. Whether it is the energy of its resources or the intellectual and creative energy of its people, Saudi Aramco is focused on harnessing the full potential of both for the benefit of the greatest number of people possible. www.saudiaramco.com Siemens AG (Berlin and Munich) is a global technology powerhouse that has stood for engineering excellence, innovation, quality, reliability and internationality for more than 165 years. The company is active in more than 200 countries, focusing on the areas of electrification, automation and digitalization. One of the world’s largest producers of energy-efficient, resourcesaving technologies, Siemens is No.
1 in offshore wind turbine construction, a leading supplier of combined cycle turbines for power generation, a major provider of power transmission solutions, and a pioneer in infrastructure solutions as well as automation, drive and software solutions for industry. The company is also a leading provider of medical imaging equipment—such as computed tomography and magnetic resonance imaging systems—and a leader in laboratory diagnostics as well as clinical IT. In fiscal 2014, which ended on 30 September 2014, Siemens generated revenue from continuing operations of 71.9 billion euros and net income of 5.5 billion euros.
At the end of September 2014, the company had around 357,000 employees worldwide. www.siemens.com Tata Consultancy Services (TCS) is a global IT services company that was rated as the fastest growing brand in its industry worldwide in 2015, with a brand value of $8.27 billion. It ranks in the topmost tier of its industry in terms of market capitalization, employees and brand value, and is the industry leader in customer satisfaction. TCS offers a consulting-led, integrated portfolio of IT, business process services, infrastructure, engineering and assurance services. The company is recognized as the top employer in its industry, with over 335,000 of the world’s best-trained consultants working in 46 countries.
Under the leadership of its current CEO, N. Chandrasekaran, TCS has grown at a compounded annual rate of 26% over the past three years and has generated consolidated revenues of $15.5 billion for the year ended 31 March 2015. www.tcs.com Tupperware Brands Corporation is the leading global marketer of innovative, premium products across multiple brands, utilizing a relationship-based selling method through an independent sales force of 2.9 million. For more than 65 years, Tupperware Brands has connected women through its worldwide sales force—propelling the organization’s business objectives while positively impacting the lives of women through a unique business model that educates and empowers through economic opportunities, training and enhanced self-confidence. www.tupperwarebrands.com 150 | The Future of Jobs Report . Uber is evolving the way the world moves. By seamlessly connecting riders to drivers through its apps, it makes cities more accessible, opening up more possibilities for riders and more business for drivers. From its founding in 2009 to its launches in hundreds of cities today, Uber’s rapidly expanding global presence continues to bring people and their cities closer. www.uber.com Workday is a leading provider of enterprise cloud applications for finance and human resources. Founded in 2005, Workday delivers financial management, human capital management, and analytics applications designed for the world’s largest companies, educational institutions, and government agencies. More than 1,000 organizations, ranging from medium-sized businesses to Fortune 500 enterprises, have selected Workday. www.workday.com WPP is the world’s leading communications services group, with billings of $72.3 billion and revenues of $17.3 billion in 2013, providing national, multinational and global clients with advertising; media investment management; data investment management; public relations & public affairs; branding & identity; healthcare communications; and direct, digital, interactive, promotion & specialist communications.
WPP’s worldwide companies include JWT, Ogilvy & Mather, Y&R, Grey Group, United Network, GroupM, Mindshare, MEC, MediaCom, Maxus, Kantar (including Millward Brown and TNS), Burson-Marsteller, Hill+Knowlton Strategies, Cohn & Wolfe, RLM Finsbury, Ogilvy Public Relations, Landor, Brand Union, Fitch, Sudler & Hennessey, Ogilvy CommonHealth Worldwide, ghg, AKQA, OgilvyOne, Wunderman and WPP Digital, among others. WPP companies provide communications services to clients worldwide, including 350 of the Fortune Global 500; all 30 of the Dow Jones 30; 63 of the NASDAQ 100; and 31 of the Fortune e-50. Collectively, WPP employs 179,000 people (including associates) in more than 3,000 offices in 111 countries. www.wpp.com Zain is a leading telecommunications operator across the Middle East and Africa providing mobile voice and data services to over 44.3 million active customers as of 31 December 2014. With a commercial presence in eight countries, Zain operates in Kuwait, Bahrain, Iraq, Jordan, Saudi Arabia, South Sudan and Sudan.
In Lebanon, the Group manages touch on behalf of the government. In Morocco, Zain has a 15.5% stake in INWI through a joint venture. Zain is listed on the Kuwait Stock Exchange. www.zain.com The Future of Jobs Report | 151 .
. The World Economic Forum would like to thank Alghanim Industries, A.T. Kearney, Bank of America, Bloomberg, Hubert Burda Media, Centene Corporation, The Coca-Cola Company, EY, Heidrick & Struggles, JLL, Johnson Controls Inc., ManpowerGroup, Old Mutual, Omnicom, Ooredoo, PwC, Renault-Nissan Alliance, Takeda Pharmaceutical, and Tupperware Brands Corporation for their invaluable support of the Global Challenge on Gender Parity and this Report. Alghanim Industries is one of the largest privately owned companies in the Gulf region. Founded in 1932, the company has since grown into a multi-billion dollar conglomerate, employing more than 14,000 employees in 30 businesses and operating in over 40 countries across the Middle East and North Africa, Turkey, India and emerging Asian economies. www.alghanim.com A.T. Kearney is a leading global management consulting firm with offices in more than 40 countries.
Since 1926, A.T. Kearney has been a trusted adviser to the world’s foremost organizations. A.T.
Kearney is a partner-owned firm, committed to helping clients achieve immediate impact and growing advantage on their most missioncritical issues. www.atkearney.com Bank of America is one of the world’s largest financial institutions, serving individual consumers, small- and middle-market businesses and large corporations with banking, investing, asset management and other financial and risk management products and services. The company provides unmatched convenience in the United States, serving approximately 48 million consumer and small business relationships with some 4,800 retail banking offices and around 16,000 ATMs, and award-winning online banking with 31 million active users and approximately 18 million mobile users. www.bankofamerica.com Bloomberg, L.P. is the leading global provider of financial data, analytics, news and media.
Bloomberg provides real-time financial information to more than 310,000 subscribers; through Bloomberg Law, Bloomberg Government and Bloomberg New Energy Finance, the company provides data, news, and analytics to decision makers in industries beyond finance. Bloomberg News, TV, Radio, Mobile, Internet and two magazines—Businessweek and Markets—cover the world with over 2,300 news professionals. The company employs more than 17,000 people in 192 locations around the world. www.bloomberg.com The Future of Jobs Report | 153 .
At total consolidated sales of €2.46 billion and over 10,000 employees in 18 countries, Hubert Burda Media is one of Europe’s largest consumer internet companies. Burda’s digital activities have been the main driver of the company’s growth. Hubert Burda Media reaches over 160 million users online; 40 million consumers enter into paying relationships with one of Burda’s 400 brands. As Germany’s leading magazine publishing house, the company offers about 80 magazines in Germany and another 240 magazines all over the world. www.hubert-burda-media.com Centene Corporation, a Fortune 500 company, is a diversified, multi-national healthcare enterprise that provides a portfolio of services to government-sponsored healthcare programs, focusing on under-insured and uninsured individuals.
Many receive benefits provided under Medicaid, including the State Children’s Health Insurance Program (CHIP), as well as Aged, Blind or Disabled (ABD), Foster Care and Long Term Care (LTC), in addition to other state-sponsored/hybrid programs and Medicare (Special Needs Plans). The Company operates local health plans and offers a range of health insurance solutions. It also contracts with other healthcare and commercial organizations to provide specialty services including behavioral health management, care management software, correctional healthcare services, dental benefits management, in-home health services, life and health management, managed vision, pharmacy benefits management, specialty pharmacy and telehealth services. www.centene.com The Coca-Cola Company (NYSE: KO) is the world’s largest beverage company, refreshing consumers with more than 500 sparkling and still brands.
Led by CocaCola, one of the world’s most valuable and recognizable brands, the Company’s portfolio features 16 billion-dollar brands including Diet Coke, Fanta, Sprite, CocaCola Zero, vitaminwater, Powerade, Minute Maid, Simply, Georgia and Del Valle. Globally, it is the No. 1 provider of sparkling beverages, ready-to-drink coffees, and juices and juice drinks. Through the world’s largest beverage distribution system, consumers in more than 200 countries enjoy its beverages at a rate of more than 1.8 billion servings a day.
With an enduring commitment to building sustainable communities, the Company is focused on initiatives that reduce its environmental footprint, support active, healthy living, create a safe, inclusive work environment, and enhance the economic development of the communities where it operates. Together with its bottling partners, it ranks among the world’s top 10 private employers with more than 700,000 system associates. www.thecocacolacompany.com EY is a global leader in assurance, tax, transaction and advisory services. The insights and quality services it delivers help build trust and confidence in the capital markets and in economies the world over.
EY develops outstanding leaders who team to deliver on its promises to all of its stakeholders. EY plays a critical role in building a better working world for its people, its clients and its communities. www.ey.com Heidrick & Struggles serves the executive talent and leadership needs of the world’s top organizations as the premier provider of leadership consulting, culture shaping and senior-level executive search services. The consultants of Heidrick leverage deep expertise across every industry sector and an unparalleled global presence.
Heidrick & Struggles pioneered the profession of executive search more than 60 years ago. Today, the firm serves as a trusted adviser, providing integrated leadership solutions and helping its clients change the world, one leadership team at a time. www.heidrick.com 154 | The Future of Jobs Report . JLL (NYSE: JLL) is a professional services and investment management firm offering specialized real estate services to clients seeking increased value by owning, occupying and investing in real estate. With annual fee revenue of $4.7 billion and gross revenue of $5.4 billion, JLL has more than 230 corporate offices, operates in 80 countries and has a global workforce of approximately 58,000. On behalf of its clients, the firm provides management and real estate outsourcing services for a property portfolio of 3.4 billion square feet, or 316 million square metres, and completed $118 billion in sales, acquisitions and finance transactions in 2014. Its investment management business, LaSalle Investment Management, has $55.3 billion of real estate assets under management.
JLL is the brand name, and a registered trademark, of Jones Lang LaSalle. www.joneslanglasalle.com Johnson Controls is a global diversified technology and industrial leader serving customers in more than 150 countries. Its 170,000 employees create quality products, services and solutions to optimize energy and operational efficiencies of buildings; lead-acid automotive batteries and advanced batteries for hybrid and electric vehicles; and seating components and systems for automobiles. The company’s commitment to sustainability dates back to 1885, with the invention of the first electric room thermostat.
Through its growth strategies and by increasing market share, Johnson Controls is committed to delivering value to shareholders and making its customers successful. In 2014, Johnson Controls reported annual sales of $42.8 billion and is consistently ranked on the U.S. Fortune 500 and Global Fortune 500.
Johnson Controls is committed to good corporate governance and community service. In 2015, Corporate Responsibility Magazine recognized Johnson Controls the no. 14 company in its annual “100 Best Corporate Citizens” list, confirming its position as an ethical and trusted brand in the industries it serves. www.johnsoncontrols.com ManpowerGroupTM (NYSE: MAN) is the world’s workforce expert, creating innovative workforce solutions, for more than 65 years.
It connects more than 600,000 people to meaningful work across a wide range of skills and industries every day. Through its ManpowerGroup family of brands—Manpower®, Experis®, Right Management® and ManpowerGroup® Solutions—it helps more than 400,000 clients in 80 countries and territories address their critical talent needs, providing comprehensive solutions to resource, manage and develop talent. In 2015, ManpowerGroup was named one of the World’s Most Ethical Companies for the fifth consecutive year and one of Fortune’s Most Admired Companies, confirming its position as the most trusted and admired brand in the industry.
ManpowerGroup makes powering the world of work humanly possible. www.manpowergroup.com Old Mutual provides investment, savings, insurance and banking services to more than 17 million customers in Africa, the Americas, Asia and Europe. Originating in South Africa in 1845, Old Mutual has been listed on the London and Johannesburg Stock Exchanges, among others, since 1999. In the year ended 31 December 2014, the Group reported adjusted operating profit before tax of £1.6 billion (on an IFRS basis) and had £319 billion of funds under management from core operations.
For further information on Old Mutual plc, please visit the corporate website at www. oldmutual.com. www.oldmutual.com The Future of Jobs Report | 155 . Omnicom is a strategic holding company headquartered in New York. It manages a portfolio of global market leaders in the disciplines of advertising, marketing services, specialty communications, interactive/digital media and media buying services. Omnicom Group companies cover more than 30 marketing communications disciplines across more than 200 strategic brand platforms, comprising three global advertising agency networks, leading national advertising agencies, a global network of more than 175 marketing services companies and a media group that includes two of the world’s premier providers of media planning and buying services. Omnicom’s commitment to excellence, quality and client satisfaction is a primary reason why its record of new business wins and longevity of major client relationships are the best in the business. Its agency brands are consistently acknowledged as having the best creative talent in the world in all disciplines.
A leader in digital media, Omnicom Group has been ranked number one in digital share of revenue among all holding companies. www.omnicomgroup.com Ooredoo is a leading international communications company delivering mobile, fixed, broadband internet and corporate managed services tailored to the needs of consumers and businesses across markets in the Middle East, North Africa and Southeast Asia. As a community-focused company, Ooredoo is guided by its vision of enriching people’s lives and its belief that it can stimulate human growth by leveraging communications to help people achieve their full potential. Ooredoo has a presence in markets such as Qatar, Kuwait, Oman, Algeria, Tunisia, Iraq, Palestine, the Maldives, Myanmar and Indonesia.
The company was named “Best Mobile Operator of the Year” at the World Communication Awards 2013. The company reported revenues of US$ 9.1 billion in 2014 and had a consolidated global customer base of more than 107 million people as of 31 December 2014. Ooredoo’s shares are listed on the Qatar Exchange and the Abu Dhabi Securities Exchange. www.ooredoo.com At PwC, our purpose is to build trust in society and solve important problems. We’re a network of firms in 157 countries with more than 208,000 people who are committed to delivering quality in assurance, advisory and tax services.
Find out more and tell us what matters to you by visiting us at www.pwc.com. PwC refers to the PwC network and/or one or more of its member firms, each of which is a separate legal entity. Please see www.pwc.com/structure for further details. www.pwc.com Founded in 1999, the Renault-Nissan Alliance is the longest-lasting cross-cultural combination among major automakers.
It sells one in 10 cars globally and employs nearly 450,000 people in nearly 200 countries. Renault and Nissan are separate companies but enjoy a cross-shareholding partnership which focuses on resultsdriven synergies and respects brand and corporate identities. The Alliance has expanded to include collaborations with Germany’s Daimler, China’s Dong Feng and Russia’s AvtoVAZ, among others.
Renault and Nissan are the only automakers massproducing and selling zero-emission vehicles, including the Nissan LEAF and Renault Zoe, which are 100% electric and can be fully recharged with purely renewable energy. Together, the Alliance has sold more than 200,000 electric vehicles—more than all of the other major automakers combined. The Alliance is committed to expanding the zero-emission infrastructure around the world and has agreements with over 100 cities, states and countries that are working to ensure electric vehicles are both affordable and convenient. www.alliance-renault-nissan.com 156 | The Future of Jobs Report .
Takeda Pharmaceutical is a global pharmaceutical company with a presence in more than 70 countries around the world. The company has a history spanning over 230 years and is currently the top pharmaceutical company in Japan and Asia, as well as one of the top 20 pharmaceutical firms globally. It pursues its mission to strive towards better health for people worldwide through leading innovation in medicine in four therapeutic areas: CNS, cardiovascular and metabolic diseases, gastroenterology and oncology. www.takeda.com Tupperware Brands Corporation is the leading global marketer of innovative, premium products across multiple brands, utilizing a relationship-based selling method through an independent sales force of 2.9 million. For more than 65 years, Tupperware Brands has connected women through its worldwide sales force—propelling the organization’s business objectives while positively impacting the lives of women through a unique business model that educates and empowers through economic opportunities, training and enhanced self-confidence. www.tupperwarebrands.com The Future of Jobs Report | 157 .
. The World Economic Forum, committed to improving the state of the world, is the International Organization for Public-Private Cooperation. The Forum engages the foremost political, business and other leaders of society to shape global, regional and industry agendas. World Economic Forum 91–93 route de la Capite CH-1223 Cologny/Geneva Switzerland Tel.: +41 (0) 22 869 1212 Fax: +41 (0) 22 786 2744 contact@weforum.org www.weforum.org . . . . .
If the Data is materially transformed by the user, this must be stated explicitly along with the required source citation. For Data compiled by parties other than the World Economic Forum, users must refer to these parties’ terms of use, in particular concerning the attribution, distribution, and reproduction of the Data. When Data for which the World Economic Forum is the source (herein “World Economic Forum”) is distributed or reproduced, it must appear accurately and be attributed to the World Economic Forum. This source attribution requirement is attached to any use of Data, whether obtained directly from the World Economic Forum or from a user. Users who make World Economic Forum Data available to other users through any type of distribution or download environment agree to make reasonable efforts to communicate and promote compliance by their end users with these terms. Users who intend to sell World Economic Forum Data as part of a database or as a standalone product must first obtain the permission from the World Economic Forum (humancapital@weforum.org). ©2016 World Economic Forum All rights reserved. No part of this publication may be reproduced or transmitted in any form or by any means, including photocopying and recording, or by any information storage and retrieval system. REF 010116 . Contents v Preface 1 PART 1: PREPARING FOR THE WORKFORCE OF THE FOURTH INDUSTRIAL REVOLUTION 3 Chapter 1: The Future of Jobs and Skills 3 Introduction 5 Drivers of Change 10 Employment Trends 19 Skills Stability 26 Future Workforce Strategy 33 34 36 37 39 40 Chapter 2: The Industry Gender Gap The Business Case for Change Gaps in the Female Talent Pipeline Barriers to Change Women and Work in the Fourth Industrial Revolution Approaches to Leveraging Female Talent 43 Endnotes 45 References and Further Reading 49 Appendix A: Report Methodology 57 Appendix B: Industry and Regional Classifications 59 PART 2: INDUSTRY, REGIONAL AND GENDER GAP PROFILES 61 69 71 91 123 User’s Guide: How to Read the Industry, Regional and Gender Gap Profiles List of Industry, Regional and Gender Gap Profiles Industry Profiles Country and Regional Profiles Industry Gender Gap Profiles 143 Acknowledgements 145 Contributors 147 Global Challenge Partners The Future of Jobs Report | iii . iv | The Future of Jobs Report . Preface KLAUS SCHWAB Founder and Executive Chairman RICHARD SAMANS Member of the Managing Board Today, we are at the beginning of a Fourth Industrial Revolution. Developments in genetics, artificial intelligence, robotics, nanotechnology, 3D printing and biotechnology, to name just a few, are all building on and amplifying one another. This will lay the foundation for a revolution more comprehensive and all-encompassing than anything we have ever seen. Smart systems—homes, factories, farms, grids or cities—will help tackle problems ranging from supply chain management to climate change.
The rise of the sharing economy will allow people to monetize everything from their empty house to their car. While the impending change holds great promise, the patterns of consumption, production and employment created by it also pose major challenges requiring proactive adaptation by corporations, governments and individuals. Concurrent to the technological revolution are a set of broader socio-economic, geopolitical and demographic drivers of change, each interacting in multiple directions and intensifying one another. As entire industries adjust, most occupations are undergoing a fundamental transformation. While some jobs are threatened by redundancy and others grow rapidly, existing jobs are also going through a change in the skill sets required to do them. The debate on these transformations is often polarized between those who foresee limitless new opportunities and those that foresee massive dislocation of jobs.
In fact, the reality is highly specific to the industry, region and occupation in question as well as the ability of various stakeholders to manage change. The Future of Jobs Report is a first step in becoming specific about the changes at hand. It taps into the knowledge of those who are best placed to observe the dynamics of workforces—Chief Human Resources and Strategy Officers—by asking them what the current shifts mean, specifically for employment, skills and recruitment across industries and geographies. In particular, we have introduced a new measure—skills stability—to quantify the degree of skills disruption within an occupation, a job family or an entire industry.
We have also been able to provide an outlook on the gender dynamics of the changes underway, a key element in understanding how the benefits and burdens of the Fourth Industrial Revolution will be distributed. Overall, there is a modestly positive outlook for employment across most industries, with jobs growth expected in several sectors. However, it is also clear that this need for more talent in certain job categories is accompanied by high skills instability across all job categories. Combined together, net job growth and skills instability result in most businesses currently facing major recruitment challenges and talent shortages, a pattern already evident in the results and set to get worse over the next five years. The question, then, is how business, government and individuals will react to these developments.
To prevent a worst-case scenario—technological change accompanied by talent shortages, mass unemployment and growing inequality—reskilling and upskilling of today’s workers will be critical. While much has been said about the need for reform in basic education, it is simply not possible to weather the current technological revolution by waiting for the next generation’s workforce to become better prepared. Instead it is critical that businesses take an active role in supporting their current workforces through re-training, that individuals take a proactive approach to their own lifelong learning and that governments create the enabling environment, rapidly and creatively, to assist these efforts. In particular, business collaboration within industries to create larger pools of skilled talent will become indispensable, as will multi-sector skilling partnerships that leverage the very same collaborative models that underpin many of the technology-driven business changes underway today. Additionally, better data and planning metrics, such as those in this Report, are critical in helping to anticipate and proactively manage the current transition in labour markets. We are grateful for the leadership of Jeffrey Joerres, Executive Chairman Emeritus, ManpowerGroup and Chair of the Global Agenda Council on the Future of Jobs; Jamie McAuliffe, President and CEO, Education for Employment and Vice-Chair of the Global Agenda Council on the Future of Jobs; J.
Frank Brown, Managing Director and Chief Operating Officer, General Atlantic LLC and Chair of the Global Agenda Council on Gender Parity and Mara Swan, Executive Vice-President, Global Strategy and Talent, ManpowerGroup and Vice-Chair of the Global Agenda Council on Gender Parity. We would also like to express our appreciation to Till Leopold, Project Lead, Employment, Skills and Human Capital Initiative; Vesselina Ratcheva, Data Analyst, Employment and Gender Initiatives; and Saadia Zahidi, Head of Employment and Gender Initiatives, for their dedication to this Report. We would like to thank Yasmina Bekhouche, Kristin Keveloh, Paulina Padilla Ugarte, Valerie Peyre, Pearl Samandari and Susan Wilkinson for their support of this project at the World Economic Forum. Finally, we welcome the untiring commitment of the Partners of the Global Challenge Initiative on Employment, Skills and Human Capital and the Global Challenge Initiative on The Future of Jobs Report | v . Gender Parity, who have each been instrumental in shaping this combined Report of the two Global Challenge Initiatives. The current technological revolution need not become a race between humans and machines but rather an opportunity for work to truly become a channel through which people recognize their full potential. To ensure that we achieve this vision, we must become more specific and much faster in understanding the changes underway and cognizant of our collective responsibility to lead our businesses and communities through this transformative moment. vi | The Future of Jobs Report . Part 1 Preparing for the Workforce of the Fourth Industrial Revolution . . Chapter 1: The Future of Jobs and Skills INTRODUCTION Disruptive changes to business models will have a profound impact on the employment landscape over the coming years. Many of the major drivers of transformation currently affecting global industries are expected to have a significant impact on jobs, ranging from significant job creation to job displacement, and from heightened labour productivity to widening skills gaps. In many industries and countries, the most in-demand occupations or specialties did not exist 10 or even five years ago, and the pace of change is set to accelerate. By one popular estimate, 65% of children entering primary school today will ultimately end up working in completely new job types that don’t yet exist.1 In such a rapidly evolving employment landscape, the ability to anticipate and prepare for future skills requirements, job content and the aggregate effect on employment is increasingly critical for businesses, governments and individuals in order to fully seize the opportunities presented by these trends—and to mitigate undesirable outcomes. Past waves of technological advancement and demographic change have led to increased prosperity, productivity and job creation.
This does not mean, however, that these transitions were free of risk or difficulty. Anticipating and preparing for the current transition is therefore critical. As a core component of the World Economic Forum’s Global Challenge Initiative on Employment, Skills and Human Capital, the Future of Jobs project aims to bring specificity to the upcoming disruptions to the employment and skills landscape in industries and regions—and to stimulate deeper thinking about how business and governments can manage this change.
The industry analysis presented in this Report will form the basis of dialogue with industry leaders to address industry-specific talent challenges, while the country and regional analysis presented in this Report will be integrated into national and regional public-private collaborations to promote employment and skills. The Report’s research framework has been shaped and developed in collaboration with the Global Agenda Council on the Future of Jobs and the Global Agenda Council on Gender Parity, including leading experts from academia, international organizations, professional service firms and the heads of human resources of major organizations. The employer survey at the heart of this Report was conducted through the World Economic Forum’s membership and with the particular support of three Employment, Skills and Human Capital Global Challenge Partners: Adecco Group, ManpowerGroup and Mercer. This Report seeks to understand the current and future impact of key disruptions on employment levels, skill sets and recruitment patterns in different industries and countries. It does so by asking the Chief Human Resources Officers (CHROs) of today’s largest employers to imagine how jobs in their industry will change up to the year 2020— far enough into the future for many of today’s expected trends and disruptions to have begun taking hold, yet close enough to consider adaptive action today, rather than merely speculate on future risks and opportunities. While only a minority of the world’s global workforce of more than three billion people is directly employed by large and emerging multinational employers, these companies often act as anchors for smaller firms and local entrepreneurship ecosystems.
Therefore, in addition to their own significant share of employment, workforce-planning decisions by these firms have the potential to transform local labour markets through indirect employment and by setting the pace for changing skills and occupational requirements. This Report aims to serve as a call to action. While the implications of current disruptions to business models for jobs are far-reaching, even daunting, rapid adjustment to the new reality and its opportunities is possible, provided there is concerted effort by all stakeholders. By evaluating the future labour market from the perspective of some of the world’s largest employers we hope to improve the current stock of knowledge around anticipated skills needs, recruitment patterns and occupational requirements. Furthermore, it is our hope that this knowledge can incentivize and enhance partnerships between governments, educators, training providers, workers and employers in order to better manage the transformative impact of the Fourth Industrial Revolution on employment, skills and education. Survey and Research Design The dataset that forms the basis of this Report is the result of an extensive survey of CHROs and other senior talent and strategy executives of leading global employers, representing more than 13 million employees across 9 broad industry sectors in 15 major developed and emerging economies and regional economic areas.
Our target pool of respondents comprised, as the primary selection criterion, the 100 largest global employers in each of our target industry sectors (as classified by the World Economic Forum; see Appendix B, Table B1). A total of 371 individual companies from these industries and regions responded to the survey over the first half of 2015, providing us with 1,346 detailed occupation-level data points on mass employment, The Future of Jobs Report | 3 . Figure 1A: Sample overview by number of employees Table 1: Employees represented by companies surveyed Industry group Basic and Infrastructure Up to 500 More than 50,000 Number of employees 1,486,000 Chemicals Number of employees Infrastructure and Urban Development Mining and Metals 500– 5,000 Consumer 1,672,000 Agriculture, Food and Beverage Retail, Consumer Goods and Lifestyle Energy 5,000–50,000 1,506,000 Energy Utilities and Technology Oil and Gas Renewable Energy Financial Services & Investors 1,050,000 Banking and Capital Markets Figure 1B: Sample overview by respondent job titles Insurance and Asset Management Private Investors Institutional Investors, Sovereign Funds, Family Offices Healthcare 821,000 Global Health and Healthcare HR Manager, Functional Information and Communication Technology Respondent Job Titles 2,447,000 Information Technology CHROs Telecommunications Media, Entertainment and Information 358,000 Media, Entertainment and Information CEO, C-Suite, Board Mobility 2,602,000 Aviation and Travel Automotive Supply Chain and Transportation Professional Services 1,607,000 Professional Services Industries Overall specialist and newly emerging occupations based in specific geographic locations across these companies’ global operations.2 A quarter of the companies surveyed employ more than 50,000 people globally; another 40% have between 5,000 and 50,000 employees; the remaining third is equally split between employers with 500 to 5,000 staff and high-growth companies with currently up to 500 employees. Nearly half of our respondents identified themselves as the Chief Human Resources Officers (CHROs) for their companies at the global level; another third identified as C-suite or board level representatives of their organizations; and the rest identified as strategy officers or human resources line managers, country directors or functional leads. While the majority of the large employers in our sample have worldwide operations and employee bases, including in several or all of the focus countries of our survey, they are typically headquartered in a more limited number of these countries. To ensure geographical balance, our sample pool included at least 50 companies each from our list of target geographies. We only report country-level findings when we have at least 30 unique data points on local employees in 4 | The Future of Jobs Report 13,549,000 that country. Accordingly, the countries and economic areas covered in-depth by the Report are: the Association of Southeast Asian Nations (ASEAN), Australia, Brazil, China, France, Germany, the Gulf Cooperation Council (GCC), India, Italy, Japan, Mexico, South Africa, Turkey, the United Kingdom and the United States (Figure 1C). In addition, our survey sample was constructed on the basis of nine broad industry sectors as defined by the Wold Economic Forum, with a view to balanced industry results in terms of number of companies and employees represented. For each sector, our target list of respondents identified the leading large and emerging employers in that industry (see Appendix A: Report Methodology for details). Our analysis groups job functions into specific occupations and broader job families, based on a streamlined version of the O*NET labour market information system widely used by the US Department of Labor and labour market researchers worldwide.3 In addition, we asked respondents to provide a gender breakdown for the employee functions they listed.
The geographic balance of our sample enables a nuanced view on the outlook for job functions in different countries and industries, covering both . Figure 1C: Sample overview by geographic coverage white-collar and blue-collar workers, and both high-income and low-income countries. In the current era of global value chains, many companies are locating different job functions and categories in different geographic locations to take advantage of the specific strengths of particular local labour markets. In addition to asking respondents to provide details on the geographical spread of their workforce, we asked them to distinguish between mass employment jobs (i.e. job functions that are significant to the company’s operations in terms of the absolute number of employees since they form the bulk of its workforce) and specialist jobs (i.e. job categories, such as design and R&D, that are significant to the company’s operations—not necessarily in terms of the absolute number of employees but because they provide specialist skills crucial to its value proposition).
Following this task approach to the global labour market, we found that— depending on the nature of their business—our respondents often locate these functions in different geographic locations.4 Demographic, socio-economic and—increasingly— technological trends and disruptions to the business and operating models of global companies have the potential to rapidly change the dynamics of the global employment landscape. In addition to the outlook for existing roles, we asked respondents to tell us about wholly new occupations and fields of specialization they expect to emerge in their industries as well as those they foresee to be made obsolete over the coming years until 2020. Structure of the Report This Report consists of two parts. Part I explores the future of jobs and the pace of change to the global employment landscape up until the year 2020, as anticipated by the CHROs of some of the world’s largest employers.
It touches, first, on the expected trends, disruptions and drivers of change transforming business models in every industry, with far-reaching implications for skills, jobs and the nature of work. It then reviews the expected effects on employment levels and skills profiles in different job families, industries and geographies. It discusses consequences of these changes for the adequacy of existing talent and workforce strategies.
Finally, in a dedicated chapter, it explores the implications of today’s transformations on the future of women’s workforce participation. Part II of the Report presents our findings through an industry, regional and industry gender gap lens—highlighting key industry-by-industry and region-specific trends—and provides a wealth of industry-specific and country-specific practical information to senior decision-makers and experts through dedicated Industry Profiles, Country and Regional Profiles and Industry Gender Gap Profiles. Finally, a detailed Methodological Appendix provides further information on our survey design, sample selection criteria and research methodology. DRIVERS OF CHANGE According to many industry observers, we are today on the cusp of a Fourth Industrial Revolution. Developments in previously disjointed fields such as artificial intelligence and machine learning, robotics, nanotechnology, 3D printing and genetics and biotechnology are all building on and The Future of Jobs Report | 5 . Table 2: Significance, timeframe and definition of drivers of change DEMOGRAPHIC AND SOCIO-ECONOMIC DRIVERS OF CHANGE Driver of change Rated as top trend Expected timeframe Definition Changing work environments and flexible working arrangements 44% Impact felt already New technologies are enabling workplace innovations such as remote working, co-working spaces and teleconferencing. Organizations are likely to have an ever-smaller pool of core full-time employees for fixed functions, backed up by colleagues in other countries and external consultants and contractors for specific projects. Rise of the middle class in emerging markets 23% Impact felt already The world’s economic centre of gravity is shifting towards the emerging world. By 2030, Asia is projected to account for 66% of the global middle-class and for 59% of middle-class consumption. Climate change, natural resource constraints and the transition to a greener economy 23% Impact felt already Climate change is a major driver of innovation, as organizations search for measures to mitigate or help adjust to its effects. Yet as global economic growth continues to lead to demand for natural resources and raw materials, over-exploitation implies higher extraction costs and degradation of ecosystems. Rising geopolitical volatility 21% Impact felt already The geopolitical landscape is constantly changing, with far-reaching implications for global trade and talent mobility, requiring industries such as Oil and Gas or Aviation and Tourism to react and adapt faster than ever before. New consumer concerns about ethical and privacy issues 16% 2015–2017 In many economies consumers are increasingly concerned about a range of issues related to their purchasing decisions: carbon footprint; impact on the environment; food safety; labour standards; animal welfare; and a company’s record on ethical trade. Additionally, internet users have increasingly become aware of issues around data security and online privacy. Longevity and ageing societies 14% 2015–2017 Over the next decade, advanced economies will see the effects of an ageing population.
Increasingly, people will work past age 65 to secure adequate resources for retirement. At the same time, serving the needs of an older society will create opportunities for new products, services and business models. Young demographics in emerging markets 13% Women’s rising aspirations and economic power 12% Rapid urbanization 6 | The Future of Jobs Report 8% Impact felt already 2015–2017 Impact felt already Much of the developing world is experiencing rapid population growth and faces a very different demographic challenge than advanced economies: devising appropriate education and training systems to prepare an overwhelmingly young population for the workplace. Leading emerging nations continue to move up the skills ladder and improve access to high-quality education, contributing to a dramatic rise in the number of the college-educated and a shift in the global distribution of talent. Women have made significant gains in labour force participation and educational attainment, resulting in an increasingly important role in the economy as both consumers and employees.
As a market, women will account for US$ 5 trillion additional consumer spending and more than two thirds of global disposable income over the next decade. The world's urban population is set to double between 2010 and 2050, from 2.6 billion to 5.2 billion. This rapid and unprecedented pace of urbanization, especially in markets such as China and Sub-Saharan Africa, brings with it many opportunities as well as challenges. . Table 2: Significance, timeframe and definition of drivers of change (cont’d.) TECHNOLOGICAL DRIVERS OF CHANGE Driver of change Rated as top trend Expected timeframe Mobile internet and cloud technology 34% 2015–2017 The mobile internet has applications across business and the public sector, enabling more efficient delivery of services and opportunities to increase workforce productivity. With cloud technology, applications can be delivered with minimal or no local software or processing power, enabling the rapid spread of internet-based service models. Advances in computing power and Big Data 26% 2015–2017 Realizing the full potential of technological advances will require having in place the systems and capabilities to make sense of the unprecedented flood of data these innovations will generate. New energy supplies and technologies 22% 2015–2017 New energy supplies and technologies, such as renewables and hydraulic fracturing (fracking), are shaking up the global energy landscape and disrupting powerful players at least as much as yesterday’s oil price crises did, with profound and complicated geopolitical and environmental repercussions. The Internet of Things 14% 2015–2017 The use of remote sensors, communications, and processing power in industrial equipment and everyday objects will unleash an enormous amount of data and the opportunity to see patterns and design systems on a scale never before possible. Crowdsourcing, the sharing economy and peer-to-peer platforms 12% Advanced robotics and autonomous transport 9% 2018–2020 Advanced robots with enhanced senses, dexterity, and intelligence can be more practical than human labour in manufacturing, as well as in a growing number of service jobs, such as cleaning and maintenance. Moreover, it is now possible to create cars, trucks, aircraft, and boats that are completely or partly autonomous, which could revolutionize transportation, if regulations allow, as early as 2020. Artificial intelligence and machine learning 7% 2018–2020 Advances in artificial intelligence, machine learning, and natural user interfaces (e.g. voice recognition) are making it possible to automate knowledge-worker tasks that have long been regarded as impossible or impractical for machines to perform. Advanced manufacturing and 3D printing 6% 2015–2017 A range of technological advances in manufacturing technology promises a new wave of productivity.
For example, 3D printing (building objects layer-by-layer from a digital master design file) allows on-demand production, which has far-ranging implications for global supply chains and production networks. Advanced materials, biotechnology and genomics 6% 2018–2020 Technological advances in material and life sciences have many innovative industry applications. Recent breakthroughs in genetics could have profound impacts on medicine and agriculture. Similarly, the manufacture of synthetic molecules via bio-process engineering will be critical to pharmaceuticals, plastics and polymers, biofuels, and other new materials and industrial processes. Impact felt already Definition With peer-to-peer platforms, companies and individuals can do things that previously required large-scale organizations.
In some cases the talent and resources that companies can connect to, through activities such as crowdsourcing, may become more important than the in-house resources they own. The Future of Jobs Report | 7 . Figure 2: Drivers of change, industries overall Share of respondents rating driver as top trend, % DEMOGRAPHIC AND SOCIO-ECONOMIC Changing nature of work, flexible work 44% Middle class in emerging markets 23% Climate change, natural resources 23% Geopolitical volatility 21% Consumer ethics, privacy issues 16% Longevity, ageing societies 14% Young demographics in emerging markets 13% Women’s economic power, aspirations 12% Rapid urbanization 8% TECHNOLOGICAL Mobile internet, cloud technology 34% Processing power, Big Data 26% New energy supplies and technologies 22% Internet of Things 14% Sharing economy, crowdsourcing 12% Robotics, autonomous transport 9% Artificial intelligence 7% Adv. manufacturing, 3D printing 6% Adv. materials, biotechnology 6% 0.0 Source: Future of Jobs Survey, World Economic Forum. 0.0 Note: Names of drivers have been abbreviated to ensure legibility. 0.1 0.2 0.3 0.4 0.5 0.1 0.2 0.3 0.4 0.5 amplifying one another. Smart systems—homes, factories, farms, grids or entire cities—will help tackle problems ranging from supply chain management to climate change. Concurrent to this technological revolution are a set of broader socio-economic, geopolitical and demographic developments, each interacting in multiple directions and intensifying each another. While these impending changes hold great promise for future prosperity and job creation, many of them also pose major challenges requiring proactive adaptation by corporations, governments, societies and individuals.
As whole industries adjust and new ones are born, many occupations will undergo a fundamental transformation. Together, technological, socio-economic, geopolitical and demographic developments and the interactions between them will generate new categories of jobs and occupations while partly or wholly displacing others. They will change the skill sets required in both old and new occupations in most industries and transform how and where people work, leading to new management and regulatory challenges. 8 | The Future of Jobs Report Given the rapid pace of change, business model disruptions are resulting in a near-simultaneous impact on employment and need for new skill sets, requiring an urgent and concerted effort for adjustment. So far, the debate on these transformations has been sharply polarized between those who foresee limitless new opportunities and those that foresee a massive dislocation of jobs. In fact, the reality is likely to be highly specific to the industry, region and occupation in question and the ability of various stakeholders to successfully manage change.
A major goal of this Report is to unpack the relative impact of key drivers of change and provide specific information on the relative magnitude of these expected changes by industry and geography, and the expected time horizon for their impact to be felt on job functions, employment levels and skills. . Table 3: Significance of drivers of change, by industry Share of respondents rating driver as top trend, % BAS CON EN FS HE ICT MEI MOB PS OVERALL Changing nature of work, flexible work 46 42 46 26 20 36 36 35 63 44 Mobile internet, cloud technology 8 17 0 41 50 69 57 16 38 34 Processing power, Big Data 5 8 4 44 20 44 36 6 40 26 Middle class in emerging markets 15 42 0 41 40 8 21 39 13 23 New energy supplies and technologies 38 21 71 3 10 17 0 26 5 22 Climate change, natural resources 49 21 50 3 0 8 7 32 8 23 Geopolitical volatility 28 25 29 26 0 3 14 16 10 21 Consumer ethics, privacy issues 3 21 8 18 20 31 21 10 20 16 Internet of Things 8 13 4 12 10 33 14 6 15 14 Longevity, ageing societies 13 17 13 9 40 14 14 3 13 14 Young demographics in emerging markets 10 17 17 24 10 3 21 13 8 13 Sharing economy, crowdsourcing 3 4 4 18 10 11 21 6 25 12 Women's economic power, aspirations 10 21 13 9 10 3 7 6 15 12 Robotics, autonomous transport 15 8 4 3 0 0 7 29 5 9 Rapid urbanization 13 4 13 3 0 6 14 10 8 8 Adv. manufacturing, 3D printing 10 4 8 0 0 6 0 16 3 6 Artificial intelligence 5 0 8 3 0 6 7 16 5 7 Adv. materials, biotechnology 8 4 0 3 30 0 0 13 0 6 Driver of change Source: Future of Jobs Survey, World Economic Forum. Note: Names of drivers have been abbreviated to ensure legibility. Technological, Demographic and Socio-Economic Trends Affecting Business Models Figure 2 lists the major industry drivers of change and disruptions to business models identified by the senior executives in our survey, ranked according to the share of respondents who expected each trend to be among the top trends impacting their industry by the year 2020. Table 2 provides a short description of each trend and the median time horizon by which it is expected to start impacting the respondent’s industry. Collectively, technological disruptions are seen as very significant drivers of industrial change by the respondents. Among these, growth in cheap computing power and the ubiquity of the mobile internet have already had widespread impact on existing business models.
Additionally, even technological trends whose potentially far-ranging implications have not yet fully materialized—such as 3D printing, artificial intelligence and the Internet of Things—are expected to be well underway in specific industries in the years leading up to 2020. Industry codes Code Industry BAS Basic and Infrastructure CON Consumer EN Energy FS Financial Services & Investors HE Healthcare ICT Information and Communication Technology MEI Media, Entertainment and Information MOB Mobility PS Professional Services Demographic and socio-economic shifts are expected to have nearly as strong an impact on business models and organizational structures as technological change. Application of technology has already changed when and where work is done in practically every industry as workplaces of the industrial age give way to work practices of the digital age, including remote work, flexible work and The Future of Jobs Report | 9 . Figure 3: Timeframe to impact industries, business models Impact felt already 2015–2017 2018–2020 »» Rising geopolitical volatility »» Mobile internet and cloud technology »» Advances in computing power and Big Data »» Crowdsourcing, the sharing economy and peer-to-peer platforms »» Rise of the middle class in emerging markets »» Young demographics in emerging markets »» Rapid urbanization »» Changing work environments and flexible working arrangements »» Climate change, natural resource constraints and the transition to a greener economy »» New energy supplies and technologies »» The Internet of Things »» Advanced manufacturing and 3D printing »» Longevity and ageing societies »» New consumer concerns about ethical and privacy issues »» Women’s rising aspirations and economic power »» Advanced robotics and autonomous transport »» Artificial intelligence and machine learning »» Advanced materials, biotechnology and genomics on-demand work. The rising middle class in emerging markets, the need to transition towards an environmentally sustainable economy and increased geopolitical volatility are all seen as major organizational drivers of change. Changing values and the growing ability of consumers to express these values are also transforming business models and employment. The rising role and importance of women in the economy is transforming not only the composition of the talent pool but also the nature of products catering to them specifically—and by extension the skills profiles of the jobs required.
Longevity and population ageing in advanced economies—and the opportunities and challenges it presents—are also expected to have an impact on business models, and by extension talent needs, in addition to changing the composition of the talent pool in most developed economies in particular. Industry- and Country-Level Change A number of drivers of change will have an acute impact within specific industries. At the industry level, for example, new energy supplies and technologies will have a particular impact on the Energy, Basic and Infrastructure and Mobility industries. Processing power and Big Data will have an especially strong impact on Information and Communication Technology, Financial Services and Professional Services. The rising middle class in emerging markets will have the largest effect on Consumer, Financial Services and Mobility. Consumer ethics and privacy issues will have a significant impact on the Consumer, Financial Services and Information and Communication Technology sector (see Table 3). At the country level, expectations regarding the nature of upcoming disruptions are shaped by the demographic, economic and technological development of the country in question.
Overall, changing and flexible work is seen as the most significant driver of change in advanced economies, whereas the rising middle class takes this role in emerging markets. New energy supplies and technologies are expected to play the largest role in the countries of the Gulf Cooperation Council, while climate change adaptation is seen as a particularly major driver in Germany. A number 10 | The Future of Jobs Report of developing countries expect particularly large impact from the mobile internet given that the technology has the potential to bring millions of formerly unconnected workers and consumers into the formal economy for the first time. For further details, please also refer to the Country Profiles in Part 2 of this Report. Expected Timeframe The time-to-impact trajectory of certain drivers of change differs between industries and is shaped by the specific nature of each sector’s current business model.
For example, there is a wide variety of opinion among Chief Human Resources Officers regarding the immediacy of the impact of artificial intelligence and robotics on employment and skills.5 However, regardless of the specific industry or driver of change, it is clear that the overall pace of industry transformation is wholly unprecedented. Disruptive changes to industry sectors are already re-configuring business models and skill sets—and will do so at an accelerated pace in the next five years. The current anxious debate about the long-term impact of artificial intelligence and robotics notwithstanding, our focus is on today’s workforce and talent strategies and how they can contribute to successfully managing this transition. EMPLOYMENT TRENDS Recent discussions about the employment impact of disruptive change have often been polarized between those who foresee limitless opportunities in newly emerging job categories and prospects that improve workers’ productivity and liberate them from routine work, and those that foresee massive labour substitution and displacement of jobs. Academics, chief executives and labour leaders hold strong and diverse views on the debate, as do policymakers.6 It is clear from our data that while forecasts vary by industry and region, momentous change is underway and that, ultimately, it is our actions today that will determine whether that change mainly results in massive displacement of workers or the emergence of new opportunities.
Without urgent and targeted action today to manage the near-term transition . Figure 4: Employment effect of drivers of change, all job types Compound growth rate, 2015-2020, % 7 Drivers of Change, overall Drivers of Change, technological Drivers of Change, demographic and socio-economic 1.73% 2.02% 1.50% Young demographics in emerging markets 5.16% Women’s economic power, aspirations 4.04% Middle class in emerging markets 3.13% Rapid urbanization 3.10% Adv. materials, biotechnology 3.08% Processing power, Big Data 2.95% Mobile internet, cloud technology 2.47% Internet of Things 2.27% New energy supplies and technologies 2.13% Climate change, natural resources 1.85% Changing nature of work, flexible work 1.63% Sharing economy, crowdsourcing 1.43% Robotics, autonomous transport 1.36% Consumer ethics, privacy issues 1.32% Adv. manufacturing, 3D printing Longevity, ageing societies –0.36% –0.65% Artificial intelligence –1.56% Geopolitical volatility –2.69% Source: Future of Jobs Survey, World Economic Forum. –0.02 Note: Names of drivers have been abbreviated to–0.03 legibility. ensure –0.01 and build a workforce with futureproof skills, governments will have to cope with ever-growing unemployment and inequality, and businesses with a shrinking consumer base. Our dataset aims to bring specificity to the debate and to the options for action, by providing the perspective of Chief Human Resources Officers of leading employers who are among those at the frontline of the emerging trends and are key actors in implementing future workforce strategies. Impact of Disruptive Change on Employment Overall, our respondents seem to take a negative view regarding the upcoming employment impact of artificial intelligence, although not on a scale that would lead to widespread societal upheaval—at least up until the year 2020. By contrast, further unpacking the bundle of technological drivers of change in the mould of the Fourth Industrial Revolution yields a rather more optimistic picture regarding the job creation potential of technologies such as Big Data analytics, mobile internet, the Internet of Things and robotics.
However, by far the biggest expected 0.00 0.01 0.02 0.03 0.04 0.05 drivers of employment creation are demographic and socio-economic in nature; in particular, the opportunities offered by young demographics and rising middle classes in emerging markets and the rising economic power and aspirations of women. Conversely, our respondents share a stark premonition that increasing geopolitical volatility risks being the biggest threat—by far—to employment and job creation at the global level. However, this aggregate-level view of the driving forces behind employment change masks significant variation and important nuances at the level of individual job families and occupations. Our respondents expect strong employment growth across the Architecture and Engineering and Computer and Mathematical job families, a moderate decline in Manufacturing and Production roles and a significant decline in Office and Administrative roles. Other sizeable job families, such as Business and Financial Operations, Sales and Related and Construction and Extraction have a largely flat global employment outlook over the 2015–2020 period.
Further unpacking these The Future of Jobs Report | 11 0.06 . Table 4: Employment effect of drivers of change, by job family Compound growth rate, 2015-2020, % Job family/Driver of change Computer and Mathematical Employment outlook 3.21% Job family/Driver of change Sales and Related Employment outlook 0.46% Rapid urbanization 6.11% Processing power, Big Data 1.25% Middle class in emerging markets 5.00% Sharing economy, crowdsourcing 0.58% Changing nature of work, flexible work 4.94% Mobile internet, cloud technology 0.43% Sharing economy, crowdsourcing 4.88% Internet of Things –0.89% Processing power, Big Data 4.59% Middle class in emerging markets –1.14% Internet of Things 4.54% Consumer ethics, privacy issues –1.28% Geopolitical volatility 3.89% Geopolitical volatility –1.50% Mobile internet, cloud technology 3.71% Changing nature of work, flexible work –1.51% Consumer ethics, privacy issues 2.40% New energy supplies and technologies –1.58% Architecture and Engineering 2.71% Installation and Maintenance –0.15% Middle class in emerging markets 5.88% Climate change, natural resources Robotics, autonomous transport 4.49% Changing nature of work, flexible work 0.45% Climate change, natural resources 3.68% Mobile internet, cloud technology –3.89% Internet of Things 3.54% Adv. manufacturing, 3D printing 3.33% Internet of Things Construction and Extraction 3.00% –8.00% –0.93% Changing nature of work, flexible work 3.18% New energy supplies and technologies 1.38% New energy supplies and technologies 2.25% Climate change, natural resources 0.38% 1.33% Geopolitical volatility –0.07% 0.97% Changing nature of work, flexible work –0.11% Geopolitical volatility Management Young demographics in emerging markets 2.14% Geopolitical volatility 1.67% Mobile internet, cloud technology 0.95% New energy supplies and technologies 1.44% Middle class in emerging markets –0.83% Processing power, Big Data 1.39% Geopolitical volatility –1.00% Changing nature of work, flexible work 0.90% Middle class in emerging markets 0.72% Mobile internet, cloud technology 0.62% Climate change, natural resources 0.40% Longevity, ageing societies 0.23% Arts, Design, Entertainment, Sports and Media Manufacturing and Production Adv. materials, biotechnology –1.03% –1.63% 0.67% Robotics, autonomous transport –0.83% New energy supplies and technologies –1.81% Middle class in emerging markets –2.16% 0.70% Climate change, natural resources –2.45% Sharing economy, crowdsourcing 3.11% Geopolitical volatility –2.47% Middle class in emerging markets 1.96% Changing nature of work, flexible work –2.99% Changing nature of work, flexible work 1.88% Longevity, ageing societies –3.13% Young demographics in emerging markets 1.67% Adv. manufacturing, 3D printing –3.60% Business and Financial Operations Geopolitical volatility 1.59% Climate change, natural resources 1.39% Processing power, Big Data 1.34% Mobile internet, cloud technology 1.03% Consumer ethics, privacy issues 0.54% Office and Administrative –4.91% Changing nature of work, flexible work –2.77% New energy supplies and technologies –3.33% Mobile internet, cloud technology –5.82% Processing power, Big Data –6.06% Consumer ethics, privacy issues –6.18% Internet of Things –6.20% Rapid urbanization –6.36% Climate change, natural resources –6.67% Geopolitical volatility –9.72% Source: Future of Jobs Survey, World Economic Forum. Note: Names of drivers have been abbreviated to ensure legibility. expectations according to the factors driving employment change makes clear the true scale of impending industry and occupational transformation.
See Table 4 for details on these expectations. The expected global decline in total Manufacturing and Production roles is driven by labour-substituting technologies such as additive manufacturing and 3D printing as much as by more resource-efficient sustainable 12 | The Future of Jobs Report product use, lower demand growth in ageing societies and threats to global supply chains due to geopolitical volatility. Some cautious optimism is warranted due to increased manufacturing demand for advanced materials and comparatively favourable expectations around robotics, pointing to the latter’s potential for labour-complementing productivity enhancement rather than pure job replacement. . Conversely, 3D printing, resource-efficient sustainable production and robotics are all seen as strong drivers of employment growth in the Architecture and Engineering job family, in light of a continued and fast-growing need for skilled technicians and specialists to create and manage advanced and automated production systems. This is expected to lead to a transformation of manufacturing into a highly sophisticated sector where high-skilled engineers are in strong demand to make the industrial Internet of Things a reality. The fortunes of other job families due to these same factors are mixed. Installation and Maintenance jobs, for example, will see great productivity enhancements and strong growth in green jobs such as the installation, retrofitting, repair and maintenance of smart meters and renewable energy technologies in residential and office buildings, but—at an aggregate level—will also come faceto-face with the efficiency-saving and labour-substituting aspect of the Internet of Things. Similarly, despite some challenges, global demographics will sustain demand for Construction and Extraction jobs.
Resource-efficiency is expected to be another key driving factor for this job family, at least in the case of construction, in the creation of new and improvement of existing housing stock, often using new construction techniques, materials and approaches. Automation of checkout processes and smart inventory management through sensors and other applications of the Internet of Things are some of the factors expected to lead to a decrease in demand for traditional roles in the Sales and Related job family. Consumer ethics and green consumption practices are likewise anticipated to impact negatively on traditional roles in the job family, though perhaps with an upside for employees with skills in accrediting and advising on eco-labelled products. The strongest employment growth in the sector is expected to come from a continued shift towards online shopping and the application of Big Data analytics to derive and act upon insights from customer data and preferences to provide a personalised shopping experience. Two further job families with mainly flat aggregate employment outlooks over the coming years are Business and Financial Operations and Management.
Each is affected by a very wide range of factors, hinting at the scale of transformation and upskilling needs these job families will undergo over the coming years. Strong employment growth in the Computer and Mathematical job family is driven by trends beyond technology, such as rapid urbanization in developing countries, as well as by disruptions that negatively affect the employment outlook in other job families, such as geopolitical volatility and privacy issues—as companies from virtually all industries seek to recruit specialists that can help them apply tools such as Big Data analytics and data visualization to better understand and cope with these issues. The biggest employment decline of any job family is expected in Office and Administrative roles, which are expected to be negatively affected by a perfect storm of technological trends that have the potential to make many of them redundant, such as mobile internet and cloud technology, Big Data analytics and the Internet of Things, but also factors such as climate change and resource efficiency and workplace flexibility that undermine the rationale for maintaining a large workforce within these roles. Interestingly, our respondents expect a comparatively small employment impact from two disruptions that currently receive significant attention. Where it is mentioned, the artificial intelligence and machine learning driver is expected to lead to negative employment outcomes in job families such as Education and Training, Legal and Business and Financial Operations. However, it appears our respondents do not believe that these technologies will have advanced significantly enough by the year 2020 to have a more widespread impact on global employment levels.
Similarly, the sharing economy may have the potential to radically transform the way work is organized and regulated in certain job families, with all the opportunities and challenges this entails; but where it is mentioned as a driver of change to employment, its effect is largely seen as benign in the next five years. Our analysis reveals that upcoming disruptions to the employment landscape are going to be a lot more complex and multi-faceted than conveyed by a narrow focus only on automation, and that we must act within the current window offered by the varying speeds of technological transformations to prepare. Global Net Employment Effects The survey results provide direct information on the expected relative employment changes to job families over the period 2015–2020. It is possible to extrapolate from these values the estimated numbers of jobs created or lost in absolute terms worldwide.
Between them, the 15 economies covered by our data account for about 1.86 billion workers, approximately 65% of the world’s total workforce. Using the standardized occupational classification behind our research framework, we have estimated the total number of people employed in any given job family in each of our focus countries (although for China, which accounts for 770 million workers out of our total, this data is unfortunately not available in a directly comparable format8).Therefore, we can give an estimate of the net effect on global employment of the trends and disruptions anticipated by the respondents covered by our Report. According to these calculations, current trends could lead to a net employment impact of more than 5.1 million jobs lost to disruptive labour market changes over the period 2015–2020, with a total loss of 7.1 million jobs— two thirds of which are concentrated in the Office and Administrative job family—and a total gain of 2 million jobs, in several smaller job families. A number of conclusions stand out: • The global workforce is expected by our respondents to experience significant churn between job families and functions, with administrative and routine white‑collar office functions at risk of being decimated and strong growth in Computer and Mathematical The Future of Jobs Report | 13 .
Figure 5: Total workforce by job family Employees (thousands, all focus countries) 264,365 Farming, Fishing and Forestry 98,723 Manufacturing and Production 96,928 Office and Administrative 89,613 Hospitality and Food Related 79,619 and Architecture and Engineering related fields. Manufacturing and Production roles are also expected to see a further bottoming out but might have the worst behind them and still retain relatively good potential for upskilling, redeployment and productivity enhancement through technology rather than pure substitution. Transportation and Logistics 70,282 Business and Financial Operations 65,787 Sales and Related 55,266 Personal Care and Service 53,404 Construction and Extraction 42,838 Management 38,727 Community, Social and Protective Services 26,887 Installation and Maintenance 18,799 Healthcare Practitioners and Technicians 15,663 Life, Physical, and Social sciences 14,659 Education and Training 14,628 Arts, Design, Entertainment, Sports and Media 12,605 Computer and Mathematical 12,511 Architecture and Engineering 6,550 Legal 14 | The Future of Jobs Report • Employment growth is expected to derive disproportionately from smaller, generally high-skilled job families that will be unable to absorb job losses coming from other parts of the labour market. Even if they could, significant reskilling would be needed. This factor plus the increase in global unemployment due to global population growth and slow job creation over the period 2015-20199 leaves no room for complacency. • Once emerging markets and developing countries are added into the equation, any discussion of the Future of Jobs remains incomplete without recognizing that a significant share of the global workforce remains employed in agriculture, about which both current technology optimists and alarmists have comparatively little to say. Similarly, a potential field of employment growth around which our survey yielded only limited data points concerns the Personal Care and Service job family, since jobs in this field are not typically found on a large scale among large multinational employers.10 Indeed, there is cause for optimism about growth in these roles as demand for such services grows due to demographic and social factors. • There is a strong gender dimension to expected employment changes whereby, notably, gender gaps appear to be more pronounced within both high growth and declining job families. For example, women make up low numbers in the fast-growing STEM job families, pointing, on current trends, to a deteriorating gender gap over time; but also low numbers within job families such as Manufacturing and Production or Construction and Extraction, where expected job losses will disproportionately affect men.
However, female employment is also concentrated in low-growth or declining job families such as Sales, Business and Financial Operations and Office and Administrative, indicating, if our respondents’ expectations come to pass, a possible reversal of some of the gains made in workplace gender parity over the past decade. Employment Trends by Industry From an industry-level perspective, there is a modestly positive outlook for employment across most sectors over the 2015–2020 period. However, underneath this aggregate outlook there is once again significant relative growth in some job families and significant relative decline in others, resulting from the accelerating pace of transformation within many industries. For further details, please also refer to the Industry Profiles in Part 2 of the Report. .
Figure 6: Net employment outlook by job family, 2015–2020 Employees (thousands, all focus countries) –4,759 Office and Administrative +492 Business and Financial Operations –1,609 Manufacturing and Production +416 Management –497 Construction and Extraction +405 Computer and Mathematical –151 Arts, Design, Entertainment, Sports and Media +339 Architecture and Engineering –109 Legal +303 Sales and Related –40 Installation and Maintenance The Computer and Mathematical job family is anticipated by our respondents to experience very high growth centred on data analysts and software and applications developers—not just within the Information and Communication Technology industry but across a wide range of industries, including Financial Services & Investors, Media, Entertainment and Information, Mobility and Professional Services, as computing power and Big Data analytics constitutes a significant driver of employment growth in each. In fact, employment growth for Computer and Mathematical roles is expected to be least pronounced in the Information and Communication Technology sector itself, hinting at the accelerated demand for data analysis skills and ICT literacy across, and uptake of these tools by, other industries. For example, the Media, Entertainment and Information industry is expecting a flat employment outlook with regard to its core Arts, Design, Entertainment, Sports and Media job family, combined with high growth in the Computer and Mathematical field, as the industry fully embraces its digital transformation. In this same vein, solid job growth is expected for Architecture and Engineering roles, particularly in the Consumer, Information and Communication Technology and Mobility industries. By contrast, demand for additional engineering talent in its traditional core Basic and Infrastructure and Energy industries is fairly flat. Both of the latter are also expecting declining demand for Manufacturing and Production and Construction +66 Education and Training and Extraction roles such as Chemical Processing Plant Operators and Mining and Petroleum Extraction Workers, as both industries are facing headwinds over the coming years. The Consumer industry is likewise reducing its Manufacturing and Production roles but anticipates at least stable overall demand for Sales and Related jobs, as rising middle classes in emerging markets, changing consumer values and, in particular, the rising economic power of women, are significant drivers of job growth in the sector. The Mobility industry is anticipating significant growth in Transportation and Logistics roles, as it plays its traditional role of connecting countries and industries in the wake of increasing globalization as well as, increasingly, catering to travellers from rising middle classes in emerging markets. However, geopolitical volatility and its associated threat to global travel and supply chains are perceived as major negative drivers of employment outlook in the industry. On the automotive manufacturing side of the sector, disruptions such as advanced robotics, autonomous transport, 3D printing and new energy technologies will have some of the most direct impacts on jobs of any industry. Similarly, the Financial Services & Investors sector will undergo a significant shift, with major job growth for Computer and Mathematical roles such as data analysts, information security analysts and database and network professionals.
A rising middle class and young demographics in emerging markets are significant sources of future job growth in the sector. The Future of Jobs Report | 15 . Table 5: Employment effect of drivers of change, by industry Compound growth rate, 2015-2020, % Industry/Driver of change Basic and Infrastructure Employment outlook 0.61% Industry/Driver of change Information and Communication Technology Employment outlook 2.91% Rapid urbanization 7.00% Processing power, Big Data Middle class in emerging markets 3.33% Mobile internet, cloud technology 4.78% New energy supplies and technologies 2.00% Consumer ethics, privacy issues 3.33% Climate change, natural resources 1.39% New energy supplies and technologies 2.50% Changing nature of work, flexible work 0.29% Internet of Things 2.27% Robotics, autonomous transport 0.00% Changing nature of work, flexible work 2.08% Longevity, ageing societies –7.00% Longevity, ageing societies –1.25% Geopolitical volatility –7.27% Media, Entertainment and Information 5.00% 2.31% 1.72% Processing power, Big Data Women's economic power, aspirations 3.75% Mobile internet, cloud technology 3.57% Consumer ethics, privacy issues 2.00% Changing nature of work, flexible work –2.00% Changing nature of work, flexible work 1.50% Middle class in emerging markets 1.25% Climate change, natural resources 2.50% Climate change, natural resources 1.25% New energy supplies and technologies 2.50% New energy supplies and technologies 1.00% Middle class in emerging markets 2.27% Geopolitical volatility 0.00% Robotics, autonomous transport 1.25% 1.54% Artificial intelligence 1.25% New energy supplies and technologies 2.19% Mobile internet, cloud technology 1.00% Changing nature of work, flexible work 1.00% Adv. manufacturing, 3D printing 1.00% Climate change, natural resources 0.83% Changing nature of work, flexible work 0.56% Geopolitical volatility –5.00% Geopolitical volatility –6.00% 1.54% Professional Services 2.45% Consumer Energy Financial Services & Investors Mobility 8.00% 1.61% Young demographics in emerging markets 6.25% Women's economic power, aspirations 5.00% Middle class in emerging markets 5.00% Middle class in emerging markets 5.00% Processing power, Big Data 1.54% Changing nature of work, flexible work 4.00% Mobile internet, cloud technology 1.15% Processing power, Big Data 2.35% Sharing economy, crowdsourcing 0.83% Mobile internet, cloud technology 2.14% Consumer ethics, privacy issues 0.83% Sharing economy, crowdsourcing 1.67% Changing nature of work, flexible work 0.63% Internet of Things 1.00% –2.22% Consumer ethics, privacy issues 0.71% –0.37% Longevity, ageing societies 0.00% Geopolitical volatility Healthcare Mobile internet, cloud technology –3.00% –3.00% Source: Future of Jobs Survey, World Economic Forum. Note: Names of drivers have been abbreviated to ensure legibility. Many industry observers expect a substantial increase in the number of jobs in the Healthcare sector due to demographic trends such a longevity and ageing populations in advanced economies. However, our survey respondents expect a stable employment outlook for the industry over the coming five years—and a net negative impact on the number of jobs from disruptions such as mobile internet and cloud technology, enabling widespread application of telemedicine. What seems certain is that the skills profile of many jobs in the sector will change significantly. Our respondents anticipate that the Professional Services industry will experience employment growth over the 2015–2020 period, particularly in data analytics roles, especially as the consulting arm of the sector experiences growth by advising all others on their respective transformations.
Accordingly, factors affecting jobs in the industry are influenced by those affecting all the others. With regards to business models in the Professional 16 | The Future of Jobs Report Services industry itself, some of the major influences will be automation or globalized crowdsourcing via online platforms of high-skilled but repetitive work processes, leading to increased off-shoring of back office roles and a rise in timelimited, project-based contracts. New and Emerging Roles Our research also explicitly asked respondents about new and emerging job categories and functions that they expect to become critically important to their industry by the year 2020, and where within their global operations they would expect to locate such roles. Two job types stand out due to the frequency and consistency with which they were mentioned across practically all industries and geographies. The first are data analysts, as already frequently mentioned above, which companies expect will help them make sense and derive insights from the torrent of data generated by the technological disruptions referenced above. The second .
are specialized sales representatives, as practically every industry will need to become skilled in commercializing and explaining their offerings to business or government clients and consumers, whether due to the innovative technical nature of the products themselves, due to their being targeted at new client types with which the company is not yet familiar, or both. Other new specialties frequently mentioned include new types of human resources and organizational development specialists, engineering specialties such as materials, bio-chemicals, nanotech and robotics, regulatory and government relations specialists, geospatial information systems experts and commercial and industrial designers. A particular need is also seen in industries as varied as Energy and Media, Entertainment and Information for a new type of senior manager who will successfully steer companies through the upcoming change and disruption. Once more, there is a gender gap dimension to these findings, as the growth of new and emerging roles in computer, technology and engineering-related fields is outpacing the rate at which women are currently entering those types of jobs—putting them at risk of missing out on tomorrow’s best job opportunities and aggravating hiring processes for companies due to a more restricted talent pool. We also asked respondents to identify roles where there may be consistent decline. Across a wide range of sectors including Basic and Infrastructure, Energy, Financial Services & Investors, Information and Communication Technology as well as Professional Services, Office and Administrative functions are poised for major redundancies. One particular set of jobs affected by this, for example, are customer service roles, which will become obsolete due to mobile internet technology to monitor service quality online as a means of maintaining effective customer relationship management. Changes in Job Quality and Ease of Recruitment In addition to the quantity of jobs, disruptive changes to industries and business models will also affect the quality, skills requirements and day-to-day content of virtually every job. Overall, our respondents expect a relative increase in compensation for in-demand jobs in every industry surveyed, in line with increased productivity and skills requirements. They also expect an overall increase in work-life balance in all industries except the Consumer sector, where the outlook for this dimension remains stable.
Expectations are less clear with regard to overall job security, which is expected to increase in the Energy, Financial Services, Healthcare and Information and Communication Technology sectors, but to decrease in the Basic and Infrastructure, Consumer, Media, Entertainment and Information, Mobility and Professional Services industries. It is important to note that these are aggregate results for entire industries. For example, Energy includes renewables and utilities in addition to oil and gas.
See Part 2 for further details in the Industry Profiles. An additional dimension to consider is the general trend towards flexible work, identified by our respondents as one of the biggest drivers of transformation of business models in many industries and therefore also one of the topmost concerns at the national level in many of the Report’s focus countries. Telecommuting, co-working spaces, virtual teams, freelancing and online talent platforms are all on the rise, transcending the physical boundaries of the office or factory floor and redefining the boundary between one’s job and private life in the process. Modern forms of workers’ organization, such as digital freelancers’ unions, and updated labour market regulations are beginning to emerge to complement these new organizational models.
The challenge for employers, individuals and governments alike is going to be to work out ways and means to ensure that the changing nature of work benefits everyone. Given the overall disruption industries are experiencing, it is not surprising that, with current trends, competition for talent in in-demand job families such as Computer and Mathematical and Architecture and Engineering and other strategic and specialist roles will be fierce, and finding efficient ways of securing a solid talent pipeline a priority for virtually every industry. Most strategic and specialist roles across industries, countries and job families are already perceived as hard to recruit for currently and—with few exceptions—the situation is expected to worsen significantly over the 20152020 period, notably in the Consumer, Information and Communication Technology, Basic and Infrastructure and Media, Entertainment and Information industries (Figure 7). Across key job families, recruitment is currently perceived as most difficult for traditional middle-skilled and skilled trade occupations, such as in Installation and Maintenance, as well as for Architecture and Engineering and Computer and Mathematical roles. By 2020 our respondents expect that it will be significantly more difficult to recruit specialists across most job families, particularly so for Computer and Mathematical roles, given the war for talent that is already shaping up in this field today. Interestingly, Office and Administrative roles will be among the hardest jobs to recruit for in absolute terms by 2020, presumably partly due to the perceived unattractiveness of the field, if current employment projections come to pass, and the very different core skills requirements this field may have going forward. By contrast, recruitment for standard white collar Business and Financial Operations roles is currently perceived as comparatively easy, and the talent pipeline is expected to marginally improve even further in the future. There are significant variations in perceived ease of recruitment by geography, although finding specialists is expected to become more difficult across all selected economies over the 2015–2020 period.
The situation will be particularly difficult in Japan, exacerbated by the country’s ageing demographics. Our respondents also note that whereas it is often harder to recruit women than men for many specialist roles, particularly for jobs concentrated in the Computer and Mathematical and Architecture and Engineering job families, this trend is expected to improve somewhat over the 2015–2020 period. The largest progress in overcoming this The Future of Jobs Report | 17 . Figure 7: Expected change in ease of recruitment, 2015–2020 Perception rating on a –2 (“very hard”) to +2 (“very easy”) scale INDUSTRIES 1.0 Average ease of recruitment 0.5 0.0 -0.5 –1.0 –0.5 –0.34 –0.14 –0.55 –0.49 –0.54 –0.63 –0.42 –1.5 –0.53 –2.0 Basic and Infrastructure Consumer Energy Financial Services & Investors Healthcare Information and Media, Communication Entertainment Technology and Information Mobility Professional Services JOB FAMILIES 1.0 0.5 Average ease of recruitment 0.02 0.0 –0.5 –0.67 –1.0 –0.44 –0.29 –0.70 –1.5 –0.34 –0.43 –0.58 –0.20 –1.00 –0.20 –2.0 Architecture Arts, Design, Business Computer Construction Installation and Entertainment, and and and and Engineering Sports Financial Mathematical Extraction Maintenance and Media Operations Manage- Manufacturing Life, Ofï¬ce Sales and ment and Physical, and Related Production and Administrative Social Sciences COUNTRY/REGION 1.0 0.5 Average ease of recruitment n/a 0.04 0.0 –0.5 –1.0 –0.44 –0.41 –0.62 –0.06 –0.50 –0.39 –0.65 –0.71 –0.21 –0.67 –0.13 –1.5 –0.50 –2.0 –0.85 ASEAN Australia Brazil China Source: Future of Jobs Survey, World Economic Forum. 18 | The Future of Jobs Report France GCC Germany India Italy Japan Mexico South Africa Turkey United United Kingdom States . Figure 8A: Drivers of change, time to impact on business models Share of respondents, % DEMOGRAPHIC AND SOCIO-ECONOMIC Changing nature of work, flexible work Middle class in emerging markets Climate change, natural resources Geopolitical volatility Consumer ethics, privacy issues Longevity, ageing societies n Impact felt already n 2015–2017 n 2018–2020 n 2021–2025 Young demographics in emerging markets Women’s economic power, aspirations Rapid urbanization 0 10 20 30 40 50 TECHNOLOGICAL Mobile internet, cloud technology Processing power, Big Data New energy supplies and technologies Internet of Things Sharing economy, crowdsourcing Robotics, autonomous transport n Impact felt already n 2015–2017 n 2018–2020 n 2021–2025 Artificial intelligence Adv. manufacturing, 3D printing Adv. materials, biotechnology 0 10 20 30 40 50 Source: Future of Jobs Survey, World Economic Forum. Note: Names of drivers have been abbreviated to ensure legibility. gender penalty for specialist recruitment is expected in the Basic and Infrastructure, Mobility and Media, Entertainment and Information industries, though it is expected to persist, for example, in the Information and Communication Technology sector. For more details on this gender gap dimension and its implications please refer to Chapter 2. SKILLS STABILITY The accelerating pace of technological, demographic and socio-economic disruption is transforming industries and business models, changing the skills that employers need and shortening the shelf-life of employees’ existing skill sets in the process.
For example, technological disruptions such as robotics and machine learning—rather than completely replacing existing occupations and job categories—are likely to substitute specific tasks previously carried out as part of these jobs, freeing workers up to focus on new tasks and leading to rapidly changing core skill sets in these occupations.11 Even those jobs that are less directly affected by technological change and have a largely stable employment outlook—say, marketing or supply chain professionals targeting a new demographic in an emerging market—may require very different skill sets just a few years from now as the ecosystems within which they operate change. In this new environment, business model change often translates to skill set disruption almost simultaneously and with only a minimal time lag (Figure 8A). Our respondents report that a tangible impact of many of these disruptions on the adequacy of employees’ existing skill sets can already be felt in a wide range of jobs and industries today (Figure 8B). The Future of Jobs Report | 19 . Figure 8B: Drivers of change, time to impact on employee skills Share of respondents, % DEMOGRAPHIC AND SOCIO-ECONOMIC Changing nature of work, flexible work Middle class in emerging markets Climate change, natural resources Geopolitical volatility Consumer ethics, privacy issues Longevity, ageing societies n Impact felt already n 2015–2017 n 2018–2020 n 2021–2025 Young demographics in emerging markets Women’s economic power, aspirations Rapid urbanization 0 10 20 30 40 50 TECHNOLOGICAL Mobile internet, cloud technology Processing power, Big Data New energy supplies and technologies Internet of Things Sharing economy, crowdsourcing Robotics, autonomous transport 0 10 20 30 n Impact felt already n 2015–2017 n 2018–2020 n 2021–2025 40 50 0 0 10 10 20 20 30 30 40 40 Artificial intelligence Adv. manufacturing, 3D printing Adv. materials, biotechnology Source: Future of Jobs Survey, World Economic Forum. Note: Names of drivers have been abbreviated to ensure legibility. Impact of Disruptive Change on Existing Skill Sets During previous industrial revolutions, it has often taken decades to build the training systems and labour market institutions needed to develop major new skill sets on a large scale. Given the upcoming pace and scale of disruption brought about by the Fourth Industrial Revolution, however, this may simply not be an option.12 For example, current technological trends are bringing about an unprecedented rate of change in the core curriculum content of many academic fields, with nearly 50% of subject knowledge acquired during the first year of a four-year technical degree outdated by the time students graduate, according to one popular estimate.13 A focus on the state of the talent pipeline for traditional formal qualifications and hard skills therefore risks dramatically understating the scale of impending skill set disruption if a 20 | The Future of Jobs Report 50 50 large part of the existing subject knowledge of the current workforce will be outdated in just a few years. Beyond hard skills and formal qualifications, employers are often equally concerned about the work-related practical skills or competences that current employees (or prospective new hires) are able to use in order to perform various job tasks successfully.14 Focusing on a core set of 35 workrelevant skills and abilities that are widely used across all industry sectors and job families (see Figure 9)—derived from the same classification as our occupation-level data15—the Report finds that these practical skills, too, will be subject to accelerating change and significant disruption in the immediate future.
On average, by 2020, more than a third of the desired core skill sets of most occupations will be comprised of skills that are not yet considered crucial to the job today, according to our respondents. At an industry . Figure 9: Core work-related skills Abilities Cross-functional Skills Basic Skills Cognitive Abilities Content Skills Social Skills »» Cognitive Flexibility »» Creativity »» Logical Reasoning »» Problem Sensitivity »» Mathematical Reasoning »» Visualization »» Active Learning »» Oral Expression »» Reading Comprehension »» Written Expression »» ICT Literacy »» Coordinating with Others »» Emotional Intelligence »» Negotiation »» Persuasion »» Service Orientation »» Training and Teaching Others Physical Abilities Process Skills »» Physical Strength »» Manual Dexterity and Precision »» Active Listening »» Critical Thinking »» Monitoring Self and Others Systems Skills »» Judgement and Decision-making »» Systems Analysis Complex Problem Solving Skills »» Complex Problem Solving Resource Management Skills »» Management of Financial Resources »» Management of Material Resources »» People Management »» Time Management Technical Skills »» Equipment Maintenance and Repair »» Equipment Operation and Control »» Programming »» Quality Control »» Technology and User Experience Design »» Troubleshooting Source: World Economic Forum, based on O*NET Content Model. Note: See Appendix A for further details. level, the highest expected level of skills stability over the 2015–2020 period is found in the Media, Entertainment and Information sector, already profoundly transformed in recent years, while the largest amount of skills disruption is expected to occur in the Financial Services & Investors industry.16 There are various reasons for such dramatic shifts in expected skills requirements. As noted earlier, in the face of rapidly rising computing power, an ability to work with data and make data-based decisions will become an increasingly vital skill across many job families as employers scramble to build a workforce with solid skills in data analysis and presentation (e.g. through visualization) and the amount of potentially useful digital information generated and stored keeps increasing exponentially. In the Consumer sector, for example, vast amounts of data will allow for increased sophistication in inventory management, customer segmentation and product personalization, involving some use and familiarity with technology by jobs at all levels, from retail assistant through to more senior positions. Businesses in industry sectors such as Mobility, Energy, Financial Services & Investors and Information and Communication Technology are increasingly finding themselves confronted with new consumer concerns about issues such as carbon footprints, food safety, labour standards and privacy.
From a skills perspective, they will need to learn to more quickly anticipate these new consumer values, to translate them into product offerings and to become ever more knowledgeable about the processes involved in meeting these demands and the Table 6: Skills Stability, 2015–2020, industries overall Industry group Unstable Stable Industries Overall 35% 65% Media, Entertainment and Information 27% 73% Consumer 30% 71% Healthcare 29% 71% Energy 30% 70% Professional Services 33% 67% Information and Communication Technology 35% 65% Mobility 39% 61% Basic and Infrastructure 42% 58% Financial Services & Investors 43% 57% Source: Future of Jobs Survey, World Economic Forum. impact this may have on their employees’ current skill sets and working practices. While most jobs require use of a wide range of skills, somewhat different skill set combinations are sought after in different industry sectors. Our dataset allows us some generalized observations about the impact of various disruptive changes on skills demand at an aggregate industry level (see Table 7). With regard to the overall scale of demand for various skills in 2020, more than one third (36%) of all jobs across all industries are expected by our respondents to require complex problem-solving as one of their core skills, compared to less than 1 in 20 jobs (4%) that will have a core The Future of Jobs Report | 21 . Table 7: Demand for skills in different industry sectors and overall, 2015 and 2020 Share of jobs requiring skills family as part of their core skill set, % 2020 Current 2020 Current 2020 Current 2020 Current 2020 Current 2020 OVERALL Current PS 2020 MOB Current MEI 2020 ICT Current HE 2020 FS Current EN 2020 CON Current BAS Complex Problem Solving Skills 42 33 28 31 49 38 35 39 35 36 36 46 — — 32 34 35 38 36 36 Social Skills 17 17 26 27 27 28 32 23 30 28 20 19 27 32 22 20 26 24 20 19 Process Skills 10 19 21 22 24 29 36 34 25 36 26 25 27 31 18 22 37 29 18 18 Systems Skills 22 26 28 25 24 18 23 22 — — 26 24 — — 16 23 16 16 16 17 Resource Management Skills 21 15 38 35 29 24 20 20 — — 16 19 38 32 26 28 24 29 14 13 Technical Skills 25 20 20 18 29 22 5 16 — — 22 20 — — 26 21 19 18 14 12 Cognitive Abilities 10 19 13 25 — — 15 23 35 34 20 23 — — 11 27 19 22 11 15 Content Skills 6 13 — — — — 22 24 — — 19 18 — — 22 28 11 15 10 10 Physical Abilities — — — — — — — — — — — — — — — — — — 5 4 Skills family Source: Future of Jobs Survey, World Economic Forum. Figure 10: Change in demand for core work-related skills, 2015-2020, all industries Share of jobs requiring skills family as part of their core skill set, % Scale of skills demand in 2020 Current 2020 Cognitive Abilities 15% 52% Systems Skills 17% 42% Complex Problem Solving 36% 40% Content Skills 10% 40% Process Skills 18% 39% Social Skills 19% 37% Resource Management Skills 13% 36% Technical Skills 12% 33% 4% 31% Physical Abilities 0 20 n growing skills demand 40 60 n stable skills demand 80 100 n declining skills demand Source: Future of Jobs Survey, World Economic Forum. requirement for physical abilities such as physical strength or dexterity. However, along with the impact of disruptive changes on these sectors, it is anticipated that complex problem solving skills will become somewhat less important in industries that are heavily technical today—such as Basic and Infrastructure and Energy—in which technology may automate and take on a bigger part of these complex tasks going forward, and will ascend in those industries, such as 0 22 | The Future of Jobs Report Professional Services and Information and Communication Technology, that are expected to become more complex and analytical due to these trends. Overall, social skills—such as persuasion, emotional intelligence and teaching others—will be in higher demand across industries than narrow technical skills, such as programming or equipment operation and control. Content skills (which include ICT literacy and active learning), 20 40 60 80 100 . Table 8A: Distribution of recent university graduates by degree subject and country Share of degree holders, % ASEAN AUS BRA FRA GCC DEU ITA JPN MEX TUR UK USA Agriculture 4 1 2 1 0 2 2 3 2 3 1 1 Education 16 8 20 3 8 9 7 7 12 10 10 10 Engineering, Manufacturing, Construction 19 8 7 15 16 15 13 17 21 12 9 7 Health and Welfare 9 17 15 15 6 19 16 13 9 6 16 17 Humanities and Arts 6 10 2 10 18 16 15 15 4 8 16 12 Sciences 5 8 5 10 13 13 7 3 6 9 13 9 Services 5 3 3 4 2 3 3 8 1 5 2 8 Social Sciences, Business, Law 32 45 41 42 36 23 32 27 45 47 32 36 Unspecified 4 0 5 0 0 0 5 7 0 0 1 0 Source: World Economic Forum, Human Capital Report 2015, based on UNESCO Institute of Statistics, ISCED 2011. Note: Most recent year available; data not available for China, India, South Africa. Table 8B: Distribution of professionals by degree subject and industry Share of degree holders, % BAS CON EN FS HE ICT MEI MOB PS Agriculture v 2 0 0 2 0 0 0 0 Education 1 4 1 2 5 1 18 2 1 Engineering, Manufacturing, Construction 47 3 51 2 3 25 4 27 3 Health and Welfare 2 5 1 3 29 1 6 2 5 Humanities and Arts 3 17 1 5 5 4 39 3 11 Sciences 16 9 15 11 31 50 11 11 11 Services 0 4 0 1 4 0 1 10 0 Social Sciences, Business, Law 29 50 29 74 18 18 19 39 67 Unspecified 2 5 2 2 2 2 2 4 1 Source: LinkedIn. Note: Share of LinkedIn members with stated tertiary degrees across Future of Jobs Report focus countries; industry classification based on World Economic Forum taxonomy, education subject classification based on ISCED 2011. cognitive abilities (such as creativity and mathematical reasoning) and process skills (such as active listening and critical thinking) will be a growing part of the core skills requirements for many industries. If skills demand is evolving rapidly at an aggregate industry level, the degree of changing skills requirements within individual job families and occupations is even more pronounced (Figure 10). For example, the increasing ubiquity of mobile internet combined with the coming-of-age of the Internet of Things promises to transform the daily routine of many frontline roles in the Sales and Related, Installation and Maintenance, and Manufacturing and Production job families across all industries, requiring a much higher level of technology literacy than in the past. As an ancillary characteristic to increased automation in these fields, employees are The Future of Jobs Report | 23 . Box 1: Anticipating the Future of Jobs: Mapping Skills Supply Job requirements and skills profiles are rapidly changing. Yet when it comes to the traditional tools policymakers and employers have at their disposal to navigate this change there often is a time lag of months, if not years, until updated information becomes available. Growing computing power and large amounts of data are increasingly making it possible to understand and anticipate changes in labour markets in near-real time, and to re-shape education and training policies in a timelier manner to help narrow the widening skills gap. For example, hundreds of millions of workers across the globe have added their professional information—including their education, skills, and past and present jobs—to online talent platforms such as LinkedIn, affording these providers with unique insights into changing skills supply. Increased collaboration between stakeholders such as online talent platforms, human resources consulting firms, employers, policymakers, labour unions and education providers, has the potential to substantially improve the speed and precision of future workforce planning and managing organizational change. In order to map labour market changes, LinkedIn’s analytics describe each job function as an agglomeration of skills, enabling the platform to nowcast changes in the skills landscape as members update their professional information. This enables the platform to identify clusters of skills that are particularly associated with the profiles of members with common job functions and titles and to map how these change over time. It also allows for identifying nuances and differences between the skill sets of common job functions in different industries or geographies. For example, the heatmap below shows how the most common skills reported by mechanical engineers vary across different industries.
The dark blue color in area 1 in the chart below shows that mechanical engineers working in various sectors of the Mobility industry have similar skills. It also shows that their skills differ from the skills of mechanical engineers who work in the Healthcare industry (area 2) or the Energy and Basic and Infrastructure sectors (areas 3 and 4). expected to have more responsibilities related to equipment control and maintenance and problem-solving skills, as well as a broader general understanding of the work processes of their company or organization. Many formerly purely technical occupations are expected to show a new demand for creative and interpersonal skills. For healthcare practitioners, for example, technological innovations will allow for increasing automation of diagnosis and personalization of treatments, redefining many medical roles towards translating and communicating this data effectively to patients.
Similarly, Sales and Related jobs may see an increased demand for creative skills and ideas for promoting a memorable shopping experience, as brick-and-mortar retail has to reposition itself in relation to e-commerce and online competition. Overall, our respondents anticipate that a wide range of occupations will require a higher degree of cognitive abilities—such as creativity, logical reasoning and problem 24 | The Future of Jobs Report By tracking skills that were recently added to members’ profiles as a percentage of those who already reported that skill, it becomes possible to identify skills whose supply is on the rise in particular industries or geographies. This supply-side analysis can be complemented with analysis of skills demand—whether based on job listings, within-job hiring rates, governmental forecasts, or employer surveys such as the one presented in this Report—to identify emerging skills gaps and inform training and skills programmes to prepare the workforce for future requirements. At the national level, countries experience varying inflows and outflows of talent over time. Outflows and inflows of talent often do not have the same skills compositions, resulting in a correlation between talent mobility and changing skills gaps across countries and over time. The Country and Regional Profiles in Part 2 of the Report highlight the current and expected share of strategic and specialist job functions anticipated by respondents from the corresponding industry to be recruited locally in the country.
A very low local recruitment share may indicate skills shortages and a very high reliance on expatriate talent. A very high local recruitment share might indicate underutilized opportunities to diversify experience and increase knowledge transfer to the local workforce from internationally mobile experts. On the supply side, by tracking members’ profile changes with regard to their home geography, the LinkedIn platform can track the rate at which countries are losing or gaining particular in-demand skills.1 Data on both demand and supply is critical for informed decision making on talent mobility policies. Notes 1 State, B., M.
Rodriguez, et. al., “Migration of Professionals to the US: Evidence From LinkedIn Data”, Social Informatics, pp. 531–543, 2014. sensitivity—as part of their core skill set.
More than half (52%, the bright blue part of the bar in Figure 10) of all jobs expected to require these cognitive abilities as part of their core skill set in 2020 do not yet do so today, or only to a much smaller extent. In another 30% of jobs (the dark blue part of the bar in Figure 10), demand for these skills is currently already high and will remain so over the 2015– 2020 period. Only 18% of jobs requiring high cognitive skills today are expected to do so less in the future (the grey part of the bar in Figure 10). At the other end of the scale, among all jobs requiring physical abilities less than one third (31%) are expected to have a growing demand for these in the future, about as many as the proportion of jobs in which physical abilities are anticipated to decline in importance (27%).
The skills family with the most stable demand across all jobs requiring these skills today or in the future are technical skills: nearly half (44%) of all jobs requiring these skills today will have a stable need for them in the coming years. . Box 1: Anticipating the Future of Jobs: Mapping Skills Supply (cont’d.) Heatmap: Distribution of skills, mechanical engineers, different industries 4 3 2 Highly relevant skill Defense and Space Aviation and Aerospace Medical Device Manufacturing Electronics Automotive Machinery Industrial Automation Industrial Engineering Design Construction Civil Engineering Utilities Mining and Metals Chemicals Oil and Energy 1 Engineering Design EPC Inspection Piping Pumps Commissioning Project Engineering CAD AutoCAD HVAC MEP Machining Solidworks Sheet Metal Design for Manufacturing Product Design R&D FMEA Manufacturing Engineering Management Simulations Systems Engineering LabVIEW GD&T PTC CREO CATIA Finite Element Analysis ANSYS MATLAB Less relevant skill Source: LinkedIn. Understanding Current Skills Supply Today’s job markets and in-demand skills are vastly different than the ones of 10 or even five years ago, and—as demonstrated in this Report—the pace of change is only set to accelerate. Governments, businesses and individuals alike are increasingly concerned with identifying and forecasting skills that are relevant not just today but that will remain or become so in the future to meet business demands for talent and enable those that possess them to seize emerging opportunities. In light of technological trends such as the ones outlined in this Report, in recent years many countries have undertaken significant efforts to increase the amount of STEM (science, technology, engineering and mathematics) graduates produced by their national education systems (Table 8A). While the employment trends identified by this Report certainly corroborate the importance of these efforts, it is nevertheless also clear that the potential net job creation in absolute terms in the STEM field alone will not be sufficient to absorb strains on other parts of the labour market. What we have found instead is that disruptive changes will have a significant impact on skills requirements in all job families and that they are creating a range of opportunities and challenges in all industries, not just narrowly related to ‘hard knowledge’, technical skills and technology.
In order to manage these trends successfully, there is a need for potentially reskilling and upskilling talent from varied academic backgrounds in all industries (Table 8B). This Report has focused on shifts and disruptions to skills requirements as perceived by CHROs. It is clear that even if today’s skills base would conform exactly to today’s perceived skills requirements, the looming skills instability challenge would be substantial. In practice, however, there are already today large mismatches between the actual supply and demand of key work-related skills (Table 8C), with 38% of employers reporting difficulties in in filling jobs The Future of Jobs Report | 25 .
Table 8C: Distribution of skills supply, by industry Share of skills family in industry total, % Skills family BAS CON EN FS HE ICT MEI MOB PS OVERALL Content Skills 4 4 3 5 11 3 14 3 8 6 Process Skills 6 4 7 6 11 3 9 3 11 7 Resource Management Skills 23 26 31 27 18 25 8 27 18 23 Complex Problem Solving Skills 8 5 7 6 7 4 3 5 5 6 Social Skills 40 55 33 47 47 30 50 47 48 44 Systems Skills 4 4 6 7 3 6 1 3 5 4 Technical Skills 15 2 13 2 3 29 15 12 5 11 Source: LinkedIn. Note: Based on share of LinkedIn members with stated skills across Future of Jobs Report focus countries. LinkedIn currently has more than 400 million members in more than 200 countries and territories. Industry classification based on World Economic Forum taxonomy. in 2015, according to ManpowerGroup’s most recent Talent Shortage Survey.17 Skills mismatches may therefore emerge not just between the supply and demand of existing skills today, but also between today’s skills base and future skills requirements. Efforts aimed at closing the skills gap will increasingly need to be grounded in a solid understanding of a country’s or industry’s skills base today and of changing future skills requirements due to disruptive change. For example, efforts to place unemployed youth in apprenticeships in certain job categories through targeted skills training may be selfdefeating if skills requirements in that job category are likely to be drastically different in just a few years’ time.
Indeed, in some cases such efforts may be more successful if they disregard current labour market demands and past trends and instead base their models on future expectations. Across industries, geographies and job families, an ability to understand the current skills base in near-real time and to accurately forecast, anticipate and prepare for future job contents and skills requirements will be increasingly critical for businesses, labour market policymakers, workers’ organizations and individuals to succeed. Drivers of change to job markets such as Big Data analytics may themselves become useful tools in managing this process. FUTURE WORKFORCE STRATEGY The impact of technological, demographic and socioeconomic disruptions on business models will be felt in transformations to the employment landscape and skills requirements, resulting in substantial challenges for recruiting, training and managing talent. Several industries may find themselves in a scenario of positive employment demand for hard-to-recruit specialist occupations with simultaneous skills instability across many existing roles.
For example, the Mobility industries expect employment growth accompanied by a situation where nearly 40% of the skills required by key jobs in the industry are not yet part of the core skill set of these functions today. 26 | The Future of Jobs Report At the same time, workers in lower skilled roles, particularly in the Office and Administrative and Manufacturing and Production job families, may find themselves caught up in a vicious cycle where low skills stability means they could face redundancy without significant re- and upskilling even while disruptive change may erode employers’ incentives and the business case for investing in such reskilling. Not anticipating and addressing such issues in a timely manner over the coming years may come at an enormous economic and social cost for businesses, individuals and economies and societies as a whole. Recognition of Reskilling and Retraining as a Priority Responses to the Future of Jobs Survey indicate that business leaders are aware of these looming challenges but have been slow to act decisively. Just over two thirds of our respondents believe that future workforce planning and change management features as a reasonably high or very high priority on the agenda of their company’s or organization’s senior leadership, ranging from just over half in the Basic and Infrastructure sector to four out of five respondents in Energy and Healthcare.
Across all industries, about two thirds of our respondents also report intentions to invest in the reskilling of current employees as part of their change management and future workforce planning efforts, making it by far the highest-ranked such strategy overall (Figure 13). However, companies that report recognizing future workforce planning as a priority are nearly 50% more likely to plan to invest in reskilling than companies who do not (61% against 39% of respondents). Respondents’ expectations about future skills requirements also provide a relatively clear indication of where such retraining efforts might be concentrated in the most effective and efficient way. The Report categorizes work-relevant skills into abilities, basic skills and crossfunctional skills (Figure 9), with particularly strong demand growth expected in certain cross-functional skills, cognitive abilities and basic skills such as active learning and ICT .
Figure 11: Employment outlook and skills stability, by industry Negative outlook, skills stable 100 Positive outlook, skills stable 90 80 Energy Skills stability 2015-2020, % Healthcare AVERAGE Media, Entertainment and Information Consumer Professional Services 70 60 Mobility Basic and Infrastructure Information and Communication Technology Financial Services & Investors 50 40 30 20 Negative outlook, skills disrupted –1.0 –0.5 Positive outlook, skills disrupted 10 0 0.0 0.5 1.0 1.5 2.0 2.5 3.0 Expected change in employment, 2015-2020, % Source: Future of Jobs Survey, World Economic Forum. literacy. Applying a time lens to the potential for acquisition of these skills (what ManpowerGroup refers to as a teachable fit18), it seems clear that targeted training in crossfunctional skills is within the remit of an individual company or even a group of companies coming together for synergy and greater efficiency. By contrast, cognitive abilities take much longer to develop and touch upon the need for high quality and inclusive secondary, primary and pre-school education. This is a field in which government policy will be required and companies can work with governments to clearly define the need and introduce new delivery models.
Finally, basic skills are also traditionally acquired during formal education and before entering the workforce, but are relatively straightforward to acquire compared to cognitive abilities. This is a field in which companies have an opportunity to take a proactive approach to building their talent pipelines by working much more directly with education providers. In addition to such efforts by individual companies there are also opportunities for redeploying skills across industry boundaries from declining to growing parts of the labour market. For example, our respondents expect a decline in Sales and Related jobs and their accompanying skill sets in the Financial Services & Investors, Professional Services and Mobility industries, but a solid growth in demand for these skill sets in the Basic and Infrastructure, Information and Communication Technology and Media, Entertainment and Information industries.
There may be opportunities for greater formalized inter-industry collaboration in facilitating the transfer of these skills and enabling the receiving industries to acquire experienced talent from industries that have declining demand for those same skills. Our research also points to similar opportunities for redeploying talent and skills in the Installation and Maintenance job family, from the Information and Communication Technology sector towards the Energy and Mobility industries, and Legal jobs, from the Professional Services industry towards the Financial Services & Investors and Basic and Infrastructure sectors. Such an approach not only makes recruiting easier for the hiring industry but also preserves employment opportunities for individuals whose skills may be falling out of favour in another sector of the economy, creating a win-win scenario for both employer and employee. More broadly still, there is a wide range of currently underutilized opportunities for building multistakeholder partnerships for better matching skills and labour market needs.19 Barriers to Managing Change Reskilling and retraining efforts may not yield the desired return if they are not cognizant of impending disruptive change and instead base their content primarily on today’s requirements or past successes.
Many of our respondents are acutely aware of the limitations to their current planning for disruptive change and its implications for the talent landscape. Currently, only 53% of CHROs surveyed are reasonably or highly confident regarding the adequacy of their organization’s future workforce strategy to prepare for these shifts. The main perceived barriers to a more decisive approach include a lack of understanding of the disruptive changes ahead, resource constraints and short-term profitability pressures and lack of alignment between workforce strategies and firms’ innovation strategies (Figure 12). However, there are some significant differences between industries in this regard.
The Information and Communication Technology sector reports a comparatively good understanding of drivers of change and instead sees resource constraints as its main barrier whereas the Media, Entertainment and Information industry—perhaps the sector that has seen the largest scale of disruption of its traditional business model to date—reports a very good understanding of the nature of disruptive changes ahead and is instead mainly concerned about short-term shareholder pressures (Table 9). Furthermore, we find that CHROs’ confidence in the adequacy of their company’s or organization’s workforce The Future of Jobs Report | 27 . Figure 12: Significance of barriers to change, industries overall Share of respondents reporting barrier, % Insufficient understanding of disruptive changes 51% Resource constraints 50% Pressure from shareholders, short-term profitability 42% Workforce strategy not aligned to innovation strategy 37% Insufficient priority by top management 21% Don’t know 18% Insufficient priority by line management 18% No barriers 8% Source: Future of Jobs Survey, World Economic Forum. Note: Names of barriers have been abbreviated to ensure legibility. strategy is strongly correlated with the perceived priority given to these issues by top management and with perceived alignment between workforce strategy and innovation strategy. Conversely, CHROs who do not see these two measures in place are over 50% more likely not to express confidence in their firm’s strategy. However, the prevalence of insufficient understanding of disruptive changes as well as resource constraints as main barriers to managing change perhaps helps to explain the current mismatch between the magnitude of the upcoming changes and the relatively timid actions being taken by companies to address these challenges so far. For example, a number of promising approaches appear underutilized across almost all industries. Despite widespread proclamations in support of workplace gender parity, only one in four companies envisages actively targeting female talent, ranging from 46% in the Media, Entertainment and Information sector to only 16% in Information and Communication Technology. There also 0.3 0.4 0.5 seems to 0.2 varying openness to collaboration, whether be within or across industries, with the latter seemingly much more acceptable.
Furthermore, a focus on making better use of the accumulated experience of older employees Envisaged Workforce Strategies In order to meet the talent and skills challenges brought about by expected business model disruptions, companies envisage pursuing a range of innovative workforce strategies; providing employees with wider exposure to roles across the firm, stepping up efforts to target the female 0.0 talent pool and collaborating with the education sector 0.1 more closely than in the past are some of the more popular measures (Figure 13). Across all industries, plans to invest in reskilling current employees feature prominently among reported future workforce strategies. Table 9: Significance of barriers to change, by industry Share of respondents reporting barrier, % BAS CON EN FS HE ICT MEI MOB PS OVERALL Insufficient understanding of disruptive changes 59 60 55 67 50 48 36 58 51 51 Resource constraints 54 55 55 43 75 74 36 50 49 50 Pressure from shareholders, short-term profitability 51 50 41 47 50 42 64 38 35 42 Workforce strategy not aligned to innovation strategy 38 50 32 53 50 39 50 17 37 37 Insufficient priority by top management 27 20 18 27 25 23 7 21 23 21 Don’t know 16 10 36 23 50 6 14 17 19 18 Insufficient priority by line management 30 0 9 27 0 16 21 33 16 18 No barriers 5 15 14 7 8 3 7 13 7 8 Barrier Source: Future of Jobs Survey, World Economic Forum. Note: Names of barriers have been abbreviated to ensure legibility. 28 | The Future of Jobs Report 0.6 . Figure 13: Future workforce strategies, industries overall Share of respondents pursuing strategy, % Invest in reskilling current employees 65% Support mobility and job rotation 39% Collaborate, educational institutions 25% Target female talent 25% Attract foreign talent 22% Offer apprenticeships 22% Collaborate, other companies across industries 14% Collaborate, other companies in industry 12% Target minorities’ talent 12% Hire more short-term workers 11% Source: Future of Jobs Survey, World Economic Forum. Note: Names of strategies have been abbreviated to ensure legibility. and building an ageless workforce barely register among They require a new mindset to meet their talent needs and proposed workforce strategies. to optimize social outcomes. This entails several major In fact, these findings are in striking contrast with the changes in how business views and manages talent, both envisaged measures of respondents who report both that immediately and in the longer term. In particular, there are they are confident in the adequacy of their future workforce four areas with short term implications and three that are strategy and that these issues are perceived as a priority for critical for long term resilience. their top management. This group is more than twice as likely to be targeting female talent and minority talent and over Immediate Focus 0.0 0.1 0.2 • 0.3 0.4 0.5 0.6 0.7 50% more likely to be supporting employees’ mobility and Reinventing the HR Function: As business leaders job rotation within the firm.
They are significantly less likely begin to consider proactive adaptation to a new talent to plan to hire more short-term workers or to use expatriate landscape, they need to manage skills disruption as talent, in line with their equally much higher probability to an urgent concern. They must understand that talent invest in internal talent and reskilling, as already noted above. is no longer a long-term issue that can be solved with There is a need in several of these areas for bolder leadership tried and tested approaches that were successful in the and strategic action within companies and within and across past or by instantly replacing existing workers. Instead, industries, including partnerships with public institutions and as the rate of skills change accelerates across both old the education sector. and new roles in all industries, proactive and innovative skill-building and talent management is an urgent issue. Recommendations for Action What this requires is an HR function that is rapidly While the implications of accelerating disruptive change becoming more strategic and has a seat at the table— to business models are far-reaching—even daunting— for one that employs new kinds of analytical tools to spot employment and skills, rapid adjustment to the new reality talent trends and skills gaps, and provides insights that and the opportunities it offers is possible, provided there can help organizations align their business, innovation is concerted effort by all stakeholders.
For government, it and talent management strategies to maximize will entail innovating within education and labour-related available opportunities to capitalize on transformational policymaking, requiring a skills evolution of its own. For trends. the education and training sector, it will mean vast new business opportunities as it provides new services to • Making Use of Data Analytics: Businesses will need individuals, entrepreneurs, large corporations and the public to build a new approach to workforce planning and sector. The sector may become a noteworthy new source of talent management, where better forecasting data employment itself. and planning metrics will need to be central.
Earlier For businesses to capitalize on new opportunities, they mapping of emerging job categories, anticipated will need to put talent development and future workforce redundancies and changing skills requirements in strategy front and centre to their growth. Firms can no response to the changing environment will allow longer be passive consumers of ready-made human capital. businesses to form effective talent repurposing The Future of Jobs Report | 29 0.8 . Table 10: Significance of workforce strategies, by industry Share of respondents pursuing strategy, % BAS CON EN FS HE ICT MEI MOB PS OVERALL Invest in reskilling current employees 65 75 59 67 83 81 77 83 56 65 Support mobility and job rotation 41 45 50 47 50 35 15 54 40 39 Collaborate, educational institutions 38 30 23 20 25 35 38 29 14 25 Target female talent 35 25 36 30 17 16 46 21 21 25 Attract foreign talent 35 25 41 23 42 19 15 25 7 22 Offer apprenticeships 14 35 23 20 8 23 31 29 33 22 Collaborate, other companies across industries 11 20 14 17 0 10 23 8 28 14 Collaborate, other companies in industry 19 5 18 10 25 10 15 0 14 12 Target minorities' talent 14 5 9 13 33 16 8 13 9 12 Hire more short-term workers 3 20 5 7 0 26 23 17 9 11 Hire more virtual workers 5 5 0 10 0 6 8 0 12 6 Collaborate, vocational training and certification providers 3 5 14 3 0 3 0 13 7 5 Don’t know 0 0 0 17 17 13 15 0 0 5 Invest in older workers 11 5 5 0 0 3 8 0 5 4 Collaborate, private employment agencies 0 0 5 7 8 3 8 0 5 3 There is no strategy 8 0 0 7 0 0 0 0 0 2 Collaborate, labour unions 0 0 0 3 0 3 0 4 0 1 Strategy Source: Future of Jobs Survey, World Economic Forum. Note: Names of strategies have been abbreviated to ensure legibility. strategies within their company, their own industry and across industries. HR has the opportunity to add significant strategic value in predicting the skills that will be needed, and plan for changes in demand and supply. To support such efforts, the Forum’s Future of Jobs project provides in-depth analysis on industries, countries, occupations and skills. • Talent diversity—no more excuses: As study after study demonstrates the business benefits of workforce diversity and companies expect finding talent for many key specialist roles to become much more difficult by 2020, it is time for a fundamental change in how talent diversity issues—whether in the realm of gender, age, ethnicity or sexual orientation—are perceived and well-known barriers tackled. In this area, too, technology and data analytics may become a useful tool for advancing workforce parity, whether by facilitating objective assessment, understanding typical careers paths and cliffs, identifying unconscious biases in job ads and recruitment processes or even by 30 | The Future of Jobs Report using wearable technologies to understand workplace behaviours and encourage systemic change. • Leveraging flexible working arrangements and online talent platforms: As physical and organizational boundaries are becoming increasingly blurred, organizations are going to have to become significantly more agile in the way they think about managing people’s work and about the workforce as a whole. Work is what people do and not where they do it. Businesses will increasingly connect and collaborate remotely with freelancers and independent professionals through digital talent platforms.
Modern forms of association such as digital freelancers’ unions and updated labour market regulations will increasingly begin to emerge to complement these new organizational models. For policymakers, an important set of regulations concerns the portability of safeguards and benefits between jobs and the equivalent treatment in law of different forms of labour and employment types. . Box 2: Anticipating the Future of Jobs: The New Vision for Arab Employment As an integral part of its practical and action-oriented application, the World Economic Forum’s Global Challenge Initiative on Employment, Skills and Human Capital is deploying a number of regionally focused collaboration projects, reflecting on how emerging economies may tackle the challenge of closing skills gaps and providing job opportunities to their fast-growing young population. By tailoring and applying insights and recommendations developed at the global level, these projects support efforts to improve the state of employment, skills and human capital in local and regional contexts. Furthermore, they serve as an invaluable source of bottom-up evidence and learnings that can be elevated and shared to foster crossregional learnings and global adaptation. Currently, the Forum is focusing on three such projects: the New Vision for Arab Employment, described in more detail below, the Africa Skills Initiative and the India Skills Initiative. THE NEW VISION FOR ARAB EMPLOYMENT The New Vision for Arab Employment serves as a platform for driving action and partnerships through nationally and regionally focused projects that promote collaboration and partnership between local and multinational businesses as well as governments and the education and training sector.
Working in close collaboration with key business, public sector and civil society leaders, the initiative rallies key regional actors through calls-to-action and pilots best practices to effect change. It also aims at identifying key cross-cutting areas of intervention that will help address employment, skills and human capital gaps for the 21st century. Phase 1: Understanding the regional context Talent is one of the most critical factors for an economy’s innovative capacity and growth prospects. With more than half of its population under 25 years of age and the world’s highest youth unemployment rate, the Middle East and North Africa (MENA) region faces critical challenges.
Concurrently, business leaders report difficulties in filling roles. In particular, persistently high youth unemployment rates in the Gulf Cooperation Council countries demonstrate that addressing youth unemployment effectively requires more than budgetary capacity and economic growth. Launched in 2013, the aim of the first phase of the initiative was to better understand how to turn this youthful populace into a youth dividend and implement best practices of interventions to inverse the critical trend of youth unemployment. For example, the Forum’s Human Capital Index showed that despite significant investment in education by many countries, the region is not equipping youth with skills for the 21st century.
Out of the 124 economies covered by the Index in 2015, only two from the region—the United Arab Emirates (54) and Qatar (56)—made it into the upper half of the rankings. Kuwait (93) and Saudi Arabia (85), whose GDP per capita is at least fivefold higher, performed at a comparable level to Morocco (95) and Egypt (84), respectively, highlighting that economic performance alone is an inadequate measure of countries’ abilities to successfully leverage their human capital endowment. In addition, it was found that the region runs the risk of worsening unemployment and talent shortages if skills gaps are exacerbated due to technological changes that further disrupt business models and labour markets. Phase 2: Commitments to affect change in the region Recognizing that longer term reform by the public sector must be complemented by the active collaboration of the private sector, the Forum’s Regional Business Council for MENA launched a second phase of the initiative in 2015, aiming to invest in the continuous learning, reskilling, upskilling and job readiness of 100,000 of the region’s youth by 2017.
To date over 10 partners have made specific commitments to address the jobs and skills challenge in the region aimed at reducing unemployment, tackling skills gaps or facilitating talent flows through initiatives implemented directly by each company in collaboration with other stakeholders. Each commitment sets a target to achieve its outcomes against a specific set of metrics within a period of two years and meets the following criteria: • Extends beyond the pledging organization’s internal HR programme • Consists of a new initiative or the additional scaling up of an existing initiative • Contributes to the public good by creating added value for society and economy • Ideally, aligns with the organization’s core business strategy • Is a multistakeholder commitment, led by the partner In addition to a set of founding pledges that impacted nearly 50,000 youth, the initiative has engaged others to join forces in order to reach—or surpass—the goal of 100,000. The pledge model also serves as a platform for continued learning and collaboration between businesses seeking to address the region’s talent value chain and as a hub for exchange with governments, civil society organizations and experts. Phase 3: The Future of Jobs and public-private dialogue Recognizing that current company-specific efforts must be supplemented with systemic change, the leaders of the Forum’s Regional Business Council and others are engaging in a new phase of the initiative, which will directly build on the insights provided by the Future of Jobs Insight Report.
It is expected that the Future of Jobs work will force a more precise dialogue to strengthen the existing framework of collaboration for business leaders and provide new data and analysis for better-informed decision-making in the future with a view to enhancing talent pipelines and increasing competitiveness in the region. In particular, leaders in the region are keen to understand what skills should constitute the core of education in the future and what reforms the private sector, particularly within key industries, can initiate in a dialogue with the public and education sectors to leapfrog towards a more resilient and efficient learning and skills value chain. Furthermore, as disruptive change is expected to spread across the globe, what will be the impact in the region and how will the actors in the region prepare for this evolution? New industries and business models will emerge, new talent will be required and so this future-oriented body of work will be a critical tool to broaden the space for solutions to allow both existing and new industry sectors to thrive and support the region’s overall development. The Future of Jobs Report | 31 . Longer Term Focus • Rethinking education systems: By one popular estimate 65% of children entering primary schools today will ultimately work in new job types and functions that currently don’t yet exist. Technological trends such as the Fourth Industrial Revolution will create many new cross-functional roles for which employees will need both technical and social and analytical skills. Most existing education systems at all levels provide highly siloed training and continue a number of 20th century practices that are hindering progress on today’s talent and labour market issues. Two such legacy issues burdening formal education systems worldwide are the dichotomy between Humanities and Sciences and applied and pure training, on the one hand, and the prestige premium attached to tertiary-certified forms of education—rather than the actual content of learning—on the other hand. Put bluntly, there is simply no good reason to indefinitely maintain either of these in today’s world. Businesses should work closely with governments, education providers and others to imagine what a true 21st century curriculum might look like. • Incentivizing lifelong learning: The dwindling future population share of today’s youth cohort in many ageing economies implies that simply reforming current education systems to better equip today’s students to meet future skills requirements—as worthwhile and daunting as that task is—is not going to be enough to remain competitive.
Ageing countries won’t just need lifelong learning—they will need wholesale reskilling of existing workforces throughout their lifecycle. Governments and businesses have many opportunities to collaborate more to ensure that individuals have the time, motivation and means to seek retraining opportunities. For example, Denmark allocates funding for two weeks’ certified skills training per year for adults, and the strong emphasis the country places on in-work training helps explain its very high degree of employment mobility, with 70% of workers considering mid-career transitions a ‘good thing’, compared to 30% or less in most other European countries.20 At the company-level, technology can be continuously leveraged to upskill and reskill employees. • Cross-industry and public-private collaboration: Given the complexity of the change management needed, businesses will need to realize that collaboration on talent issues, rather than competition, is no longer a nice-to-have but rather a necessary strategy. Businesses should work with industry partners to develop a clearer view on future skills and employment needs, pooling resources where appropriate to maximize benefits, and work more closely with governments to map a future view of skill demand versus supply.
Resources should then be put into place regionally to upskill those out of work to fill high priority employment gaps. Such multi-sector 32 | The Future of Jobs Report partnerships and collaboration, when they leverage the expertise of each partner in a complementary manner, are indispensable components of implementing scalable solutions to jobs and skills challenges. While a single business can form one-to-one partnerships for its own talent needs, partnerships between multiple businesses, educational institutions and accreditation providers can result in an overall increase in the quality of the talent pool, at lower costs and with greater social benefits.
Businesses also need to engage with governments on strategically redeploying redundant skills between sectors, addressing cost concerns and social stability.21 . Chapter 2: The Industry Gender Gap Tapping into the female talent pool is increasingly regarded as a prominent and promising area for workforce planning. The previous chapter of this Report found that more than a quarter of companies surveyed identified female talent as a key feature of future workforce strategy. Overall, 53% of our respondents perceive promoting women’s participation as a priority item on their organization’s senior leadership’s agenda and 58% are confident about the efficacy of their current measures undertaken in this regard. Similarly, women’s rising labour force participation and economic power as consumers is increasingly perceived as a key driver of change across several industry sectors, such as in the Consumer industry, and one that is highly correlated with expected employment growth—an unambiguously positive trend in a somewhat turbulent landscape of technological, demographic and socioeconomic change. The continuing ascent of women in the workplace is also contributing to increasingly diverse and dynamic workplace cultures. As the Fourth Industrial Revolution takes hold in different industries and job families, it will affect female and male workers in distinct ways. By their very nature, many anticipated disruptive changes have the potential to enable the narrowing of gender gaps in many industries. For example, household work, that is still primarily the responsibility of women in most societies, could be further automated, leaving women to put their skill sets to better use, including in the formal labour market. At same time, however, job families expecting the highest employment growth, such as Architecture and Engineering and Computer and Mathematical, currently have some of the lowest female participation and find it much harder than average to recruit women.
As these job families take on newfound applications across industries, will sectors which previously housed few such roles but have a strong track record of employing, retaining and leveraging female talent, be more adept than others at addressing their skills shortages by recruiting female talent? At the declining end of the labour market, the drivers of change identified by our respondents will heavily disrupt two of the job families most clearly dominated by women and men: Office and Administrative and Manufacturing and Production, respectively. In short, as industries prepare to adapt to disruptive change the dynamics of the industry gender gap will be at the centre of many facets of the new employment landscape. Figure 14: Gender parity as part of future workforce strategy Share of respondents agreeing with statement, % Women’s economic power, aspirations perceived as driver of change in the industry Targeting female talent perceived as key future workforce strategy Industries Overall 10% 25% Basic and Infrastructure 10% 35% Consumer 21% 25% Energy 13% 36% 9% 30% 10% 17% Information and Communication Technology 3% 16% Media, Entertainment and Information 7% 46% Mobility 6% 21% 15% 21% Financial Services & Investors Healthcare Professional Services Source: Future of Jobs Survey, World Economic Forum. The Future of Jobs Report | 33 . Figure 15: Significance of rationales for gender parity, industries overall Share of respondents stating rationale, % Fairness and equality 42% Enhance innovation 23% Reflect gender composition of customer base 23% Enhance decision-making 22% Expand talent pool 16% External pressures, reputation 16% Government regulation 10% No rationale 9% Source: Future of Jobs Survey, World Economic Forum. Note: Names of rationales have been abbreviated to ensure legibility. Table 11: Significance of rationales for gender parity, by industry Share of respondents stating rationale, % BAS CON EN FS HE ICT MEI MOB PS OVERALL Fairness and equality 39 75 50 60 40 63 31 58 50 42 Enhance innovation 33 20 20 43 40 27 38 33 25 23 Reflect gender composition of customer base 14 35 40 43 30 33 31 13 39 23 Enhance decision-making 19 15 45 30 50 23 31 29 25 22 Expand talent pool 6 30 25 23 0 37 23 29 8 16 External pressures, reputation 28 20 0.0 5 7 10 33 15 13 17 0.4 16 Government regulation 22 5 15 13 10 20 8 8 3 10 No rationale 17 5 10 10 10 7 8 13 14 9 Demand by employees 6 10 10 0 10 7 15 21 11 9 Financial returns 11 10 0 17 10 0 31 0 22 8 Don't know 8 5 5 3 0 7 8 4 6 5 Industry 0.1 0.2 0.3 Source: Future of Jobs Survey, World Economic Forum. Note: Names of rationales have been abbreviated to ensure legibility. THE BUSINESS CASE FOR CHANGE Over the past 10 years, the World Economic Forum’s Global Gender Gap Report has been tracking the economic gender gap across different regions of the world. Progress has been uneven and slow. A mere 3% of the global economic gender gap has been closed over that period. In addition to a values-based case for gender equality, there is an accompanying economic imperative for including women more fully into society and the workplace. Female talent remains one of the most under-utilized business resources, either squandered through lack of progression or untapped from the onset.
Although women are, on average, more educated than men globally and now participate 34 | The Future of Jobs Report more fully in professional and technical occupations than 10 years ago, as of today, their chances to rise to positions of leadership are only 28% of those of men. Women continue to make up less of the labour force overall than men, and where they participate in the formal economy their earnings for similar work are lower.22 The talents of half the world’s potential workforce are thus often wasted or underutilized due to barriers on the path to women’s successful workforce integration. In general, women’s participation in the workforce is no longer perceived as a social issue alone, but also as a business issue—costing women, companies and ultimately entire economies. Many business leaders increasingly 0.5 .
Table 12: Gender gap and female share of customer base, by industry Share of female workforce, % Relative ease of recruitment Business to business Business to consumer Business to government Share of women Gender wage gap Current 2020 Current 2020 Current 2020 Current 2020 Industries Overall 30% 32% –0.74 –0.11 25% 33% 31% 33% 21% 27% Basic and Infrastructure 16% 35% –0.99 –0.20 16% 28% 26% 30% 18% 24% Consumer 33% 49% –0.63 –0.35 14% 18% 47% 49% 11% 15% Energy 19% 31% –1.08 0.14 18% 23% 26% 26% 18% 19% Financial Services & Investors 36% 38% –0.78 –0.11 25% 34% 39% 41% 19% 29% Healthcare 51% 15% –0.09 –0.10 50% 43% 57% 57% 60% 60% Information and Communication Technology 24% 25% –0.91 –0.39 25% 33% 24% 30% 17% 21% Media, Entertainment and Information 37% 18% –0.67 0.28 20% 32% 48% 44% 15% 19% Mobility 19% 39% –0.92 –0.04 21% 30% 21% 27% 16% 19% Professional Services 40% 22% –0.39 –0.09 31% 45% 32% 30% 20% 28% Industry group Source: Future of Jobs Survey, World Economic Forum. Note: Relative ease of recruitment measured on a qualitative –2 (“much harder”) to +2 (“much easier”) scale. Gender wage gap refers to share of responses in the affirmative. recognize that tackling barriers to equality can unlock new opportunities for growth. Our respondents perceive a wide range of rationales for promoting workplace gender parity, varying with the specific situation of different industries (Figure 15 and Table 11). Overall, the most frequently cited reason for promoting female talent is the ethical imperative “fairness and equality”, which was chosen by 42% of respondents. Just over a fifth of companies are further motivated by a range of rationales more closely tied to the success of their business— enhancing innovation and decision-making or reflecting the gender composition of their customer base. Enhanced decision-making, enhanced innovation Across all industries, nearly one in four companies reported supporting gender parity because of an expectation that it would enhance innovation, while a similar proportion cited a related reason, enhancing decision-making.
The Energy and Media, Entertainment and Information industries find these rationales particularly appealing while the Consumer and Information and Communication Technology industries do not cite them as a strong motivating factor. Employing and promoting more women is one accessible way companies can bring more diverse voices into their decision-making and business development—allowing fresh thinking and disrupting business models from within before they are disrupted from without.23 Indeed, the dividends of those diverse voices are best reaped when inclusion is not predicated on pure assimilation.24 Similarly, companies in which women are more strongly represented at the board and at senior management levels have been shown to outperform those where they are not.25 Reflecting gender composition of the customer base There is a strong correlation between companies’ perception of the gender composition of their customer base and the gender composition of their workforce across various industries (Table 12). Of course, existence of this correlation does not in itself reveal the direction of that relationship; whether a more gender diverse workforce allows businesses to tap into the female client base by developing a distinctive value proposition or, inversely, whether businesses with more female clients recruit more women.
Some industries are substantially more focused on this rationale than others, specifically the Professional Services, Financial Services & Investors and Consumer industries. For example, on average, just over two in five respondents from the Financial Services & Investors sector emphasize reflecting their customer base as one of their main rationales for promoting gender parity. With good reason, too: globally, women controlled 64% of household spending and 30 trillion dollars of consumer spending in 2013—and this figure is predicted to rise by almost a third over the five years to 2018.26 As women’s workforce participation rises, they will gain further purchasing power through increased lifetime disposable income.
The proportion of business-toconsumer (B2C) and business-to-business (B2B) clients who are women should therefore be expected to rise, as reflected in our respondents’ projections. Most industries expect between nine and 14 percentage point growth in female B2B clients over the 2015-2020 period, particularly the Professional Services, Media, Entertainment and Information and Basic and Infrastructure sectors. Expected growth of B2C clients is lower but starting from a higher base.
The Information and Communication Technology and Mobility industries expect the highest growth in their female B2C customer base, on average around six percentage points. Expanding the talent pool and external pressures Currently, women make up the majority of those enrolled in university in nearly 100 countries. However, “expanding the talent pool” lags behind as a perceived rationale for promoting gender parity. This may be because women’s ascendance in higher education is a relatively recent phenomenon among junior cohorts of many populations and company perceptions have not kept pace with the The Future of Jobs Report | 35 .
Table 13: Women’s workforce participation, by industry Share of female workforce, % Senior roles Industry group Industries Overall CEOs Board members Current Mid-level roles Junior roles Line roles Staff roles 2020 Current 2020 Current 2020 Current 2020 Current 2020 9% 28% 15% 25% 24% 33% 33% 36% 30% 34% 35% 39% Basic and Infrastructure 2 35 9 17 13 21 22 29 14 23 20 27 Consumer 10 21 16 24 26 33 33 37 31 34 37 41 Energy 0 32 11 20 19 27 24 27 19 25 22 30 Financial Services & Investors 9 19 20 30 33 40 43 43 35 39 42 43 Healthcare 6 — 15 28 31 44 39 46 44 49 41 48 Information and Communication Technology 5 19 11 20 21 29 32 34 23 32 33 38 Media, Entertainment and Information 13 22 25 33 25 32 35 36 38 43 47 46 Mobility 9 17 13 21 21 30 28 33 25 31 34 36 Professional Services 9 23 22 34 33 40 39 43 44 44 44 46 Source: Future of Jobs Survey, World Economic Forum. Table 14: Gender Gap, by job family Relative ease of recruitment Job family Share of women Gender wage gap Architecture and Engineering 11% 27% –1.18 Current 2020 Arts, Design, Entertainment, Sports and Media 48% 12% –0.21 0.07 Business and Financial Operations 43% 30% –0.42 –0.16 Computer and Mathematical 23% 28% –0.91 –0.13 Construction and Extraction 10% 48% –1.48 –0.64 Installation and Maintenance 8% 24% –1.43 –0.20 Management 25% 34% –0.84 –0.03 Manufacturing and Production 20% 32% –0.99 –0.12 Office and Administrative 54% 36% 0.21 0.31 Sales and Related 41% 35% –0.42 –0.03 –0.27 Source: Future of Jobs Survey, World Economic Forum. Note: Relative ease of recruitment measured on a qualitative –2 (“much harder”) to +2 (“much easier”) scale. Gender wage gap refers to share of responses in the affirmative. changing reality of the composition of the talent pool around them. Employers in the Information and Communication Technology and Mobility industries nevertheless find this rationale especially convincing. In Information and Communication Technology, a sector which struggles with talent shortages, no less than 37% of companies regard enhancing women’s workforce participation as an opportunity for expanding the talent pool.
Across all industries approximately 20% of respondents also reported they were feeling external pressures to address gender imbalances, either by media scrutiny and public opinion or by government regulation. GAPS IN THE FEMALE TALENT PIPELINE While national cultures and policies shape women’s participation in national workforces, sectoral cultures and practices also play a significant role. Today’s leaders have inherited company and industry cultures in which women participate to varying degrees. Across all industries, women’s workforce participation at junior, middle and senior levels is dramatically different.
Projecting their figures for 2020, companies expect some improvement, spread unevenly across different industries. However, across 36 | The Future of Jobs Report all industries there is a narrowing female talent pipeline heading towards senior management. Having invested in women as they enter in junior positions, employers appear to frequently lose their investment by failing to retain talent up the ladder (Table 13). On average, responding CHROs predict that the gender composition of today’s junior roles will be reflected in 2020’s mid-level roles, and that the gender breakdown of today’s mid-level roles will similarly carry through to 2020’s senior roles.
Across industries, there are expectations of a 7 to 9 percentage point increase in the share of women in mid-level roles by 2020 and an 8 to 13 percentage point increase in senior roles. This suggests an expectation that the workforce strategies employed to promote gender parity will be successful in retaining and promoting the majority of incoming female talent, against past experience. The projections for industries’ gender composition for senior, middle and junior roles in 2020 build on varying proportions today. Four industries—Basic and Infrastructure, Energy, Mobility and Information and Communication Technology—currently report a particularly low overall female workforce participation: 16%, 19%, 19% and 24%, respectively (Table 12).
Additionally, these industries also . Figure 16: Gender wage gap and women’s participation, by industry Share of female employees (%) 60 High female participation Healthcare 50 Professional Services 40 Media, Entertainment and Information Financial Services & Investors Overall Average Consumer 30 Information and Communication Technology 20 Energy Mobility Basic and Infrastructure 10 Large wage gap density 0 0 10 20 30 40 50 60 Respondents reporting wage gaps (%) Source: Future of Jobs Survey, World Economic Forum. report a more dramatic drop off of female employees between junior and senior level positions. In Information and Communication Technology, women currently make up 11% of senior level roles and 32% of junior level roles. Low intake of women at the junior level translates to similar underperformance later in the pipeline. Industries that have a comparatively high proportion of women in junior positions include: Financial Services & Investors, Healthcare, Media, Entertainment and Information and Consumer. Conversely, the Information and Communication Technology, Mobility, Energy, and Basic and Infrastructure sectors recruit fewer women into junior positions. While employers in the Basic and Infrastructure industry currently recruit a mere 22% women as part of their junior level staff, employers project that they will, on average, expand that figure to 29% in 2020.
Fulfilling that prediction would see the Energy sector become the industry with the lowest proportion of women in entry level roles by 2020. However, following current predictions, Basic and Infrastructure will still remain the industry with the worst gender balance in senior roles. These numbers reveal that companies are focusing primarily on progressing women through the pipeline to avoid losing already developed or developing talent. Few industries are targeting strong increases when it comes to hiring women into junior and entry level roles. Employers in the Healthcare and Basic and Infrastructure industries are targeting a 7 percentage point increase. Mobility employers expect to improve their initial intake by 5 percentage points. The least ambitious targets for junior level hiring are in Financial Services & Investors, Media, Entertainment and Information and Information and Communication Technology.
Financial Services & Investors companies report high junior level recruitment—around 43% of their workforce at this level is female. On the other hand, Information and Communication Technology reports a 10% lower share of junior recruits, making the proportion of women at entry level 34%. The gender balance of women on boards is similar or better to the proportion of women in senior roles. At the CEO level, however, women remain profoundly underrepresented.
The breakdown of women in line and staff roles highlights some of the barriers to top level positions. Women are under-represented in line roles in Mobility, Information and Communication Technology, Energy and Basic and Infrastructure, with line roles more likely to equip women with the skills and experience that would prepare them for senior positions. On average, the Mobility, Information and Communication Technology and Media, Entertainment and Information sectors are expecting to close the gap in women’s line and staff role participation by 4 to 6 percentage points over the 2015-2020 period. Overall, the figures paint a challenging picture. Across all industries, companies reported that they found women harder to recruit.
The reported ease (or in this case, difficulty) of recruiting women is directly proportional to the existing gender composition of the industry. Persistent gender wage gaps are reported across all industries, even in industries where female participation is comparatively high (See Table 14 and Figure 16). The highest share of respondents stating that there was a wage gap in their industry is in the Consumer sector (49%), followed by Mobility, Financial Services & Investors and Basic and Infrastructure.
That is, gender wage gaps are not always directly symmetrical to the magnitude of women’s participation in the respective industry. BARRIERS TO CHANGE Our respondents’ views concerning the barriers to women’s workforce participation vary by industry and often reflect different industry cultures in addition to overarching economic and societal factors. Among overarching factors, The Future of Jobs Report | 37 . Figure 17: Significance of barriers to gender parity, industries overall Share of respondents reporting barrier, % Unconscious bias among managers 44% Lack of work-life balance 44% Lack of role models 39% Lack of qualified incoming talent 36% Women’s confidence, aspirations 31% Societal pressures 23% Unclear career paths 17% Lack of talent, leadership development for women 15% Don’t know 12% No barriers 10% Lack of parental leave 6% Source: Future of Jobs Survey, World Economic Forum. Note: Names of barriers have been abbreviated to ensure legibility. the ones most visible through the data are the dual burden of caregiving and breadwinning, unconscious biases, traditional organizational practices in the workplace, a lack of role models, confidence, and the traditional divide between women and men in STEM education. 0.0 Women have traditionally played a larger role in the 0.1 private sphere as caregivers. Today, women still on average perform a much larger share of unpaid work across countries around the world—from routine housework to childcare, the value of this labour amounts to more than 20% of GDP across most OECD countries.27 Many employers thus believe lack of work-life balance is a key deterrent to women’s participation at work. This factor thus appears to influence all industries. While in nearly all industries and geographies there has been a marked shift away from deliberate exclusion of women from the workplace, there continue to be cultural beliefs that lead to unconscious biases. This includes perceptions that successful, competent women are less “nice”; that strong performance by women is due to hard work rather than skills; and assumptions that women are less committed to their careers.28 In addition, especially in well-established, older organizations, workplace structures that were designed for a past era still, often unwittingly, favour men.
Additionally, women’s historically low participation in the labour market means they have relatively fewer role models to look towards across all industries. Research from the US, UK and Germany suggests that women have a poor perception of senior roles and lack a clear line of sight as to how senior leadership positions might help them achieve their objectives, lacking role models who can reveal the trade-offs and benefits they 38 | The Future of Jobs Report bring.29 Women’s confidence and aspirations are seen as another barrier. Women are less likely to want a top job— citing the stress or pressure of the role as a deterrent.30 An often cited barrier is a lack of qualified incoming female talent in specific fields, especially in STEM education, 0.2 0.3 0.4 where women currently make up only 32% graduates across the world.31 Finally, where each industry stands specifically is often affected by how recently an industry has improved its gender balance. Given that career choices are disproportionately affected by prior experience and bias, traditionally male dominated professions often find it difficult to attract women. Across all industries, unconscious bias among managers and lack of work-life balance are cited as the two top barriers to women’s workforce integration over the 2015–2020 period.
The proportion of employers reporting these two factors as their main concern is equal—44% for each. Around 36% of respondents also voiced a concern about the availability of qualified talent, in particular employers in the Energy, Information and Communication Technology and Mobility industries. This is reflected in their low estimate of the current share of female junior staff, at 24%, 32% and 28%, respectively (Figure 17).
The Information and Communication Technology industry sees this issue as their main barrier to a more gender balanced workforce. Basic and Infrastructure has a similarly low number of female junior staff, but there is less emphasis by respondents on incoming talent qualification, with unconscious bias by managers instead cited as the top concern. Financial Services & Investors and Professional Services place more emphasis on women’s own aspirations as a barrier, with Professional Services seeing it as the 0.5 .
Table 15: Significance of barriers to gender parity, by industry Share of respondents reporting barrier, % BAS CON EN FS HE ICT MEI MOB PS OVERALL Unconscious bias among managers 50 55 70 37 50 47 46 33 42 44 Lack of work-life balance 42 70 30 53 20 47 54 54 42 44 Lack of role models 44 40 55 47 50 37 31 50 31 39 Lack of qualified incoming talent 33 15 60 20 40 57 15 63 36 36 Women's confidence, aspirations 28 30 10 43 10 37 31 29 50 31 Societal pressures 22 25 25 17 20 17 15 33 39 23 Unclear career paths 31 30 5 20 10 20 23 4 14 17 Lack of talent, leadership development for women 17 0 10 23 20 27 8 13 14 15 Don't know 6 20 15 13 30 7 31 4 17 12 No barriers 6 10 15 13 20 7 23 4 14 10 Lack of parental leave 17 5 0 7 20 0 0 13 0 6 No strategy 0 0 0 3 0 0 0 0 0 0 Barrier Source: Future of Jobs Survey, World Economic Forum. Note: Names of barriers have been abbreviated to ensure legibility. main limiting factor for promoting women’s talent. Lack of work-life balance is perceived as a particular barrier in the Consumer and Financial Services & Investors industries. By contrast, few sectors cited lack of parental leave as an issue (Table 15). WOMEN AND WORK IN THE FOURTH INDUSTRIAL REVOLUTION As the Fourth Industrial Revolution takes hold in different industries and job families, it will affect female and male workers and the dynamics of the industry gender gap in manifold ways. By their very nature, many of the current expected drivers of change have the potential to enable the narrowing of industry gender gaps.
Household work could be further automated, relieving some of the current dual burden and allowing women to put their skills to use in the formal economy. Changes to what have traditionally been men’s roles in the workforce will also reshape the division of labour at home. Similarly, many respondents and industry observers agree on the need to rethink work, taking a holistic approach to workforce planning.
Shaping the new and emerging landscape of flexible working presents an unprecedented opportunity to rebalance the gender divide, for example by providing companies with a chance to explore results-driven rather than presence-driven role evaluation. Harnessed well, the emergence of new flexible working patterns and other similar trends could result in a more gender balanced workplace.32 However, as disruptive change is coming to business models, jobs are displaced and a new labour market materializes out of the vestiges of the old, there is also a risk that these trends and drivers of change might sustain or worsen other existing gendered inequalities.33 At the declining end of the labour market, the drivers of change identified by our respondents will heavily disrupt some of the job families with the largest share of female employees, such as Office and Administrative roles, but also some of those with the largest traditional gender gap, such as Manufacturing and Production. From a net employment outlook perspective—by simply translating job families’ reported current gender composition (Table 14) to the expected absolute job gains and losses over the 2015–2020 period calculated in the previous chapter (Figure 6)—we find that the burden of expected job losses due to disruptive change falls almost equally on women and men: 2.45 million (48%) of the expected total net job loss of 5.1 million falls on women, 2.65 million (52%) of it on men. That, in itself, indicates widening gender gaps in the workforce, as women make up a smaller share of the overall labour force.
In absolute terms, men will face nearly 4 million job losses and 1.4 million gains, approximately one job gained for every three jobs lost, whereas women will face 3 million job losses and only 0.55 million gains, more than five jobs lost for every job gained. On current trends and predictions, men will lose more than 1.7 million jobs across the Manufacturing and Production and Construction and Extraction job families, but are set to gain over 600,000 jobs in Architecture and Engineering and Computer and Mathematical functions. Women will only lose 0.37 million jobs in these two male-dominated job families but are set to gain little more than 100,000 jobs in Architecture and Engineering and Computer and Mathematical functions if current gender gap ratios persist over the 2015–2020 period—nearly one new STEM job per four jobs lost for The Future of Jobs Report | 39 .
Figure 18: Significance of strategies for women’s workforce integration, industries overall Share of respondents pursuing strategy, % Promote work-life balance 38% Set targets and measure progress 33% Development and leadership training of women 32% Demonstrate leadership commitment 30% Build awareness of the benefits among managers 29% Offer, support flexible work 28% Transparent career paths, salary structures 19% Support women’s integration into the value chain 17% Source: Future of Jobs Survey, World Economic Forum. Note: Names of strategies have been abbreviated to ensure legibility. men, but only one new STEM job per 20 jobs lost for women. The conclusion is clear. If current industry gender gap trends persist and labour market transformation towards new and emerging roles in computer, technology and engineering-related fields continues to outpace the rate at which women are currently entering those types of jobs, women are at risk of losing out on tomorrow’s best job opportunities while aggravating hiring processes for companies due to a restricted applicant pool and reducing the diversity dividend within the company. However—while substantially more effort will be 0.00 0.05 needed—our data contains some encouraging signs that 0.10 current trends need not continue. As traditionally maledominated job families take on newfound importance and applications in industries that previously housed few such roles but have a strong track record of employing, retaining and leveraging female talent, the current culture may drive future recruitment efforts in new roles. However more deliberate efforts will also be needed to meet talent needs and address gender gaps.
As demand for talent in Architecture and Engineering and Computer and Mathematical fields—with poor gender balance—grows, governments, individuals and companies will need to ensure that the full talent pool of men and women is educated, recruited and promoted. APPROACHES TO LEVERAGING FEMALE TALENT The Report’s findings confirm that targeting female talent is a strategy that is particularly characteristic of those companies that prioritize future workforce planning and change management and that are confident that they are on the right track in their approach to preparing for impending disruptive change. In order to leverage the benefits of gender diversity, companies need to take a holistic approach, starting at the top. Actively managing talent rather than passive commitment has been shown to lead to better returns. While some of the transformations in corporate practices 40 | The Future of Jobs Report and public policies will entail adaptation in the short term by families, companies and the public sector, in the long term, the subsequent expansion of opportunities for women has the potential to transform the economies, societies and demographics of countries as a whole. It is important to emphasize that these interventions do not work as a checklist of actions that will each independently produce results. Flexibility in the workplace is, alone, not enough to guarantee improving gender equality. It must be accompanied by a holistic set of priorities and long-term commitments, and by a deep understanding of the corporate, industry, and cultural context, as well as the 0.15 0.20 0.25 0.30 0.35 0.40 organizational culture and local policy environment. The World Economic Forum’s online Repository of Successful Practices for Gender Parity pools information on the practices that have been successfully used in leading companies worldwide to close gender gaps at the company level, as well as along the companies’ supply chain and surrounding communities.34 The repository suggests six dimensions around which to focus an organization’s gender parity efforts. • Measurement and target setting: Achievable, relevant recruitment and retention targets at all levels, with an embedded accountability mechanism, are critical.
Developing a disaggregated database can help to evaluate the causes of gender imbalances and track progress. Transparent salary bands to track and address male and female salary gaps are additional useful tools to understand the status quo in organizations. • Mentorship and training: Companies have benefitted from programmes that promote guidelines on the value of diversity as an underlying culture of the organization, and impart knowledge on how to manage a more diverse workforce and how to attract, retain and promote female talent. These training programmes, for both men and women, can be relevant for shaping an environment within the broader employee base for women to successfully lead.
In addition, many . Table 16: Significance of strategies for women’s workforce integration, by industry Share of respondents pursuing strategy, % BAS CON EN FS HE ICT MEI MOB PS OVERALL Promote work-life balance 32 50 15 43 10 40 46 63 47 38 Set targets and measure progress 46 30 40 33 50 37 23 21 36 33 Development and leadership training of women 35 45 35 30 30 33 23 42 31 32 Demonstrate leadership commitment 27 25 45 37 30 30 15 29 36 30 Build awareness of the benefits among managers 41 40 30 20 40 33 31 25 25 29 Offer, support flexible work 24 25 25 43 40 30 31 17 36 28 Transparent career paths, salary structures 5 30 25 23 0 37 23 29 8 19 Support women's integration into the value chain 11 25 25 17 30 20 15 21 14 17 Don't know 19 10 10 13 20 10 23 13 17 14 No strategy 22 5 15 20 10 7 15 8 14 13 Create incentives and accountability 8 0 0 7 10 3 15 8 3 5 Subsidize childcare 3 0 10 7 0 3 0 13 8 5 Offer parental leave 3 0 0 3 20 10 8 4 6 5 Promote gender parity through customer outreach 3 10 5 3 0 0 15 0 3 3 Support parents' reintegration after leave 3 0 5 0 0 3 0 4 8 3 Philanthropic and social responsibility efforts 0 0 10 0 0 3 0 4 3 2 Subsidize eldercare 0 0 0 0 0 0 0 0 3 0 Strategies Source: Future of Jobs Survey, World Economic Forum. Note: Names of strategies have been abbreviated to ensure legibility. • • companies have formal mentoring schemes for women seeking leadership positions, although they also find that high-potential women lack the sponsorship and tailored training needed to move into the executive ranks. A repositioning of the human resources function beyond a focus on systems and administration to talent development and training can help address specific roadblocks for women, in addition to better overall talent management. Awareness and accountability: The focus of many companies on building awareness indicates that the case for change still needs to be built to make progress. Accountability of the senior management and transparency of career paths and opportunities have proven to be effective practices. Ensuring that management policies, processes, systems and tools do not harbour gender-based discrimination, as well as enhancing the understanding of unconscious biases can, also make inclusive leadership more tangible. Work environment and work-life balance: Women are often the primary caregiver for both children and the elderly in most countries.
Ensuring smooth on- and • • off-ramping and appropriate childcare options, and developing guidelines on implementation of worklife balance policies and mentoring for women going through a transition are important levers to ensure a sustained career progression towards management. For those companies that already offer parental leave, flexible working hours and other work-life balance programmes, the next steps lie in accelerating their use and acceptance by female and male employees. Leadership and company commitment: Visible leadership by the chief executive and top management on supporting women in management has proven to be one of the most important levers for progress in achieving gender diversity in a corporate context. This includes concrete and symbolic actions by top management and, in many cases, establishment of a position or department to lead diversity efforts. Regular communications by senior management on gender equality have been found to be critical. Responsibility beyond the office: Many companies have leveraged the opportunity to exercise external influence along the value chain, including diversity The Future of Jobs Report | 41 . Box 3: Anticipating the Future of Jobs: Human Capital and Gender Parity in the Oil and Gas Industry In many industries there is a growing scope for collaboration rather than competition to address talent challenges. For example, several human capital challenges in the Oil and Gas sector are directly linked to the cyclical nature of the industry and others, primarily those that affect long-term horizons, are associated with a shortage of qualified employees, a lack of experienced mid-tenure employees, and the need to foster technological innovation. Over this long-term context, the Oil and Gas industry broadly faces obstacles in recruiting workready technical engineers and in developing, attracting and retaining female talent. In order to continue to serve the world’s growing energy needs while improving opportunities for youth in emerging markets and for women, leaders of the Oil and Gas community aim to address these challenges collectively. Given the long-term talent needs and skills gaps in the industry, the Forum’s industry project in this space aims to develop demand-driven criteria for educational institutions working with leading companies in the sector.
The first objective is to produce an industry-endorsed standard curriculum that aims at bridging the gap in training of petroleum engineers across geographies. The curriculum focuses on engineering fundamental knowledge such as mathematics and geology but also non-engineering skills such as project management, finance and communication. In order to prioritize certain regions or countries, the Future of Jobs project’s insights will be used to identify critical skills gaps based on industry needs.
The World Economic Forum will then play a facilitator role bringing together the industry and relevant universities and ministries in order to move forward the common dialogue. The Forum’s analysis illustrates that the Oil and Gas industry, despite on-going efforts in the field of diversity and inclusion, continues to miss out on the diversity dividend, with participation of women in the workforce still lagging behind other training for suppliers, distributors and partners and training to support women-owned businesses in the organization’s value chain. External influence can also be exercised by ensuring gender neutrality in advertising, engaging girls and young women to display possible career paths and developing partnerships with gender parity-focused civil society and public sector initiatives. Beyond individual company practices and challenges, it is clear that there are specific and common gender gap challenges within industries. This is thus an area ripe for intra-industry collaboration and for improved public-private collaboration, to balance both public and business interest. Such collaborations and partnerships are currently relatively rare but there are emerging experiments that indicate the greater efficiency for business and improved societal outcomes are possible through such approaches. The moral case for gender equality has, in the most part, been won.
The business and economic case is also increasingly understood. The Fourth Industrial Revolution now presents an unprecedented opportunity to place women’s equal participation in the workplace at the heart of preparations for the shifts to come. 42 | The Future of Jobs Report major industries. In order to increase efforts to tackle these persistent gender gaps along the Oil and Gas talent pipeline, major players from the industry are also coming together to collectively address contextual and industry-specific factors contributing to these gaps.
Alongside a straightforward desire from many in the sector to create a more diverse workforce, interviews with Oil and Gas executives suggest they also believe that taking advantage of this huge potential talent pool is a critical business objective. Skills gaps and the looming retirement of experienced engineers and technical talent currently present in the Oil and Gas workforce mean that companies need increasingly to look elsewhere to find the talent and knowledge they require. The group looked specifically at data on gender gaps at junior, middle, senior, board and CEO levels. A Call to Action is currently being developed that aims to state the group’s vision and demonstrate the practices major players’ will undertake to advance gender parity.
The declaration includes a set of guiding principles that will underpin the industry’s efforts on gender parity, such as: ensuring visible leadership on gender parity and company commitment at all levels; promoting gender sensitive recruitment, retention and promotion policies and setting challenging but achievable goals for gender diversity. This Call to Action will also serve as a platform to help Oil and Gas business leaders, their companies, owners and shareholders around the world address the factors contributing to the gender gap. Members of the Oil and Gas community also encourage companies to share best practices, creating an opportunity to learn from and build upon successful interventions for the benefit of the entire industry.
This pilot project points to collaborative mechanisms that can be applied across other industries, in partnership with governments and educational institutions. . Endnotes 1 McLeod, Scott and Karl Fisch, “Shift Happens”, https://shifthappens. wikispaces.com. 2 The structure of our survey means the base sample—the unique data points that can be used for our analysis—commonly refers to these 1,346 occupation-level responses, although in some cases it is restricted to the 371 company-level responses. For details on our survey design, or any of the other points discussed in this section, please refer to Appendix A: Report Methodology. 3 Please refer to: www.onetonline.org. 4 See Autor, D., 2013. 5 A recent World Economic Forum report, in collaboration with the Global Agenda Council on the Future of Software and Society, found that a significant number of disruptive technological changes are expected to reach a‑in the early years of the next decade, with the earliest expected to fully take hold by 2018 and the latest by 2027 (see: “Deep Shift: Technology Tipping Points and Societal Impact”). 6 See, for example: Pew Research Centre, Key Insights: Expert Views on Artificial Intelligence, Robotics, and the Future of Jobs, 2014. 7 Estimated employment effects have been converted into compound growth rates for the 2015–2020 period, i.e. the mean growth rate over the specified period of time if employment had grown or declined at a steady rate, which is unlikely to be the pattern observed in reality. A compound growth rate can be thought of as a way to smooth out a rate of change so that it may be more easily understood (for details, see Appendix A: Report Methodology). 8 For details of our net employment estimation, please see Appendix A: Report Methodology. 9 Source: International Labour Organization, World Employment and Social Outlook - Trends 2015, www.ilo.org/global/about-the-ilo/ newsroom/news/WCMS_336884/lang--en/index.htm. 10 For a fuller discussion of the coverage and representativeness of our perception survey-based data, please refer to Appendix A: Report Methodology. 11 See, for example: Chui, Michael, James Manyika and Mehdi Miremadi, “Four fundamentals of workplace automation,” McKinsey Quarterly, November 2015; and Cognizant, The Robot and I: How New Digital Technologies Are Making Smart People and Businesses Smarter by Automating Rote Work, Cognizant Center for the Future of Work, 2015. 12 See: Infosys, Amplifying human potential: Education and skills for the fourth industrial revolution, 2016. 13 McLeod, Scott and Karl Fisch, “Shift Happens”, https://shifthappens. wikispaces.com. 14 Bessen, James, “Employers Aren’t Just Whining – the “Skills Gap” Is Real”, Harvard Business Review, 14 August 25, https://hbr. org/2014/08/employers-arent-just-whining-the-skills-gap-is-real. 18 See: ManpowerGroup, Teachable Fit: A New Approach to Easing the Talent Mismatch, 2010, http://www.manpowergroup.com/ sustainability/teachable-fit-inside.html. 19 See: World Economic Forum and the Global Agenda Council on Employment, Matching Skills and Labour Market Needs: Building Social Partnerships for Better Skills and Better Jobs, 2014. 20 See: Gvaramadze, 2010, and Voss, 2009. 21 See: World Economic Forum, Disrupting Unemployment: Business-led Solutions for Action, 2015. 22 World Economic Forum, Global Gender Gap Report, 2015. 23 See, for example: Page, S., The Difference: How the Power of Diversity Creates Better Groups, Firms, Schools, and Societies, 2007. 24 See, for example: Deloitte, Global Human Capital Trends 2014: Engaging the 21st Century Workforce, 2014.
However, the kind of diversity women bring to teams today and in the future can be debated. Existing research suggests women are seen as more collaborative and flexible, while men are more results-orientated and have more invested in topic expertise. These characteristics mirror the roles that are socially encouraged for men and women today.
It might be misplaced to infer flexibility and team cohesion are the indefinite quality to women’s contribution to the diversity of opinions; it might be that when traditional workplace roles for men and women are disrupted, current polarizations cease to hold true. 25 Department for Business, Innovation and Skills, Women on Boards, 2011. 26 See: Catalyst, Buying Power: Global Women, 2015, www.catalyst.org/ knowledge/buying-power-global-women, and Silverstein, M. and K. Sayre, “The Female Economy”, Harvard Business Review, September 2009. 27 OECD, “Cooking and Caring, Building and Repairing: Unpaid Work around the World”, in Society at a Glance 2011: OECD Social Indicators, 2011. 28 McKinsey & Company, Women in the Workplace, 2015. 29 Centre for Talent Innovation, Women Want Five Things, 2014. 30 Ibid. 31 Source: UNESCO Institute for Statistics (UIS) database (September 2015); calculated from percentage of tertiary-level STEM graduates (female, male). 32 See: Mercer, When Women Thrive Businesses Thrive, 2014. 33 Voss, G., “The Second Shift in the Second Machine Age: Automation, Gender and the Future of Work”, in Our Work Here is Done: Visions of a Robot Economy, NESTA, 2014. 34 See: www.weforum.org/gender-parity/closing-gender-gap. 15 Our empirical analysis of the O*NET Content Model found that the core skill set of most occupations consists of a range of combinations of these 35 core skills and abilities, in addition to occupation-specific specialist knowledge. Note that, unlike for occupations, a widely agreed or internationally comparable definition or taxonomy of the term ‘skills’ does not exist (see, for example: European Training Foundation Anticipating and Matching Skills Demand and Supply: Synthesis of National Reports, 2012).
For details of the Report’s adaption of O*NET’s work-relevant core skills please refer to Appendix A: Report Methodology. 16 For details of the methodology used in this section, please refer to Appendix A. 17 Also see: World Economic Forum and the Global Agenda Council on Employment, Matching Skills and Labour Market Needs: Building Social Partnerships for Better Skills and Better Jobs, 2014. The Future of Jobs Report | 43 . . References and Further Reading DRIVERS OF CHANGE, TRENDS AND DISRUPTIONS Annunziata, M. and S. Biller, The Future of Work, GE Discussion Paper, General Electric, 2014. Bessen, J., “Toil and Technology: Innovative technology is displacing workers to new jobs rather than replacing them entirely”, IMF Finance and Development Magazine, March 2015. Pew Research Centre, Key Insights: Expert Views on Artificial Intelligence, Robotics, and the Future of Jobs, 2014. PwC, The Future of Work: A Journey to 2022 & Global Megatrends, 2014, http://www.pwc.com/gx/en/issues/megatrends/index.jhtml. Salazar-Xirinachs, J.M. Trends and disruptions and their implications for the Future of Jobs, Discussion Paper, 2014. Boston Consulting Group, Man and Machine in Industry 4.0: How Will Technology Transform the Industrial Workforce Through 2025?, 2015. Silverstein, M.
and K. Sayre, “The Female Economy”, Harvard Business Review, September 2009. Brynjolfsson, E. and A.
McAfee, The Second Machine Age: Work, Progress, and Prosperity in a Time of Brilliant Technologies, 2014. Stewart, I., D. De and A. Cole, Technology and people: The great jobcreating machine: Deloitte Discussion Paper, December 2014. Burrow, S., “How will climate change affect jobs?”, Forum Agenda Blog, December 2015. Talwar, R.
and T. Hancock, The shape of jobs to come: Possible New Careers Emerging from Advances in Science and Technology (20102030), Fast Future Research, 2010. Cappelli, P. and J.
Keller, “Classifying Work in the New Economy”, Academy of Management, vol. 38, no. 4, 2013, pp.
575–596. Catalyst, Buying Power: Global Women, 2015. Christensen, C., M. Raynor and R. McDonald, “What is Disruptive Innovation?”, Harvard Business Review, December 2015, pp.
44-53. Citi, “Technology at Work: The Future of Innovation and Employment”, Citi GPS: Global Perspectives & Solutions, February 2015. Frey, C. and M. Osborne, The Future of Employment: How Susceptible are Jobs to Computerisation? Oxford Martin School Programme on the Impacts of Future Technology, September 2013. GE Reports and The Economist, “Infographic: No seriously, wearables will be a thing - How this fast-growing sector will change the way we work”, GE Look Ahead, 2014. IndustriALL Global Union, Industry 4.0 the industrial revolution happening now, 4 December 2015, www.industriall-union.org/industry-40-theindustrial-revolution-happening-now. Institut der deutschen Wirtschaft Köln, “The Effects of Digitalization on Employment – First Impressions from the IW Human Resources Panel”, IW-Trends 3/2015 (in German). International Labour Organisation (ILO), World Economic and Social Outlook 2015, 2015. Karabarbounis, L.
and B. Neiman, The Global Decline of the Labour Share, NBER Working Paper 19136, National Bureau of Economic Research, 2013. TATA Consultancy Services, Workplace of the Future: A View from European Youth, 2014. The Economist Intelligence Unit, Automated, creative & dispersed: The Future of Work in the 21st Century, 2015. The Economist, “Special Report: The Third Great Wave”, 2014. The Financial Times, “World will have 13 ‘super-aged’ nations by 2020”, 6 August 2014, http://www.ft.com/cms/s/0/f356f8a0-1d8c-11e4-8f0c00144feabdc0.html. World Economic Forum, The Human Capital Report 2015, 2015. World Economic Forum Global Agenda Council on the Future of Software and Society, Deep Shift: Technology Tipping Points and Societal Impact, World Economic Forum Global Agenda Council White Paper, 2015. INDUSTRY AND REGIONAL FOCUS Annunziata, M. and R.
Rostom, Mapping the Future of Work in MENAT, General Electric, 2014. Committee for Economic Development of Australia, Australia’s Future Workforce?, 2015. EY, Fuelling the next generation: A study of the UK upstream oil and gas workforce, 2014. ManpowerGroup, Entering the Human Age, 2013. European Commission, “EU employment in a global context: where will new jobs come from and what will they look like?”, Employment and Social Developments in Europe 2013, 2014, http://ec.europa.eu/social/main. jsp?catId=738&langId=en&pubId=7684&visible=1. McKinsey Global Institute, Disruptive technologies: Advances that will transform life, business, and the global economy, 2013. Freelancer’s Union and Upwork, Freelancing in America: A National Survey of the New Workforce, 2015. McKinsey Quarterly, Manager and machine: The new leadership equation, 2014. Government of Ireland, Expert Group on Future Skills Needs, Reports on Future Skills Requirements, various sectors, 2008-2013. Mishel, L, H. Shierholz and J. Schmitt, Don’t Blame the Robots: Assessing the Job Polarization Explanation of Growing Wage Inequality, Economic Policy Institute and Center for Economic Policy Research Working Paper, 2013. Institute for the Future, The Future of California’s Workforce, 2012. Keynes, J.M.
Economic Possibilities for our Grandchildren, 1930. Mokyr, J, C. Vickers and N. Ziebarth, “The History of Technological Anxiety and the Future of Economic Growth: Is This Time Different?”, Journal of Economic Perspectives, vol.
29, no. 3, Summer 2015, pp. 31–50. Mandel, M.
“Where are the Big Data Jobs?”, Progressive Policy Institute, 2014. — —, Where the Jobs Are: The App Economy, TechNet, 2012. — McKinsey Global Institute, Help wanted: The Future of Work in Advanced Economies: Discussion Paper, 2012. O’Connor, S., “The human cloud: A new world of work”, Financial Times, 8 October 2015. — —, India’s technology opportunity: Transforming work, empowering — people, 2014. Organisation for Economic Co-operation and Development (OECD), Jobs Quality, Directorate for Employment, Labour and Social Affairs – Employment, Labour and Social Affairs Committee, 16-17 October 2014. National Skill Development Corporation of India, Human Resource and Skill Requirements for 2022 Sector Reports, various sectors, 2014, http:// www.nsdcindia.org/nsdcreports. UK Commission for Employment and Skills, Careers of the Future, Evidence Report 89, 2014. The Future of Jobs Report | 45 . — —, The Future of Work: Jobs and skills in 2030, Evidence Report 84, — 2014. . US Bureau of Labor Statistics, Employment Projections 2012-2022, 2013. Ely, R., Ibarra, H. and D. Kolb, “Taking Gender Into Account: Theory and Design for Women’s Leadership Development Programs”, INSEAD Working Paper, 2011. World Economic Forum, Industry Transformation Briefings, various sectors [see Appendix B], 2014. Institut der deutschen Wirtschaft Köln, “Fachkräfteengpässe in Unternehmen: Geschlechterunterschiede in Engpassberufen”, Studie 2/2015 (in German). SKILL SETS OF THE FUTURE International Labour Organization (ILO), “The Gender Divide in Skills Development: Progress, Challenges and Policy Options for Empowering Women”, Skills for Employment Policy Brief, 2014. Anderson, C.
and J. Gantz, Skills Requirements for Tomorrow’s Best Jobs: Helping Educators Provide Students with Skills and Tools They Need, IDC Opinion, October 2013. Autor, D., The “Task Approach” to Labor Markets: An Overview, IZA Discussion Paper No. 7178, 2013. — —, The Polarization of Job Opportunities in the U.S.
Labor Market: — Implications for Employment and Earnings, Center for American Progress and The Hamilton Project, 2010. Autor, D, F. Levy and R. Murnane, “The Skill Content of Recent Technological Change: An Empirical Exploration”, Quarterly Journal of Economics, vol.
118, no. 4, 2003, pp. 1,279-1,333. Burning Glass Technologies, Crunched by the Numbers: The Digital Skills Gap in the Workforce, 2015. Cappelli, P.
Skill Gaps, Skill Shortages and Skill Mismatches: Evidence and Arguments for the US, NBER Working Paper 20382, National Bureau of Economic Research, 2014. Deming, D., The Growing Importance of Social Skills in the Labor Market, NBER Working Paper 21473, National Bureau of Economic Research, 2015. European Centre for the Development of Vocational Training (CEDEFOP), Piloting a European Employer Survey on Skill Needs: Illustrative Findings, CEDEFOP Research Paper No. 36, 2013. — —, Quantifying Skills Needs in Europe – Occupational Skills Profiles: — Methodology and Application, CEDEFOP Research Paper No. 30, 2013. — —, Skills supply and demand in Europe: Medium-term forecast up to — 2020, 2010. Infosys, Amplifying human potential: Education and skills for the fourth industrial revolution, 2016. Institute for the Future and the University of Phoenix, Future Work Skills 2020, 2011. International Labour Organisation (ILO) and the European Union, Research Brief: Anticipating skills needs for the low carbon economy? Difficult, but not impossible, 2012. ILO and the CEDEFOP, Skills for Green Jobs: A Global View – Synthesis Report Based on 21 Country Studies, 2011. Katz, L.
and R. Margo, Technical Change and the Relative Demand for Skilled Labour: The United States in Historical Perspective, NBER Working Paper 18752, National Bureau of Economic Research, 2013. NESTA, Creativity vs Robots: The Creative Economy and the Future of Employment, 2015. — —, Skills of the Datavores: Talent and the Data Revolution, 2015. — Organisation for Economic Co-operation and Development (OECD), “Skills and Jobs in the Internet Economy”, OECD Digital Economy Papers No. 242, 2014. — —, OECD Skills Outlook 2013: First Results from the Survey of Adult — Skills, 2013. The Economist Intelligence Unit, Changing roles: How technology is transforming business functions, 2015. Kaplan, J., “The Age of the Robot Worker Will Be Worse for Men: The jobs that are least vulnerable to automation tend to be held by women”, The Atlantic Magazine, 2015. Lewis, C., “Women and Jobs in the Robot Economy”, RobotEnomics Blog, 2014, http://robotenomics.com/2014/01/03/women-and-jobs-in-therobot-economy. McKinsey & Company, Women in the Workplace, 2015. OECD, “Cooking and Caring, Building and Repairing: Unpaid Work around the World”, in Society at a Glance 2011: OECD Social Indicators, 2011. Voss, G., “The Second Shift in the Second Machine Age: Automation, Gender and the Future of Work” in Our Work Here is Done: Visions of a Robot Economy, NESTA, 2014. CHANGE MANAGEMENT AND FUTURE WORKFORCE PLANNING Accenture, Burning Glass Technologies and Harvard Business School, Bridge the Gap: Re-Building America’s Middle Skills, 2015. Arias, O., “Are skills really a panacea for unemployment?”, Forum Agenda Blog, 2014. Boston Consulting Group and the International Confederation of Private Employment Services (CIETT), Adapting to Change: How private employment services facilitate adaptation to change, better labour markets and decent work, 2014. Cognizant, The Robot and I: How New Digital Technologies Are Making Smart People and Businesses Smarter by Automating Rote Work, Cognizant Center for the Future of Work, 2015. Deloitte, Global Human Capital Trends 2015: Leading in the new world of work, 2015. — —, Global Human Capital Trends 2014: Engaging the 21st Century — Workforce, 2014. Department for Work and Pensions, “A New Vision for Older Workers: Retain, Retrain, Recruit”, report to Government by the Business Champion for Older Workers, United Kingdom, 2015. Everis, Preparing for the digitisation of the workforce, The Economist Intelligence Unit, 2015. Federal Ministry of Education and Research and the National Academy of Science and Engineering, Securing the future of German manufacturing industry: Recommendations for implementing the strategic initiative INDUSTRIE 4.0, final report of the Industrie 4.0 Working Group, 2013. Federal Ministry of Labour and Social Affairs, Arbeit Weiter Denken: Grünbuch Arbeiten 4.0, 2015 (in German). Freeman, R., “Who owns the robots rules the world: Workers can benefit from technology that substitutes robots or other machines for their work by owning part of the capital that replaces them”, IZA World of Labor, vol. 2014, no.
5, 2014. World Economic Forum Global Agenda Council on Ageing, How 21st-Century Longevity Can Create Markets and Drive Economic Growth, World Economic Forum Global Agenda Council White Paper, 2015. IMPLICATIONS FOR GENDER PARITY Graber, S., “It’s Not HR’s Job to Be Strategic”, HBR Blog Network, 2014. Black, S. and A. Spitz-Oener, “Explaining Women’s Success: Technological Change and the Skill Content of Women’s Work”, The Review of Economics and Statistics, vol.
92, no. 1, 2010, pp. 187-194. Gratton, L.
Adapting to the Future of HR: 3 Trends to Watch, Hot Spots Movement, 2015. Centre for Talent Innovation, Women Want Five Things, 2014. Deming, D., The Growing Importance of Social Skills in the Labor Market, NBER Working Paper 21473, National Bureau of Economic Research, 2015. Department for Business, Innovation and Skills, Women on Boards, 2011. 46 | The Future of Jobs Report Gvaramadze, I., “Low-skilled workers and adult vocational skills-upgrading strategies in Denmark and South Korea”, Journal of Vocational Education and Training, vol. 62, no. 1, 2010, pp.
51-61. ILO, A Skilled Workforce for Strong, Sustainable and Balanced Growth: A G20 Training Strategy; PART I: Global drivers of change: opportunities and challenges for training and skills development, 2010. . Janah, L., Labor looks different in the 21st century – so should job training”, Quartz, 2015, http://qz.com/496297/us-job-training-must-catch-up-tothe-work-the-labor-force-will-do. Jeon, S. “Enhancing Employment for Women, Youth and Older Workers: Why Skills Strategies Matter”, in, Global Talent Competitiveness Index 2014, edited by B. Lanvin and P. Evans, pp.
65–74, 2015. KPMG, Turn Silver Grey into Gold: Empowering Companies and Organisations to tackle the Ageing Workforce Challenge, 2011. Laurenceau, C. and C. Sloman, Being digital: Embrace the future of work and your people will embrace it with you, Accenture Strategy, 2015. World Economic Forum, Disrupting Unemployment: Business-led Solutions for Action, 2015. — —, Education and Skills 2.0: New Targets and Innovative Approaches, — 2014. — —, Industrial Internet: Unleashing the Business and Socioeconomic — Potential of Connected Products and Services, 2015. World Economic Forum and the Global Agenda Council on Employment, Matching Skills and Labour Market Needs: Building Social Partnerships for Better Skills and Better Jobs, 2014. Lindzon, J., “Welcome to the New Era of Human Resources – The Function of Human Resources Departments has Remained the Same for Over 100 Years.
That’s all About to Change”, FastCompany Magazine, 2015. Lippman, L., Ryberg, R., Carney, R. and K. Moore, Workforce Connections: Key “Soft Skills” that foster Youth Workforce Success: Toward a Consensus Across Fields, June 2015. Littler Mendelson, “The Transformation of the Workplace Through Robotics, Artificial Intelligence, and Automation: Employment and Labour Law Issues, Solutions, and the Legislative and Regulatory Response”, The Littler Report, 2014. ManpowerGroup, Seven Steps to Conscious Inclusion: A Practical Guide to Accelerating More Women Into Leadership, 2015. — —, Teachable Fit: A New Approach to Easing the Talent Mismatch, 2010, — http://www.manpowergroup.com/sustainability/teachable-fit-inside. html. McKinsey Global Institute, A Labor Market that Works: Connecting Talent with Opportunity in the Digital Age, 2015. — —, Building capabilities for performance, 2014. — Mercer, When Women Thrive, Businesses Thrive, 2014. NESTA, Building the Digital Talent Pipeline: The Business Benefits and How to Get Involved, 2015. North, M.
and H. Hershfield, “Four Ways to Adapt to an Aging Workforce”, Harvard Business Review, 2014. Oxford Economics, Global Talent 2021: How the new geography of talent will transform human resource strategies, 2012. Oxford Economics and SAP, Workforce 2020 – Research Report and Country Fact Sheets, 2014. Page, S., The Difference: How the Power of Diversity Creates Better Groups, Firms, Schools, and Societies, 2007. PwC, 17th Annual Global CEO Survey: The talent challenge, 2014. Ryder, G., “How can we create decent jobs in the digital age?”, Forum Agenda Blog, 2015. Shapiro, H., “Emerging Skills, Knowledge & Competencies for the HRST Workforce – Do Higher Education Systems Get It Right?”, contribution to the Innovation Union, DG Research, 2013. SHRM Foundation, “Engaging and Integrating a Global Workforce”, The Economist Intelligence Unit, 2015. Strack, R, J. Baier, and A.
Fahlander, “Managing Demographic Risk”, Harvard Business Review, 2008. The B Team and Virgin Unite, New Ways of Working, 2015. The Economist, Over the horizon: Three issues that should preoccupy managers in the next 50 years, 6 September 2014. The Economist Intelligence Unit, Working in The Future, research report sponsored by Fujitsu, 2015. Tyson, L. and L. Mendonca, “Worker Protection in the Gig Economy”, Project Syndicate, November 2015. UNI Global Union, Including You In a New World of Work: Background Paper, 2014. Unum, The Future Workplace: Key trends that will affect employee wellbeing and how to prepare for them today, 2014. Voss, E., “Organising Transitions in Response to Restructuring: Study on instruments and schemes of job and professional transition and re-conversion at national, sectoral or regional level in the EU”, Final Report, European Commission, 2009. West, D., What happens if robots take the jobs? The impact of emerging technologies on employment and public policy, Brookings Center for Technology Innovation, 2015. The Future of Jobs Report | 47 .
. Appendix A: Report Methodology RESEARCH FRAMEWORK AND SURVEY DESIGN The analysis that forms the basis of this Report is the result of an extensive survey of Chief Human Resources and Chief Strategy Officers of leading global employers, and consists of four interrelated parts, providing a uniquely flexible dataset that can be recombined in various ways to obtain further specific insights into relevant dimensions of interest (see Figure A1). The aim of our survey was to understand as comprehensively as possible expectations regarding the future of jobs, work and skills by the largest employers in some of the world’s biggest economies, in order to ultimately contribute to a more informed debate on these issues and provide an evidence base and guidance to businesses, governments and civil society organizations such as labour unions and education providers. As a starting point, we designed a survey targeted at heads of human resources departments, as well as chief strategy officers, as these are likely to hold the most detailed information on corporate policies and strategic workforce planning in light of current industry trends and disruptions. Our research framework has been informed by an extensive literature review on the various dimensions covered by the survey and by continuous consultation with leading experts from academia, international organizations, business and civil society through the World Economic Forum’s Global Agenda Council on the Future of Jobs and Global Agenda Council on Gender Parity, which served as partners and advisory bodies to the study. The survey collection process was carried out via online questionnaire in the first half of 2015, whereby the World Economic Forum’s Employment and Gender Challenge Initiative teams worked in close collaboration with Global Agenda Council Members, Global Challenge Partners and the Forum’s industry and regional teams to ensure a maximum number of responses from target companies. The World Economic Forum team, supported by Global Agenda Council Members, used the Hoovers and Bloomberg company databases to identify target companies and compile an extensive database of contact details of human resources department directors. For target companies for which we were not able to obtain contact information, Global Agenda Council Members carried out their own research to complete the database. Our pool of respondents comprised, as primary selection criterion, the 100 largest global employers in each target industry sector (as classified by the World Economic Forum; see Appendix B, Table B1), supplemented, as a secondary criterion, by the 50 largest national employers in each of our target countries (see target country list in Figure A1 : Survey Framework PART I Drivers of Change PART II Employment Trends PART III Skills Stability PART IV Workforce Strategy Appendix B, Table B2), if these were not already included as part of the first group.1 This approach was chosen in order to ensure sufficient geographic diversity and coverage to be able to provide balanced country-level as well as industrylevel results. Furthermore, a number of leading, fastgrowing small and medium-sized companies were identified qualitatively through the World Economic Forum network and included in the survey pool to account for significant future job creators and ‘disruptors.
In total, our target survey pool consisted of 2,450 companies. In various instances the largest employers in a country comprised the local units of well-known multinational enterprises, meaning that our survey approach entailed The Future of Jobs Report | 49 . obtaining results from these companies both at a global, headquarter-level and from one or more of their national operations. When looking at results through a country lens, this approach was considered the most appropriate given the importance of many of these large employers in their respective local labour markets. However, when looking at results through an industry lens, it was important to avoid skewing results by double counting responses from local units of the same company. We addressed this complexity through our survey design, by asking respondents to clearly associate all employment and occupation-related responses to a specific geography. In total, 371 individual companies responded to our survey over the first half of 2015, providing us with 1,346 unique data points around employment and occupations based in specific geographic locations across these companies’ global operations.
As outlined, the structure of our survey means that the sampling unit and base sample— the unique data points that can be used for most of our analysis—commonly refer to these 1,346 occupation-level responses; although in some cases, such as when looking at results through an overall industry lens, it is restricted to the 371 company-level responses to avoid double counting. In light of the above, companies were required to provide their name as well as the title and contact information of the person filling in the survey. Respondents were assured of strict confidentiality of their data at the level of individual company-level results. In addition, participating companies were given the option to be informed of their individual results relative to the range of responses in their country and/or industry. Our initial target list of countries comprised the three largest economies, by either GDP or population, in every world region.
In addition, through industry networks, the survey was carried out in companies based in other non-targeted countries. To ensure quality of results, only countries with a critical mass of responses have been included in the final Report. Our threshold for inclusion was a minimum of 30 unique data points per country.
Countries in our original target list for which we were unable to obtain a representative sample include Argentina, Colombia, Russian Federation, Republic of Korea, Egypt and Nigeria. In addition, due to an insufficient number of individual country-level responses, we have aggregated responses for a number of significant economies into two broader regional groupings: the Association of South East Asian Nations (ASEAN), combining results for Indonesia, Malaysia, Thailand and Singapore; and the Gulf Cooperation Council (GCC), combining results for Kuwait, Qatar, Saudi Arabia and the United Arab Emirates. The difficulty of obtaining responses from some geographies despite the dedicated work and support of Global Agenda Council Members and the Forum’s industry and regional teams appears to stem from a variety of causes, including sensitivity around the topic, concerns about confidentiality and business culture norms. There was near gender balance (54% female, 46% male) among the Chief Human Resources Officers and other senior executives who answered the survey. 50 | The Future of Jobs Report Interpretation of Results: Sample Coverage and Representativeness Overall, our survey sample represents more than 13 million employees across nine industry sectors (Financial Services & Investors; Information and Communication Technology; Energy; Basic and Infrastructure; Mobility; Consumer; Healthcare; Media, Entertainment and Information; and Professional Services) in 13 major developed and emerging economies (Australia, Brazil, China, France, Germany, India, Italy, Japan, Mexico, South Africa, Turkey, United Kingdom, United States) and two broader regional groupings, ASEAN (combining results for Indonesia, Malaysia, Singapore, Thailand) and the GCC (combining results for Kuwait, Qatar, Saudi Arabia, and the United Arab Emirates). In line with the Report’s overall aim of contributing to a more informed conversation on the future of jobs and providing guidance to businesses, governments and civil society organizations, the survey largely consisted of perception-based questions, with response options designed to focus on the key issues outcomes and trends as perceived by decision-makers. In addition there were a number of quantitative baseline questions. That is, our study is designed to reveal what the world’s leading employers think will happen, when they think it will happen, and what they propose to do about it.
While, between them, the expectations and corporate practices of the leading employers represented in our sample will significantly shape the future global employment landscape, it should be stated explicitly that our trend data hopes to be roughly right rather than precisely wrong. Similarly, in highlighting companies’ current thinking concerning intended change management and future workforce strategies, the Report aims to point to potential shortcomings and inconsistencies as a basis for further, more informed debate, rather than offering these as ready-made good practice solutions. In taking this perspective, the Report consciously focuses on actors with a key role in shaping the evolution of the global labour market. While only a minority of the world’s workforce is directly employed by large and emerging multinational employers such as the ones covered by our sample, these companies often act as anchors for smaller local firms, as suppliers within global value chains and as catalysts for the development of local entrepreneurship ecosystems.
In addition to their own significant share of employment, workforce-planning decisions by these firms therefore have the potential to transform local labour markets through indirect employment effects that set the pace for changing skills and occupational requirements. Similarly, the inclusion of medium-sized high-growth enterprises in our sample ensures representation of the category of companies generally considered the largest source of new net job creation in most economies.2 Nevertheless, given the Report’s aim of providing guidance and stimulating discussion, it is important to treat with caution the extent to which it is possible to generalize and extrapolate from our findings in a manner that could be considered representative of all trends across an entire industry or country. . Representativeness at the country level As a first important caveat, our survey only covers wage employment jobs in the formal economy, whereas the majority of the workforce in some developing countries may be based in agriculture or in the informal sector. According to the World Bank, roughly half of the world’s working population of more than 3 billion people are small farmers or self-employed in low productivity activities such as street vending, limiting our findings’ applicability in these contexts. It should be noted, however, that many informal sector jobs are also subject to dramatic change due to the same drivers of change, trends and disruptions affecting those based in large established firms. For example, the increasing ubiquity of mobile phones in developing countries has led to a mobile payments revolution, whereby a large range of informal sector transactions are now taking place via such platforms. Similarly, several technological trends hold out the promise of integrating an increasing number of informal sector workers into the global labour market in unprecedented ways, including by formally linking them to large established employers.3 A second consideration regarding representativeness of our results at the country level concerns the question of what percentage of the formal sector labour force is employed in large firms such as the ones in our sample. The available data suggests that, in general, fewer people in lower income countries are employed in large firms, limiting the generalizability of findings in these countries.4 In summary, the Report’s survey design seems wellsuited to the target countries studied, namely: developed economies and large emerging markets, with certain caveats on generalizability for the latter.
It seems less applicable for extrapolating results directly for developing economies not covered by the survey, although we believe our findings may provide valuable information for long-term human capital development strategies in these countries. More broadly, the Report focuses on two types of job categories in any particular country, rather than on the entirety of the national labour market as a whole: firstly, on mass employment jobs currently held by a large share of the labour force in that country; secondly, on strategic or specialist jobs that are critical to a company’s operations and may link the country to the worldwide network of international production and global value chains. The first category takes its significance from the number of employees directly affected; the second category provides an outlook primarily on high-skilled jobs, often including those with a particular bearing on opportunities and threats for the country’s positioning within the global economy. Representativeness at the industry level The main questions regarding representativeness of our findings at the industry level concern the extent to which the large employers in our sample are representative of a typical company in their industry sector as a whole, and, therefore, what percentage of the industry’s workforce is employed in companies such as the ones covered by our survey. Available data shows, for example, that there are systematic differences between larger and smaller firms with regard to the amount of in-house training and skills upgrading they are offering, so our analysis of future workforce strategies will be more applicable to industry sectors with a larger share of employment in large firms. Economic theory suggests that (in a competitive market, i.e. leaving aside monopolies, cartels and regulatory policies) firm size distribution in an industry is mostly the result of underlying structural factors—for example, some goods and services are naturally better produced in large firms; others, in smaller ones.5 A good approximation of the prevalence of employment in large firms in an industry is the degree of industry concentration, as measured by indicators such as the Herfindahl index6 and the concentration ratio7, which calculates the share in total industry output of the industry’s five largest firms.
Total output and gross value added in a number of industries—such as Energy, Mining and Metals, and Information and Communication Technology—are highly concentrated in a handful of large companies with tens of thousands of employees each. These large companies included in our sample account for a very large share of total employment in their industries. For some other industries, our sample population is more representative of the industry’s leading employers, rather than of the industry’s total workforce as a whole. Overall, because of the differences between large enterprises and small and medium-sized ones, especially when it comes to talent management and HR strategies, it is clear that our findings are mainly applicable to larger firms—the biggest employers in each industry in particular. A second consideration regarding representativeness of our results at the industry level concerns cross-country differences in public and private ownership. Our survey was designed to be applicable to workforces in both sectors. However, to date we have been able to obtain a critical mass of responses only from state-owned enterprises, not from public sector employers such as government departments.
This caveat affected our sample selection particularly in industry sectors such as healthcare and education, which are public in some countries and partly or wholly private in others, since business databases such as Hoovers and Bloomberg do not cover entities such as public hospitals. These are a major source of employment in many countries and are undergoing similar workforce challenges and transformations as private sector companies. Given sufficient interest from these constituents, we envisage a follow-up project to the present Report for public sector employees, covering not only the public sector but also civil society and international organisations as a distinct industry sector. Finally, a methodologically interesting question is the extent to which the identified trends and disruptions might themselves affect the validity of our conclusions regarding representativeness, for example by changing industry concentrations and structures through drivers of change such as 3D printing and sharing economy platforms.8 In general, while many of these trends point to a rise in importance of freelance work and contractors, evidence suggests that much of this work will continue The Future of Jobs Report | 51 .
Table A1: Definition of core work-related skills, based on the O*NET Content Model Skill/ability family Skill/ability Definition Cognitive Flexibility The ability to generate or use different sets of rules for combining or grouping things in different ways. Creativity The ability to come up with unusual or clever ideas about a given topic or situation, or to develop creative ways to solve a problem. Logical Reasoning The ability to combine pieces of information to form general rules or conclusions (includes finding a relationship among seemingly unrelated events) and/or to apply general rules to specific problems to produce answers that make sense. Problem Sensitivity The ability to tell when something is wrong or is likely to go wrong. It does not involve solving the problem, only recognizing there is a problem. Mathematical Reasoning The ability to choose the right mathematical methods or formulas to solve a problem. Visualization The ability to imagine how something will look after it is moved around or when its parts are moved or rearranged. Manual Dexterity and Precision The ability to make precisely coordinated movements to grasp, manipulate or assemble objects. Physical Strength The ability to exert maximum muscle force to lift, push, pull, or carry objects. Active Learning Understanding the implications of new information for both current and future problemsolving and decision-making. Oral Expression Talking to others to convey information effectively. Reading Comprehension Understanding written sentences and paragraphs in work-related documents. Written Expression Communicating effectively in writing as appropriate for the needs of the audience. ICT Literacy Using digital technology, communications tools, and networks to access, manage, integrate, evaluate and create information. Active Listening Giving full attention to what other people are saying, taking time to understand the points being made, asking questions as appropriate and not interrupting at inappropriate times. Critical Thinking Using logic and reasoning to identify the strengths and weaknesses of alternative solutions, conclusions or approaches to problems. Monitoring Self and Others Monitoring/assessing performance of yourself, other individuals or organizations to make improvements or take corrective action. ABILITIES Cognitive Abilities Physical Abilities BASIC SKILLS Content Skills Process Skills to be influenced by the workforce practices and sourcing decisions of large, established employers,9 validating the Report’s research framework. Classifying Occupations: ISCO and O*NET Given the Report’s major aim of bringing specificity to predictions about the future of jobs at the occupation level and moving beyond broad categorizations, we have based our analysis on a recognized reference system widely used by labour market researchers: a streamlined version of the Occupational Information Network (O*NET), developed by the US Department of Labor in collaboration with its Bureau of Labor Statistics’ Standard Classification of Occupations (SOC). In its unabridged form, the O*NET-SOC taxonomy includes detailed information on 974 individual occupations in the United States, grouped into approximately 20 broader job families, which are regularly revised and updated for new and emerging occupations to keep up 52 | The Future of Jobs Report with the changing occupational landscape. The virtually unparalleled level of descriptive detail of O*NET allows us to dive deep into the job profile of individual occupations and to supplement our analysis with a range of job-specific further information, compiled in collaboration with industry experts and HR practitioners. For example, in addition to a complete profile of the skills and abilities currently perceived as required to perform a job successfully, O*NET provides further detailed information such as common qualifying degrees or certifications, typical activities performed on-thejob and physical working conditions—nuances which have been used by researchers such as Frey and Osborne (2013) to predict the extent of upcoming job task automation and which enable us to directly link our findings to these bodies of research for further customized analysis going forward. O*NET also provides hard data on compensation, absolute employment numbers by occupation and their growth outlook to 2022 for the United States, which we .
Table A1: Definition of core work-related skills, based on the O*NET Content Model (cont’d.) Skill/ability family Skill/ability Definition CROSS-FUNCTIONAL SKILLS Complex Problem Solving Skills Complex Problem Solving Developed capacities used to solve novel, ill-defined problems in complex, real-world settings. Resource Management Skills Management of Financial Resources Determining how money will be spent to get the work done, and accounting for these expenditures. Management of Material Resources Obtaining and seeing to the appropriate use of equipment, facilities and materials needed to do certain work. People Management Motivating, developing and directing people as they work, identifying the best people for the job. Time Management Managing one's own time and the time of others. Coordinating with Others Adjusting actions in relation to others' actions. Emotional Intelligence Being aware of others' reactions and understanding why they react as they do. Negotiation Bringing others together and trying to reconcile differences. Persuasion Persuading others to change their minds or behaviour. Service Orientation Actively looking for ways to help people. Training and Teaching Others Teaching others how to do something. Judgement and Decision Making Considering the relative costs and benefits of potential actions to choose the most appropriate one. Systems Analysis Determining how a system should work and how changes in conditions, operations and the environment will affect outcomes. Equipment Maintenance and Repair Performing routine maintenance on equipment and determining when and what kind of maintenance is needed and/or repairing machines or systems using the needed tools. Equipment Operation and Control Watching gauges, dials or other indicators to make sure a machine is working properly; controlling operations of equipment or systems. Programming Writing computer programmes for various purposes. Quality Control Conducting tests and inspections of products, services or processes to evaluate quality or performance. Technology and User Experience Design Generating or adapting equipment and technology to serve user needs. Troubleshooting Determining causes of operating errors and deciding what to do about it. Social Skills Systems Skills Technical Skills used as one of several reference points to sense-check and calibrate our perception-based results. In addition, the O*NET-SOC taxonomy can be converted into corresponding occupations under the International Labour Organization’s International Standard Classification of Occupations (ISCO), allowing for internationalization of results.10 We have made use of this possibility, for example, when estimating the absolute number of employees by job family in the Report’s Country Profiles. Note that, due to differences in the two classification systems, an O*NET-ISCO harmonized list of occupations reduces to around 350 from O*NET’s original list of 974 occupations, and it is this streamlined list of occupations that we have used in practice in the survey and Report. Furthermore, respondents to the Future of Jobs Survey had the ability to self-specify additional occupations they considered of particular relevance if they did not find these reflected in pre-given response options. Finally, one implication of the structure of our survey questionnaire is that we have received an uneven number of responses per occupation—with, on the one hand, a strong convergence of data points around largest occupations in terms of employment and occupations perceived as critical/strategic for particular industries and, on the other hand, a relatively long tail of responses distributed across occupations with a lower number of individual mentions, affecting the reliability and margins of error of any individual predictions for the latter. In general, we address this by making use of O*NET’s two-level structure to report results aggregated at the broader job family level, not at the level of individual occupations. Employment Effects Estimated employment effects have been converted into compound growth rates for the 2015–2020 period, i.e.
the mean growth rate over the specified period of time if employment were to grow or decline at a steady The Future of Jobs Report | 53 . rate. The compound annual growth rate is essentially a representational figure that describes the rate at which a quantity would have grown if it had grown at a constant rate. The simplest limitation of a compound growth rate is that because it calculates the smooth average of growth over a period, it ignores volatility and implies that the growth during that time was steady, which is rarely the case. Reported employment outlook totals for job families have been weighted for the frequency of underlying occupation-level data points, using the standard weighted n arithmetic mean formula: ⌺wi,xi x = i=1 n ⌺wi i=1 on the simplifying assumption that more frequently mentioned occupations will also tend to employ a correspondingly larger absolute number of people in the concerned job family. It is possible to calculate the net absolute number of jobs expected to be created or lost in the job family whenever the underlying quantity of workers employed in the corresponding occupation is known for the country or industry. In practice, we have chosen only do this on an illustrative basis for our sample as a whole in order to keep the focus of our analysis firmly on the relative outlook for particular job types and job families compared to each other over the 2015–2020 period. Skills Stability Classifying skills The concept of skills is used in many different and sometimes ambiguous ways in different contexts and, unlike for occupations, a widely agreed shared definition or taxonomy of the term at the international level does not exist.11 In a general sense, the term skills is used to refer to the work-related capabilities of people to perform a job successfully.
It should be distinguished from the concept of abilities, which refers to more fundamental and enduring attributes of an individual, such as physical or cognitive abilities that are formed over a longer period, often beginning in early childhood education. In national and international statistics, achieved education levels or qualifications are often used as a proxy for or representation of skills. However, this approach is of limited use for the purposes of our Report and has been at the heart of conflicting perceptions about the current state of skills mismatches and the availability of qualified talent between education providers and employers. The education sector refers mainly to formal qualifications and credentials, whereas actors from the employment side refer to the actual practical capabilities or competences that employees (or new graduates) are able to use. Given the unprecedented rate of change of both on-the-job skills required to perform in an occupation successfully and of the content or hard knowledge of the core curriculum in many academic fields, we felt that the Report should adopt a taxonomy that would allow for the highest level of nuance, detail and specificity possible in order to adequately capture the pace of skill set disruption. 54 | The Future of Jobs Report Accordingly, the Report’s analysis of skills focuses on a core set of 35 specific and widely used work-relevant skills and abilities that have been empirically derived from today’s most-frequently cited skills and abilities across all occupations and job families in the O*NET database.
Our analysis found that the core skill set of most occupations consisted of a range of combinations of these 35 core skills. In addition, respondents to the Future of Jobs Survey had the possibility to self-specify further occupation-specific skills they considered essential if they did not already find these reflected in the pre-given response options. Table A1 shows the full list of work-related core skills and abilities that we have adapted from the O*NET database. A number of these skills have been manually combined, renamed or reclassified from their original designation within O*NET for concision and clarity.12 Calculating skills stability The Report repeatedly uses the concept of skills stability to illustrate the degree to which, by the year 2020, particular occupations and job types are expected to require competence in new skills that have hitherto not been part of that occupation’s core skill set today. The data points for this calculation are derived from our executive survey, in which respondents were twice asked to specify the top five skills most frequently used by their specified occupation: once for today, once for the year 2020. Respondents could select their answer from the 35 skills shown in Table A1, and also had the option to selfspecify skills requirements should they not be satisfied by the response options given.
The degree of skills stability refers to the share of skills mentioned both in today’s core skill set and re-mentioned as a core skill for the year 2020. Growing skills demand refers to skills only mentioned as part of occupations’ specified core skill set in 2020. Declining skills demand refers to skills only mentioned as part of today’s core skill set but not re-mentioned for 2020. The various skills stability measures used throughout the Report are the result of aggregating these data points for the unit of analysis in question, such as a job family or industry sector. As elsewhere, our approach represents a streamlining of the full O*NET taxonomy—which uses a longer list of skills—in order to make it amenable for use in an executive survey. In practice, limiting what we refer to as an occupation’s “core skillset” to the top five skills might mean certain skills that enter or drop out of the top five are merely experiencing a relative shift in importance, rather than being wholly new or ‘never used again thereafter’. However, even such relative shifts still strongly imply substantial ongoing change and transformation of skills requirements, convincing us of the soundness and validity of skills stability as a concept as used in the Report. .
NOTES 1 For example, the 50 largest national employers in the United States are all simultaneously part of the 100 largest employers in their respective industry globally, meaning that we did not supplement our survey pool with additional respondents from the United States. By contrast, few of South Africa’s largest national employers are part of the 100 largest employers in their industry globally; in this case, we supplemented our survey pool with additional large employers from South Africa, to ensure a representation of at least 50 South Africa based companies in the sample. 2 See, for example, Djordjevic, 2013. UK Office for National Statistics, Concentration ratios for businesses by industry in 2004, 2006, http://www.ons.gov.uk/ons/rel/elmr/economictrends--discontinued-/no--635--october-2006/concentration-ratiosfor-businesses-by-industry-in-2004.pdf. World Bank, Small vs. Young Firms across the World Contribution to Employment, Job Creation, and Growth, Policy Research Working Paper 5631, 2011. Zervas, G, D. Proserpio and J.
Byers, The Rise of the Sharing Economy: Estimating the Impact of Airbnb on the Hotel Industry, Working Paper, Boston University, 2015. 3 See, for example, McKinsey Global Institute, 2015. 4 World Bank, 2011. 5 Kumar, Rajan and Zingales, 2001. 6 http://en.wikipedia.org/wiki/Herfindahl_index. 7 http://en.wikipedia.org/wiki/Concentration_ratio. 8 See, for example, Zervas, Proserpio and Byers, 2015. 9 See, for example, Cappelli and Keller, 2013. 10 Official conversion tables are available at: www.bls.gov/soc/ISCO_ SOC_Crosswalk.xls. 11 See, for example: European Training Foundation, Anticipating and Matching Skills Demand and Supply: Synthesis of National Reports, 2012. 12 A full overview of O*NET’s complete skills taxonomy is available at: www.onetonline.org/skills/. METHODOLOGICAL REFERENCES International Standard Classification of Occupations (ISCO), International Labour Organization, http://www.ilo.org/public/english/bureau/stat/ isco/. The Occupational Information Network (O*NET), US Department of Labor, Employment and Training Administration, https://www.onetonline.org. Standard Occupational Classification (SOC), US Department of Labor, Bureau of Labor Statistics, http://www.bls.gov/soc/. O*NET-ISCO Conversion Tables, http://www.bls.gov/soc/ISCO_SOC_ Crosswalk.xls. Cappelli, P. and J. Keller, “Classifying Work in the New Economy”, Academy of Management, vol.
38, no. 4, 2013, pp. 575–596. Djordjevic, J., Why Becoming Large Matters: How Scalable, High-Growth Entrepreneurs Can Help Solve the Jobs Crisis, Endeavor Insight and Omidyar Network, 2013. European Centre for the Development of Vocational Training (CEDEFOP), Piloting a European Employer Survey on Skill Needs: Illustrative Findings, CEDEFOP Research Paper No.
36, 2013. — —, Quantifying Skills Needs in Europe – Occupational Skills Profiles: — Methodology and Application, CEDEFOP Research Paper No. 30, 2013. European Training Foundation, Anticipating and Matching Skills Demand and Supply: Synthesis of National Reports, 2012. Frey, C. and M.
Osborne, The Future of Employment: How Susceptible are Jobs to Computerisation?, Oxford Martin School Programme on the Impacts of Future Technology, 2013. ILO and GIZ, Is Small Still Beautiful? Literature Review of Recent Empirical Evidence on the Contribution of SMEs to Employment Creation, 2013. Kumar, K, R. Rajan and L. Zingales, What Determines Firm Size?, University of Chicago Graduate School of Business, Working Paper No.
496, 2001. McKinsey Global Institute, A Labor Market that Works: Connecting Talent with Opportunity in the Digital Age, 2015. National Center for O*NET Development, New and Emerging Occupations: Methodology Development Report, 2006. Pajarinen, M, P. Rouvinen and A. Ekeland, Computerization and the Future of Jobs in Norway, Discussion Paper, Research Institute of the Finnish Economy and Statistics Norway, 2015. The Future of Jobs Report | 55 .
. Appendix B: Industry and Regional Classifications Table B1: Classification of industries Industry Group Industry Sector Basic and Infrastructure Chemicals Infrastructure and Urban Development Mining and Metals Agriculture, Food and Beverage Consumer Retail, Consumer Goods and Lifestyle Energy Utilities and Technology Energy Oil and Gas Renewable Energy Financial Services & Investors Banking and Capital Markets Insurance and Asset Management Private Investors Institutional Investors, Sovereign Funds, Family Offices Healthcare Global Health and Healthcare Information and Communication Technology Information Technology Telecommunications Media, Entertainment and Information Media, Entertainment and Information Mobility Aviation and Travel Automotive Supply Chain and Transportation Professional Services Professional Services Table B2: Classification of regions ASIA AND THE PACIFIC EUROPE AND CENTRAL ASIA MIDDLE EAST AND NORTH AFRICA SUB-SAHARAN AFRICA THE AMERICAS ASEAN Australia China India Japan France Germany Italy Turkey United Kingdom Gulf Cooperation Council South Africa Brazil Mexico United States The Future of Jobs Report | 57 . . Part 2 Industry, Regional and Gender Gap Profiles . . User’s Guide: How to Read the Industry, Regional and Gender Gap Profiles Part II of the Report presents findings through an industry, regional and gender lens, with the aim of providing specific practical information to decision-makers and experts from academia, business, government and civil society. It provides deeper analysis of the overview of results in Part I through Industry Profiles, Country and Regional Profiles and Industry Gender Gap Profiles. In addition, the various Profiles are intended to provide interested companies with the opportunity to benchmark themselves relative to the range of expectations prevalent in their country and/or industry. This User’s Guide provides a detailed explanation of the information contained in the various Profiles and its appropriate interpretation. Industry Proï¬le Basic and Infrastructure Drivers of Change Workforce Disruption Top Trends Impacting Business Models Climate change, natural resources Changing nature of work, flexible work 46% New energy supplies and technologies 38% Geopolitical volatility 28% Middle class in emerging markets 15% Robotics, autonomous transport 15% Longevity, ageing societies 13% Rapid urbanization Industry Average 49% 13% STABLE 1 13% HARD HARDER Skills stability Current share of female workforce Ease of recruitment, current Ease of recruitment, 2020 Main Job Families Skills stability Current share of female workforce Ease of recruitment, current Ease of recruitment, 2020 Manufacturing and Production Assembly and Factory Workers Chemical Processing Plant Operators Expected change, 2015–2020 decline –1.84% 62% 9% hard harder Architecture and Engineering Chemical Engineers Civil Engineers stable 0.73% 59% 11% hard harder Construction and Extraction Mining and Petroleum Extraction Workers Construction Laborers decline –2.18% 72% 9% hard harder Management stable Business Services and Administration Managers 0.41% Manufacturing, Mining and Construction Managers 44% 11% hard harder Job families Expected Time to Impact on Employee Skills 2 Climate change, natural resources 58% Employment outlook 3 Changing nature of work, flexible work New energy supplies and technologies Expected Impact on Job Quality 42% 42% Impact 2015– felt already 2017 16% 2018– 2020 22% 2021– 2025 44% Impact 2015– felt already 2017 28% 6% 2018– 2020 40% 2021– 2025 46% Impact 2015– felt already 2017 7% 2018– 2020 2021– 2025 ⬆ ⬇ ⬆ Compensation Job security Work-life balance 7% INDUSTRY PROFILES Industry Proï¬le DRIVERS OF CHANGE The first section of each Industry Profile provides an overview of the top trends and disruptions expected to affect the industry in question over the coming years, as well as the timeframe within which these trends and disruptions are expected to require modification to the skill sets of key job functions within the industry. Basic and Infrastructure Skills Forecast Change Management and Future Workforce Planning Skills Change, Overall Industry Barriers Current 2020 Technical skills Insufï¬cient understanding of disruptive changes ...........................................
59% Social skills Resource constraints................................................................................... 54% Pressure from shareholders, short-term proï¬tability ...................................... 51% Cognitive abilities Workforce strategy not aligned to innovation strategy ...................................
38% Resource management skills Insufï¬cient priority by line management ....................................................... 30% Process skills Insufï¬cient priority by top management ........................................................ 27% Content skills Complex problem solving skills Systems skills Strategies Physical abilities Invest in re-skilling current employees 15 20 â– stable skills demand 25 30 41% 38% 35% Attract foreign talent 35% Collaborate, other companies in industry 10 65% Target female talent 5 â– growing skills demand Support mobility and job rotation Collaborate, educational institutions 0 19% â– declining skills demand Emerging Job Family in Focus: Business and Financial Operations Occupations Expected Time to Impact on Employee Skills The diagram illustrates the expected timeframe within which the top three mentioned trends or disruptions affecting business models in the industry in question are expected to require modification of skill sets of key job functions within the industry—either in order to equip employees with the skills needed to seize new business opportunities created by the trend or disruption or in order to avoid losing competitiveness due to the obsolescence of current employees’ existing skill sets.
Due to the different business models and different combinations of trends and disruptions prevalent in each industry, the same drivers of change may be felt differently in various industries. Key skills for 2020 Skills bundle Human Resources Specialists Top Trends Impacting Business Models The bar chart represents the share of survey respondents from the industry in question who selected the stated trend or disruption as one of the top three drivers of change affecting business models in their industry. For a detailed description of each driver of change, please see Table 2 in Part I of the Report. 53% believe future workforce planning is a leadership priority Problem Sensitivity Cognitive Abilities Offer apprenticeships 14% Accountants and Auditors Active Learning Content Skills Target minorities’ talent 14% Investment Fund Managers Critical Thinking Process Skills Management of Financial Resources Resource Management Skills Persuasion 36% are conï¬dent strategies are suitable Social Skills WORKFORCE DISRUPTION The second section of each Industry Profile aims to provide a consolidated overview of the major expected developments until the year 2020 for the industry’s workforce as a whole and within each main job family in the industry in question. Industry Average This section provides an aggregate summary of the relative outlook for all occupations and job functions mentioned by survey respondents from the industry in question. All reported averages are simple averages across the job families and functions mentioned, i.e.
results have not been weighted by the absolute number of workers employed in any given occupation. For a detailed explanation of each covered dimension, please see the next section, Main Job Families. The Future of Jobs Report | 61 . Main Job Families The table gives a detailed overview of expected developments in the four job families most frequently mentioned by survey respondents from the industry in question. Categorization of occupations and job families is based on the O*NET labour market information system (see Appendix A for details).1 All reported values are simple averages across mentioned occupations within the job family, i.e. results have not been weighted by the absolute number of employees in any given occupation. The individual occupations listed underneath each job family are for illustrative purposes and report the two occupations in the job family most frequently cited by survey respondents from the industry in question. The table covers the following dimensions: • Expected change, 2015–2020: The employment outlook for the job family, converted to a compound growth rate for the 2015–2020 period.
The thresholds for the qualitative scale are: +/–1%: “stable”; +/–1% to +/–5%: “growth / decline”; more than +/–5%: “strong growth / strong decline”. • Skills stability: The share of an occupation’s five most frequently used skills that have been identified as such by industry respondents both for today and for the year 2020, aggregated across all occupations mentioned for the job family. For a detailed description of each skill, please see Figure 9 and Table A1 in Part I of the Report. • Current share of female workforce: The reported share of current female employees for all occupations mentioned as part of the job family, aggregated as a simple average, i.e. not weighted by the absolute number of employees in any given occupation. • Ease of recruitment, current: The industry’s perceived current ease or difficulty of hiring competent and qualified employees for a given role, on a qualitative –2 (“very hard”) to +2 (“very easy”) scale, aggregated for the job family as a simple average, i.e.
not weighted by the absolute number of employees in any given occupation. The thresholds for the qualitative scale are: –2 to –1: “very hard”; –1 to –0.5: “hard”; –0.5 to +0.5: “neutral”; +0.5 to +1: “easy”; +1 to +2: “very easy”. • Ease of recruitment, 2020: The industry’s expected cumulative change in ease of recruitment over the 2015-2020 period, aggregated across roles for the job family as a simple average. The qualitative statement is relative to the previously reported current value. Expected Impact on Job Quality The arrows indicate the expected cumulative change in the three dimensions listed over the 2015–2020 period, as identified by survey respondents from the industry in question on a qualitative –2 (“strong decrease”) to +2 (“strong increase”) scale.
Reported values are simple 62 | The Future of Jobs Report averages across all job families mentioned for the industry and have not been weighted by the absolute number of workers employed in any given occupation. The three dimensions listed are based on a conceptual framework of job quality under development by the Organisation for Economic Co-operation and Development (OECD).2 • Compensation: The extent to which employment contributes to material living standards. • Job security: The risk of job loss and its consequences. • Work-life balance: The nature and content of work performed, working-time arrangements and workplace relationships. SKILLS FORECAST The third section provides an outlook on the expected evolution of skills demand over the 2015–2020 period. It looks at skills requirements both from an overall industry perspective as well as from the perspective of key skills that will be in demand as part of important new and emerging jobs in the sector.
Categorization of skills is based on the O*NET labour market information system. For a detailed description of each skill, please see Figure 9 and Table A1 in Part I of the Report. Skills Change, Overall Industry The stacked bar chart is a diagrammatic representation of overall demand for the industry’s most frequently used skills across all occupations and job families over the 2015– 2020 period. The stacked bars are ordered by the overall magnitude of demand for the category of skills indicated and add up to 100%—the industry’s total skills demand profile.
The dark blue part of the stacked bars represents the share of skills from the given category for which demand is expected to remain stable. The grey part of the stacked bar represents the share of skills from the given category which is in demand today but for which demand will be on the decline by the year 2020. The bright blue part of the bar represents the share of skills from the given category that is anticipated to be in demand by the year 2020, even though this demand has not yet fully materialized today. Accordingly, the dark blue and grey parts of the bar chart combined represent the industry’s current overall skills demand profile while the bright blue and dark blue parts of the bar chart combined represent overall skills demand in the industry as expected for the year 2020.
Comparing the contours of the two demand profiles and the relative change in length of the various bars provides a visual overview of skills change in the industry. Emerging Job Family in Focus This part of the Industry Profile dives deep into the job family that corresponds to the occupations most frequently mentioned as new and emerging by survey respondents from the industry in question. The left-hand side of the table lists the top-mentioned emerging occupations expected to . become increasingly influential in the industry by the year 2020. The right-hand side of the table lists the individual skills expected to be in demand as part of skills profile of these occupations and their corresponding skills family. Categorization of occupations and skills is based on the O*NET labour market information system. Country Proï¬le Australia Workforce Disruption Sample Overview Main Industries Employment Outlook by Main Job Family CURRENT Current workforce (thousands) 2020 Employment outlook, 2015–2020 Local share of recruitment, specialists Ease of recruitment, overall Local share of recruitment, specialists Ease of recruitment, overall Professional Services stable 0.91% 76–100% hard 51–75% harder Basic and Infrastructure decline –1.67% — easy — neutral Energy growth 76–100% hard 76–100% harder Information and Communication Technology growth 3.57% 76–100% hard 76–100% harder Industry Industries 1,452 Sales and Related 962 Occupation types Mass Employment Petroleum and Natural Gas Reï¬ning Plant Operators Strategic/Specialist Sales Representatives, Wholesale and Technical Products 9% 13% 43% 35% Up to 500 500– 5,000 5,000– 50,000 More than 50,000 New and Emerging Robotics Engineers Country/region neutral Sample average hard Country/region Construction and Extraction Installation and Maintenance 457 Farming, Fishing and Forestry 455 2020 Computer, Mathematical and Science 458 CURRENT Manufacturing and Production 593 Ease of Recruitment Business, Legal and Financial 683 550 Number of Employees Transportation and Logistics 685 â– Professional Services .........................................27% â– Basic and Infrastructure .....................................26% â– Energy ..............................................................22% â– Information and Communication Technology........16% â– Others.................................................................9% Ofï¬ce and Administrative 897 3.57% CHANGE MANAGEMENT AND FUTURE WORKFORCE PLANNING The final section of each Industry Profile focuses on the measures and strategies for adapting to the top trends and disruptions expected to affect the industry in question over the coming years that companies intend to undertake, as well as the biggest perceived barriers to successfully carrying out these measures and the perceived degree of preparedness prevalent across the industry. Management 1,052 Education and Training Sample average harder neutral Arts, Design, Entertainment, Sports, and Media 416 hard hard harder harder — — hard hard Architecture and Engineering 386 N/A Growing Declining Stable Not shown: Social and Protective Services (782), Healthcare Practitioners (343), Hospitality and Food Related (634), Personal Care and Service (761) Country Proï¬le Barriers The table lists the biggest perceived barriers to preparing the industry’s workforce for disruptive change, as measured by the share of survey respondents from the industry in question who selected the stated obstacle as one of the top three impediments to successful workforce change management faced by their industry. For a detailed discussion of each barrier, please refer to Part I of the Report. To the right of the table is the percentage of respondents who believe that future workforce planning to prepare for disruptive change is either a “somewhat high” or “very high” priority for their organization’s senior leadership. Strategies The bar chart represents the share of survey respondents from the industry in question who selected the stated measure as one of the top three future workforce and change management strategies they expect to undertake in their company.
For a detailed discussion of each measure, please refer to Part I of the Report. To the right of the table is the percentage of respondents from the industry who stated that they were either “somewhat confident” or “highly confident” in the adequacy of the selected strategies. COUNTRY AND REGIONAL PROFILES SAMPLE OVERVIEW The first section of each Country or Regional Profile contextualizes the information presented according to the industry and company size mix of received responses. Overall representativeness of country-level findings should be understood according to the primary country, industry sector(s) and/or company size segments of interest. In addition to 13 Country Profiles, there are two Regional Profiles—ASEAN and GCC. WORKFORCE DISRUPTION The second section of each Country and Regional Profile aims to provide a consolidated overview of the major expected developments over the 2015–2020 period for the Australia Drivers of Change Change Management and Future Workforce Planning Top Trends Impacting Industries Changing nature of work, flexible work Climate change, natural resources 38% New energy supplies and technologies 38% Mobile internet, cloud technology 29% Processing power, Big Data 24% Geopolitical volatility 24% Sharing economy, crowdsourcing 19% Women’s economic power, aspirations Barriers 52% 14% Resource constraints..........................................................................
93% Pressure from shareholders, short-term proï¬tability ............................. 71% Workforce strategy not aligned to innovation strategy .......................... 57% Insufï¬cient understanding of disruptive changes ..................................
57% Insufï¬cient priority by top management ............................................... 57% 45% believe future workforce planning is a leadership priority Strategies Invest in re-skilling current employees 60% 2015– 2017 2018– 2020 33% Collaborate, other companies across industries 28% Target minorities’ talent 22% Collaborate, other companies in industry 22% Collaborate, educational institutions 17% Attract foreign talent 40% Impact already felt 33% Target female talent Expected Impact on Employment Outlook: Neutral 61% Support mobility and job rotation Disruption in Focus: Changing Nature of Work, Flexible Work Expected Time to Impact on Employee Skills 6% 55% are conï¬dent strategies are suitable 2021– 2025 country’s workforce as a whole across key industries, job types and job families. Main Industries The table gives a detailed overview of changes in the employment landscape across key industries in the country covered by survey respondents. Reported values are a simple average of all responses received for the industry. The table covers the following dimensions: • Employment outlook, 2015–2020: The expected employment change for the industry, across all job families, converted to a compound growth rate for the 2015–2020 period.
The thresholds for the qualitative scale are: +/–1%: “stable”; +/–1% to +/–5%: “growth / decline”; more than +/–5%: “strong growth / strong decline”. • Local share of recruitment, specialists: The current and expected share of strategic and specialist job functions anticipated by respondents from the corresponding industry to be recruited locally in the country. On the one hand, a very low local recruitment share may indicate skills shortages and a very high reliance on expatriate talent that might present an opportunity for the country to build up its talent pool in a targeted manner. On the other hand, a very high local recruitment share might indicate underutilized The Future of Jobs Report | 63 .
opportunities to diversify experience and increase knowledge transfer to the local workforce from international experts. • Ease of recruitment, overall: The current and expected ease or difficulty of hiring competent and qualified employees across all roles in the industry specified, on a qualitative –2 (“very hard”) to +2 (“very easy”) scale, aggregated for the entire industry in question as a simple average, i.e. not weighted by the absolute number of employees in any given occupation. The thresholds for the qualitative scale are: –2 to –1: “very hard”; –1 to –0.5: “hard”; –0.5 to +0.5: “neutral”; +0.5 to +1: “easy”; +1 to +2: “very easy”. The qualitative scale for “2020” is relative to the current values reported. Ease of Recruitment The table in this section gives a detailed overview of the perceived current and future aggregate ease of recruitment for occupations across three types of jobs: Mass Employment, Strategic/Specialist and New and Emerging. The individual occupations listed underneath each job type are for illustrative purposes and report the occupations most frequently cited by survey respondents across all industries in the country.
Categorization of occupations and job families is based on the O*NET labour market information system. The thresholds for the qualitative ease of recruitment scale are the same as for the table above. Values are reported both for the country or region in question as well as for the global sample average, indicating job types in which the country or region may have a comparative advantage as well as those in which recruitment is expected to be more difficult than the world average. Employment Outlook by Main Job Family The bubble chart visualizes estimated total employment in different job families in the country.
The colour of the bubbles indicates the job family’s aggregate employment outlook on the following scale: +/–1%: “Stable”; more than +/–1%: “Growing / Declining”. Insufficient response data available for job families is labelled “N/A”. Estimated total employment by job family is derived from ILOSTAT data, classified according to the International Standard Classification of Occupations (ISCO) and converted to corresponding O*NET job families using the O*NET-SOC taxonomy’s official conversion tables (please see Appendix A for details).
No internationally comparable data was available for China and India. Estimates for ASEAN are based on Malaysia, Thailand and Vietnam, and estimates for GCC are based on Saudi Arabia only. Due to the nature of our employment survey and its target audience of large multinational employers, insufficient response data for robust predictions was generally available for the four job families not shown. 64 | The Future of Jobs Report DRIVERS OF CHANGE The third section of each Country and Regional Profile provides an overview of the top trends and disruptions expected to affect industries in the country in question over the coming years and an in-depth look at the top-mentioned trend or disruption across all industries. Top Trends Impacting Industries The bar chart represents the share of survey respondents across industries located in the country or region in question who selected the stated trend or disruption as one of the top three drivers of change affecting business models in their industry.
For a detailed description of each driver of change, please see Table 2 in Part I of the Report. Disruption in Focus This section dives deep into the top-mentioned trend or disruption across industries in the country or region in question. The diagram illustrates the expected time frame within which it is expected to require modification of skill sets of key job types in the country or region— either in order to equip the country’s workforce with the skills needed to seize new opportunities created by the trend or disruption in question or in order to avoid losing competitiveness due to the obsolescence of the workforce’s existing skill sets. The section also reports the trend’s or disruption’s expected overall impact on employment outlook in the country or region. CHANGE MANAGEMENT AND FUTURE WORKFORCE PLANNING The final section of each Country and Regional Profile focuses on the measures and strategies for adapting to the anticipated top trends and disruptions that companies across industries located in the country or region in question intend to undertake, as well as the biggest perceived barriers to successfully carrying out these measures and the perceived degree of preparedness prevalent across industries in the country or region. Barriers The table lists the biggest perceived barriers to preparing the country’s or region’s workforce for disruptive change, as measured by the share of companies across industries located in the country or region in question who selected the stated obstacle as one of the top three impediments to successful workforce change management faced by their industry.
For a detailed discussion of each barrier, please refer to Part I of the Report. To the right of the table is the percentage of respondents who believe that future workforce planning to prepare for disruptive change is either a “somewhat high” or “very high” priority for their organization’s senior leadership. . Strategies The bar chart represents the share of survey respondents across industries located in the country or region in question who selected the stated measure as one of the top three future workforce and change management strategies they expect to undertake in their company. For a detailed discussion of each measure, please refer to Part I of the Report. To the right of the table is the percentage of respondents who stated that they were either “somewhat confident” or “highly confident” in the adequacy of the selected strategies. Industry Gender Gap Proï¬le Basic and Infrastructure Composition by Role and Level Workforce Disruption, 2015–2020 Percentage of Women Industry Average STABLE 58% 13% 35% HARDER NEUTRAL Employment outlook Skills stability Current share of women Gender wage gap Relative ease of recruitment, current Relative ease of recruitment, 2020 2% Current share of women Gender wage gap Relative ease of recruiting women, current 62% 9% 42% much harder 11% 19% harder neutral decline –2.18% 72% 9% 38% much harder harder stable 0.41% 44% 11% 64% harder neutral Skills stability decline –1.84% stable 0.73% Manufacturing and Production Assembly and Factory Workers Board Members harder 59% Employment outlook Job families 35% CEOs Main Job Families Relative ease of recruiting women, 2020 Chemical Processing Plant Operators Architecture and Engineering Chemical Engineers Current Expected in 2020 Civil Engineers Construction and Extraction Mining and Petroleum Extraction Workers Construction Laborers Management Business Services and Administration Managers 22% 13% 9% 29% 21% 17% Junior level Manufacturing, Mining and Construction Managers Middle level Senior level Junior level Middle level Senior level Job Family in Focus: Management Job family with largest share of women ⬆ ⬇ ⬆ 14% 20% 23% 27% Compensation Job security Work-life balance Line roles Staff roles Line roles Staff roles INDUSTRY GENDER GAP PROFILES WORKFORCE DISRUPTION, 2015–2020 The first section of each Industry Gender Gap Profile aims to provide a consolidated overview of the major expected developments over the coming years for each of the industry’s main job families and its workforce as a whole, with a particular focus on their implications for the evolution of the gender gap in the industry in question. Industry Gender Gap Proï¬le Basic and Infrastructure Companies’ Rationales for Gender Parity Companies’ Approaches to Leveraging Female Talent Fairness and equality 39% Barriers Enhance innovation 33% Unconscious bias among managers ............................................................. 50% External pressuresreputation 28% Lack of role models ....................................................................................
44% Government regulation 22% Lack of work-life balance ............................................................................ 42% Enhance decision-making 19% Lack of qualiï¬ed incoming talent ................................................................. 33% No rationale 17% Reflect gender composition of customer base 14% 10% Industry Average This section provides an aggregate summary of the relative outlook for all occupations and job functions mentioned by survey respondents from the industry in question.
All reported averages are simple averages across the job families and functions mentioned, i.e. results have not been weighted by the absolute number of workers employed in any given occupation. For a detailed explanation of each covered dimension, please see the next section, Main Job Families. Main Job Families The table gives a detailed overview of expected developments in the four job families most frequently mentioned by survey respondents from the industry in question.
Categorization of occupations and job families is based on the O*NET labour market information system. All reported values are simple averages across mentioned occupations within the job family, i.e. results have not been weighted by the absolute number of employees in any given occupation. The individual occupations listed underneath each job family are for illustrative purposes and report the two occupations in the job family most frequently cited by survey respondents from the industry in question. The table covers the following dimensions: • Employment outlook: The expected employment change for the job family, converted to a compound growth rate for the 2015–2020 period.
The thresholds for the qualitative scale are: +/–1%: “stable”; +/–1% to +/–5%: “growth / decline”; more than +/–5%: “strong growth / strong decline”. Perceive women’s economic power, aspirations as a driver of change Unclear career paths ................................................................................... 31% Women’s conï¬dence, aspirations ................................................................. 28% 35% Perceive attracting female talent as a key future workforce strategy 35% Perceive a gender wage gap for equally qualiï¬ed employees in the same role Strategies Set targets and measure progress 46% Build awareness of the beneï¬ts among managers 41% Development and leadership training of women 26% 30% Current 2020 Business-to-consumer 21% of total customers 18% 24% Current 24% No strategy 28% 2020 27% Offer, support flexible work 16% 32% Demonstrate leadership commitment Current 35% Promote work-life balance Female Share of Customer Base Business-to-business 58% of total customers 50% believe that gender parity is a leadership priority 22% Don’t know 58% 19% are conï¬dent strategies are suitable 2020 Business-to-government 20% of total customers • Skills stability: The share of an occupation’s five most frequently used skills that have been identified as such by industry respondents both for today and for the year 2020, aggregated across all occupations mentioned for the job family.
For a detailed description of each skill, please see Figure 9 and Table A1 in Part I of the Report. • Current share of women: The reported share of current female employees for all occupations mentioned as part of the job family, aggregated as a simple average, i.e. not weighted by the absolute number of employees in any given occupation. • Gender wage gap: The share of survey respondents from the industry in question who stated that there was a wage gap for equally qualified female employees in the same roles for the reported job family. Results have been aggregated as a simple average, i.e.
not weighted by the absolute number of employees in any given occupation. • Relative ease of recruiting women, current: The industry’s perceived current ease or difficulty of hiring competent and qualified female talent for a given role, relative to the perceived current ease or difficulty of hiring men, on a qualitative –2 (“much harder”) to +2 (“much easier”) scale, aggregated for the job family The Future of Jobs Report | 65 . as a simple average, i.e. not weighted by the absolute number of employees in any given occupation. The thresholds for the qualitative scale are: –2 to –1: “much harder”; –1 to –0.5: “harder”; –0.5 to +0.5: “neutral”; +0.5 to +1: “easier”; +1 to +2: “much easier”. • Relative ease of recruiting women, 2020: The industry’s expected future ease or difficulty of hiring competent and qualified female talent for a given role by the year 2020, relative to the expected future ease or difficulty of hiring men, aggregated across roles for the job family as a simple average. Job Family in Focus This part of the Industry Gender Gap Profile dives deep into the job quality of the industry’s job family that has the largest share of women. The arrows indicate the expected cumulative change in the three dimensions listed over the 2015–2020 period, as identified by survey respondents from the industry in question on a qualitative –2 (“strong decrease”) to +2 (“strong increase”) scale.
The three dimensions listed are based on a conceptual framework of job quality under development by the Organisation for Economic Co-operation and Development (OECD). • Compensation: The extent to which employment contributes to material living standards. • Job security: The risk of job loss and its consequences. • Work-life balance: The nature and content of work performed, working-time arrangements and workplace relationships. A comparison can be made with the industry’s overall job quality trends, as reported in the Industry Profile. COMPOSITION BY ROLE AND LEVEL The second section of the Industry Gender Gap Profile provides an overview of the size of the workforce gender gap in the industry today and its expected evolution by the year 2020. The first part of the section reports the current share of female CEOs and Board Members in the industry today. The second part of the section documents reported current and estimated future female representation at junior, middle and senior levels. Somewhat simplified, the bar chart can be understood as a talent pipeline, whereby the share of today’s junior level female talent partially translates to 2020’s share of mid-level talent and today’s mid-level female talent partially translates to 2020’s senior level talent. Large upward or downward divergences from this pattern indicate either expected leakages of female talent leaving the industry or the materialized benefits of intensified promotion, retention and external recruitment efforts.
Similarly, the difference between the share of female talent in 2020’s junior level cohort relative to the industry’s current junior 66 | The Future of Jobs Report level cohort provides a sense of the anticipated longer term evolution of the gender gap beyond 2020. The final part of the section documents reported current and estimated future female representation across line roles and staff roles. A line role is one that directly advances an organization in its core work, including, in particular, the production and sales functions. A staff role supports the organization with advisory and support functions, typically including human resources, accounting, public relations and legal roles.
Line managers generally have supervisory authority over those who report directly to them, whereas staff workers’ primary responsibility consists in creating, collecting and analysing information that flows to line workers in the form of advice. Experience in line management functions is generally considered a stepping stone to senior leadership roles within an organization and gender gaps in these roles have historically been especially pronounced. Conversely, certain staff functions, such as human resources, have historically experienced a reverse gender gap. COMPANIES’ RATIONALES FOR GENDER PARITY The bar chart represents the share of survey respondents from the industry in question who selected the stated rationale as one of the top three motivations for promoting gender parity in their company.
For a detailed discussion of each rationale, please refer to Part I of the Report. This section of each Industry Gender Gap Profile also reports the share of survey respondents from the industry in question who perceived women’s rising economic influence as one of the top three drivers of change affecting business models in their industry, who perceived attracting female talent as one of their company’s top three future workforce strategies, and who reported a gender wage gap for equally qualified employees across key roles in their industry. FEMALE SHARE OF CUSTOMER BASE The fourth section of each Industry Gender Gap Profile further examines two of the key economic driving forces and rationales behind companies’ growing commitment to women’s workforce integration: The rising economic power of women as consumers and companies’ desire to reflect their customer base in their workforce composition. Globally, women in 2013 controlled 64% of household spending and $30 trillion of consumer spending—a figure that is is predicted to rise by almost a third over the five years to 2018.3 The three bar charts in this section represent the reported current and expected future share of female clients across business-to-business, business-to-consumer and business-to-government market segments, including situations in which women are ultimately responsible for purchasing decisions, for example, as procurement managers, etc. The share of the corresponding market segment in the industry’s current overall revenue structure is reported at the bottom of each bar chart—providing further information about the dynamics through which trends and disruptions are affecting business models in the industry. Note that the customer base of the three market segments .
may not sum to 100% exactly in all instances due to omitted other market segments (for example, non-governmental organizations). COMPANIES’ APPROACHES TO LEVERAGING FEMALE TALENT The final section of each Industry Gender Gap Profile focuses on the measures and strategies for harnessing female talent and promoting workplace gender parity that companies intend to undertake, as well as the biggest perceived barriers to successfully carrying out these measures and the perceived degree of urgency and determination to tackle these issues prevalent across the industry in question. Barriers The table lists the biggest perceived barriers to promoting workplace gender parity and leveraging female talent, as measured by the share of survey respondents from the industry in question who selected the stated obstacle as one of the top three impediments faced by women in their industry. For a detailed discussion of each barrier, please refer to Part I of the Report. To the right of the table is the percentage of respondents who believe that tackling gender parity issues and closing the industry gender gap is either a “somewhat high” or “very high” priority for their organization’s senior leadership. Strategies The bar chart represents the share of survey respondents from the industry in question who selected the stated measure as one of the top three strategies for promoting workplace gender parity they expect to undertake in their company. For a detailed discussion of each measure, please refer to Part I of the Report.
To the right of the table is the percentage of respondents from the industry who stated that they were either “somewhat confident” or “highly confident” in the adequacy of the selected strategies. NOTES 1 www.onetonline.org. 2 Organisation for Economic Co-operation and Development (OECD), Job Quality, Directorate for Employment, Labour and Social Affairs – Employment, Labour and Social Affairs Committee, 16-17 October 2014. 3 See: Catalyst, Buying Power: Global Women, 2015, www.catalyst.org/ knowledge/buying-power-global-women; Silverstein, M. and K. Sayre, “The Female Economy”, Harvard Business Review, September 2009. The Future of Jobs Report | 67 .
68 | The Future of Jobs Report . List of Industry, Regional and Gender Gap Profiles Industry Profiles Industry Country and Regional Profiles Page Industry Industry Gender Gap Profiles Page Industry Page Basic and Infrastructure 72 Association of South East Asian Nations 92 Basic and Infrastructure 124 Consumer 74 Australia 94 Consumer 126 Energy 76 Brazil 96 Energy 128 Financial Services & Investors 78 China 98 Financial Services & Investors 130 Healthcare 80 France 100 Healthcare 132 Information and Communication Technology 82 Germany 102 Information and Communication Technology 134 Media, Entertainment and Information 84 Gulf Cooperation Council 104 Media, Entertainment and Information 136 Mobility 86 India 106 Mobility 138 Professional Services 88 Italy 108 Professional Services 140 Japan 110 Mexico 112 South Africa 114 Turkey 116 United Kingdom 118 United States 120 The Future of Jobs Report | 69 . . Industry Profiles . 72 | The Future of Jobs Report Industry Profile Basic and Infrastructure Drivers of Change Workforce Disruption Top Trends Impacting Business Models Industry Average Climate change, natural resources 49% Changing nature of work, flexible work 46% New energy supplies and technologies 38% Geopolitical volatility 28% Middle class in emerging markets 15% Robotics, autonomous transport 15% Longevity, ageing societies 13% Rapid urbanization 13% STABLE 1 2 13% HARD HARDER Employment outlook Skills stability Current share of female workforce Ease of recruitment, current Ease of recruitment, 2020 Main Job Families Expected change, 2015–2020 Job families 42% 42% 16% 2018– 2018– 2020 2020 Ease of recruitment, current Ease of recruitment, 2020 3 9% hard harder stable 0.73% 59% 11% hard harder Construction and Extraction Mining and Petroleum Extraction Workers Construction Laborers decline –2.18% 72% 9% hard harder Management stable Business Services and Administration Managers 0.41% Manufacturing, Mining and Construction Managers New energy supplies and technologies 62% Architecture and Engineering Chemical Engineers Civil Engineers Changing nature of work, flexible work 22% 2021– 2021– 2025 2025 Current share of female workforce decline –1.84% 44% 11% hard harder Expected Impact on Job Quality Impact 2015– Impact 2015– felt already 2017 felt already 2017 Skills stability Manufacturing and Production Assembly and Factory Workers Chemical Processing Plant Operators Expected Time to Impact on Employee Skills Climate change, natural resources 58% 44% Impact 2015– Impact 2015– felt already 2017 felt already 2017 28% 6% 2018– 2018– 2020 2020 2021– 2021– 2025 2025 40% 46% Impact 2015– Impact 2015– felt already 2017 felt already 2017 7% 7% 2018– 2018– 2020 2020 2021– 2021– 2025 2025 ⬆ Compensation ⬇ Job security ⬆ Work-life balance . Industry Profile Basic and Infrastructure Skills Forecast Change Management and Future Workforce Planning Skills Change, Overall Industry Barriers Current 2020 Technical skills Insufficient understanding of disruptive changes............................................ 59% Social skills Resource constraints.................................................................................... 54% Pressure from shareholders, short-term profitability....................................... 51% Cognitive abilities Workforce strategy not aligned to innovation strategy....................................
38% Resource management skills Insufficient priority by line management........................................................ 30% Process skills 53% believe future workforce planning is a leadership priority Insufficient priority by top management......................................................... 27% Content skills Complex problem solving skills Systems skills Strategies Invest in reskilling current employees 0.10 10 n growing skills demand 0.15 15 0.20 20 n stable skills demand 0.25 25 0.30 30 41% 38% 35% Attract foreign talent 35% Collaborate, other companies in industry 0.05 5 Support mobility and job rotation Target female talent 0.00 0 65% Collaborate, educational institutions Physical abilities 19% n declining skills demand Emerging Job Family in Focus: Business and Financial Operations Occupations Key skills for 2020 Skills family Human Resources Specialists Problem Sensitivity Cognitive Abilities Offer apprenticeships 14% Accountants and Auditors Active Learning Content Skills Target minorities’ talent 14% Investment Fund Managers Critical Thinking Process Skills Management of Financial Resources Resource Management Skills Persuasion Social Skills 73 | The Future of Jobs Report 36% are confident strategies are suitable .
74 | The Future of Jobs Report Industry Profile Consumer Drivers of Change Workforce Disruption Top Trends Impacting Business Models Industry Average Changing nature of work, flexible work 42% Middle class in emerging markets 42% Geopolitical volatility 25% Climate change, natural resources 21% New energy supplies and technologies 21% Women’s economic power, aspirations 21% Consumer ethics, privacy issues 21% Longevity, ageing societies 17% STABLE 1 2 27% HARD HARDER Employment outlook Skills stability Current share of female workforce Ease of recruitment, current Ease of recruitment, 2020 Main Job Families Expected change, 2015–2020 Skills stability Current share of female workforce Ease of recruitment, current Ease of recruitment, 2020 Manufacturing and Production decline Assembly and Factory Workers –3.57% Food Processing and Related Trades Workers 62% 22% neutral harder Sales and Related stable Shop Salespersons 0.83% Sales Representatives, Wholesale and Technical 78% 52% hard harder Business and Financial Operations Sales and Marketing Professionals Management and Organisation Analysts stable –0.88% 67% 44% hard harder Management decline General and Operations Managers –1.00% Business Services and Administration Managers 70% 22% hard neutral Job families Expected Time to Impact on Employee Skills Changing nature of work, flexible work 70% Middle class in emerging markets 3 Geopolitical volatility Expected Impact on Job Quality 30% 40% Impact 2015– Impact 2015– felt already 2017 felt already 2017 30% 2018– 2018– 2020 2020 40% 2021– 2021– 2025 2025 30% Impact 2015– Impact 2015– felt already 2017 felt already 2017 30% 2018– 2018– 2020 2020 33% 2021– 2021– 2025 2025 50% Impact 2015– Impact 2015– felt already 2017 felt already 2017 17% 2018– 2018– 2020 2020 2021– 2021– 2025 2025 ⬆ Compensation ⬇ Job security ⬌ Work-life balance . Industry Profile Consumer Skills Forecast Change Management and Future Workforce Planning Skills Change, Overall Industry Current 2020 Barriers Social skills Insufficient understanding of disruptive changes............................................ 60% Cognitive abilities Resource constraints.................................................................................... 55% Resource management skills Pressure from shareholders, short-term profitability....................................... 50% Technical skills Workforce strategy not aligned to innovation strategy....................................
50% Insufficient priority by top management......................................................... 20% Process skills 70% believe future workforce planning is a leadership priority No barriers.................................................................................................. 15% Systems skills Content skills Complex problem solving skills Strategies Physical abilities Invest in reskilling current employees 75% Support mobility and job rotation 45% Offer apprenticeships 35% Collaborate, educational institutions 30% Target female talent 25% Attract foreign talent 25% Collaborate, other companies across industries 20% Hire more short-term workers 20% 0.00 0 0.05 5 0.10 10 n growing skills demand 0.15 15 0.20 20 n stable skills demand 0.25 25 n declining skills demand Emerging Job Family in Focus: Architecture and Engineering Occupations Key skills for 2020 Skills bundle Biochemical Engineers Complex Problem Solving Complex Problem Solving Skills Materials Engineers Critical Thinking Process Skills Mechanical Engineers Cognitive Flexibility Cognitive Abilities Creativity Cognitive Abilities Mathematical Reasoning Cognitive Abilities 75 | The Future of Jobs Report 0.30 30 50% are confident strategies are suitable .
76 | The Future of Jobs Report Industry Profile Energy Drivers of Change Workforce Disruption Top Trends Impacting Business Models Industry Average New energy supplies and technologies 71% Climate change, natural resources 50% Changing nature of work, flexible work 46% Geopolitical volatility 29% STABLE 2 Current share of female workforce Ease of recruitment, current Ease of recruitment, 2020 Expected change, 2015–2020 Skills stability Current share of female workforce Ease of recruitment, current Ease of recruitment, 2020 growth 1.70% 65% 11% hard neutral 62% 22% neutral easier Management growth General and Operations Managers 2.06% Business Services and Administration Managers 92% 16% hard neutral 100% 15% easy harder Job families Architecture and Engineering Energy and Petroleum Engineers Electrotechnology Engineers Expected Time to Impact on Employee Skills 1 Skills stability Construction and Extraction Mining and Petroleum Extraction Workers Mining and Petroleum Plant Operators 13% New energy supplies and technologies NEUTRAL Manufacturing and Production decline Assembly and Factory Workers –3.11% Petroleum and Natural Gas Refining Plant Operators 13% Rapid urbanization HARD Main Job Families 13% Longevity, ageing societies 15% Employment outlook Young demographics in emerging markets 17% Women’s economic power, aspirations 70% Climate change, natural resources 3 Changing nature of work, flexible work Expected Impact on Job Quality 41% 35% Impact 2015– Impact 2015– felt already 2017 felt already 2017 18% 6% 2018– 2018– 2020 2020 2021– 2021– 2025 2025 42% 42% Impact 2015– Impact 2015– felt already 2017 felt already 2017 8% 8% 2018– 2018– 2020 2020 2021– 2021– 2025 2025 9% 73% Impact 2015– Impact 2015– felt already 2017 felt already 2017 18% 2018– 2018– 2020 2020 2021– 2021– 2025 2025 ⬆ Compensation decline –1.15% ⬆ Job security ⬆ Work-life balance . Industry Profile Energy Skills Forecast Change Management and Future Workforce Planning Skills Change, Overall Industry Current 2020 Barriers Social skills Insufficient understanding of disruptive changes............................................ 55% Technical skills Resource constraints.................................................................................... 55% Cognitive abilities Pressure from shareholders, short-term profitability....................................... 41% Resource management skills Don’t know..................................................................................................
36% Workforce strategy not aligned to innovation strategy.................................... 32% Process skills 80% believe future workforce planning is a leadership priority Insufficient priority by top management......................................................... 18% Complex problem solving skills Systems skills Physical abilities Strategies Content skills Invest in reskilling current employees 59% Support mobility and job rotation 50% Attract foreign talent 41% Target female talent 36% Offer apprenticeships 23% Collaborate, educational institutions 23% Collaborate, other companies in industry 18% Collaborate, other companies across industries 14% 0.00 0 0.05 5 0.10 10 n growing skills demand 0.15 15 0.20 20 n stable skills demand 0.25 25 n declining skills demand Emerging Job Family in Focus: Management Occupations Key skills for 2020 Skills family Managing Directors and Chief Executives Complex Problem Solving Complex Problem Solving Skills General and Operations Managers Critical Thinking Process Skills Business Services and Administration People Management Resource Management Skills Visualization Cognitive Abilities Time Management Resource Management Skills Managers 77 | The Future of Jobs Report 0.30 30 60% are confident strategies are suitable .
78 | The Future of Jobs Report Industry Profile Financial Services & Investors Drivers of Change Workforce Disruption Top Trends Impacting Business Models Industry Average Processing power, Big Data 44% Middle class in emerging markets 41% Mobile internet, cloud technology 41% Changing nature of work, flexible work 26% Geopolitical volatility 26% Young demographics in emerging markets 24% Consumer ethics, privacy issues 18% Sharing economy, crowdsourcing 18% GROWTH 1 2 29% HARD HARDER Employment outlook Skills stability Current share of female workforce Ease of recruitment, current Ease of recruitment, 2020 Main Job Families Expected change, 2015–2020 Job families 60% 27% 13% 2018– 2018– 2020 2020 Ease of recruitment, current Ease of recruitment, 2020 3 36% hard neutral growth 4.50% 60% 35% hard harder Sales and Related Securities and Finance Dealers and Brokers Sales and Purchasing Agents and Brokers stable –0.68% 70% 38% neutral neutral Management growth General and Operations Managers 2.20% Business Services and Administration Managers Mobile internet, cloud technology 63% Computer and Mathematical Data Analysts Information Security Analysts Middle class in emerging markets 50% 2021– 2021– 2025 2025 Current share of female workforce stable 0.79% 48% 26% hard neutral Expected Impact on Job Quality Impact 2015– Impact 2015– felt already 2017 felt already 2017 Skills stability Business and Financial Operations Financial and Investment Advisers Investment Fund Managers Expected Time to Impact on Employee Skills Processing power, Big Data 56% 29% Impact 2015– Impact 2015– felt already 2017 felt already 2017 21% 2018– 2018– 2020 2020 64% 2021– 2021– 2025 2025 36% Impact 2015– Impact 2015– felt already 2017 felt already 2017 2018– 2018– 2020 2020 2021– 2021– 2025 2025 ⬆ Compensation ⬆ Job security ⬆ Work-life balance . Industry Profile Financial Services & Investors Skills Forecast Change Management and Future Workforce Planning Skills Change, Overall Industry Current 2020 Barriers Social skills Insufficient understanding of disruptive changes............................................ 67% Cognitive abilities Workforce strategy not aligned to innovation strategy.................................... 53% Process skills Pressure from shareholders, short-term profitability....................................... 47% Resource management skills Resource constraints....................................................................................
43% Insufficient priority by top management......................................................... 27% Systems skills 67% believe future workforce planning is a leadership priority Insufficient priority by line management........................................................ 27% Content skills Technical skills Complex problem solving skills Strategies Physical abilities Invest in reskilling current employees 67% Support mobility and job rotation 47% Target female talent 30% Attract foreign talent 23% Offer apprenticeships 20% Collaborate, educational institutions 20% Collaborate, other companies across industries 17% Don’t know 17% 0.00 0 0.05 5 0.10 10 n growing skills demand 0.15 15 0.20 20 n stable skills demand 0.25 25 n declining skills demand Emerging Job Family in Focus: Computer and Mathematical Occupations Key skills for 2020 Skills family Information Security Analysts Complex Problem Solving Complex Problem Solving Skills Database and Network Professionals Programming Technical Skills Data Analysts Logical Reasoning Cognitive Abilities Critical Thinking Process Skills Creativity Cognitive Abilities 79 | The Future of Jobs Report 0.30 30 53% are confident strategies are suitable .
80 | The Future of Jobs Report Industry Profile Healthcare Drivers of Change Workforce Disruption Top Trends Impacting Business Models Industry Average Mobile internet, cloud technology 50% Middle class in emerging markets 40% Longevity, ageing societies 40% STABLE 71% 38% HARD HARDER Employment outlook Skills stability Current share of female workforce Ease of recruitment, current Ease of recruitment, 2020 Main Job Families Expected change, 2015–2020 Skills stability Current share of female workforce Ease of recruitment, current Ease of recruitment, 2020 stable 0.79% 85% 42% hard neutral Life, Physical, and Social Sciences stable Biologists and Geneticists –0.71% Chemists and Chemical Laboratory Scientists 100% 40% hard harder Sales and Related decline Shop Salespersons –1.82% Sales Representatives, Technical and Scientific 70% 63% neutral harder — 85% hard harder Job families Manufacturing and Production Chemical Processing Plant Operators Assembly and Factory Workers Expected Time to Impact on Employee Skills 1 Mobile internet, cloud technology 2 Middle class in emerging markets 3 Longevity, ageing societies Personal Care and Service Personal Care Aides Expected Impact on Job Quality 20% 40% Impact 2015– Impact 2015– felt already 2017 felt already 2017 40% 2018– 2018– 2020 2020 50% 2021– 2021– 2025 2025 50% Impact 2015– Impact 2015– felt already 2017 felt already 2017 50% 2018– 2018– 2020 2020 2021– 2021– 2025 2025 50% Impact 2015– Impact 2015– felt already 2017 felt already 2017 2018– 2018– 2020 2020 2021– 2021– 2025 2025 ⬆ Compensation — ⬆ Job security ⬆ Work-life balance . Industry Profile Healthcare Skills Forecast Change Management and Future Workforce Planning Skills Change, Overall Industry Current 2020 Barriers Cognitive abilities Resource constraints.................................................................................... 75% Social skills Insufficient understanding of disruptive changes............................................ 50% Process skills Workforce strategy not aligned to innovation strategy.................................... 50% Technical skills Pressure from shareholders, short-term profitability.......................................
50% Don’t know.................................................................................................. 50% Resource management skills 80% believe future workforce planning is a leadership priority Insufficient priority by top management......................................................... 25% Content skills Complex problem solving skills Systems skills Strategies Physical abilities Invest in reskilling current employees 83% Support mobility and job rotation 50% Attract foreign talent 42% Target minorities’ talent 33% Collaborate, educational institutions 25% Collaborate, other companies in industry 25% Target female talent 17% Don’t know 17% 0.00 0 0.05 5 n growing skills demand 0.10 10 0.15 15 0.20 20 n stable skills demand 0.25 25 n declining skills demand Emerging Job Family in Focus: Business and Financial Operations Occupations Key skills for 2020 Skills family Regulatory and Government Problem Sensitivity Cognitive Abilities Active Learning Content Skills Critical Thinking Process Skills Management of Financial Resources Resource Management Skills Persuasion Social Skills Associate Professionals Sales and Marketing Professionals 81 | The Future of Jobs Report 0.30 30 50% are confident strategies are suitable .
82 | The Future of Jobs Report Industry Profile Information and Communication Technology Drivers of Change Workforce Disruption Top Trends Impacting Business Models Industry Average Mobile internet, cloud technology 69% Processing power, Big Data 44% Changing nature of work, flexible work 36% Internet of Things 33% Consumer ethics, privacy issues 31% New energy supplies and technologies 17% Longevity, ageing societies 14% Sharing economy, crowdsourcing 11% STABLE 1 2 21% HARD HARDER Employment outlook Skills stability Current share of female workforce Ease of recruitment, current Ease of recruitment, 2020 Main Job Families Skills stability Current share of female workforce Ease of recruitment, current Ease of recruitment, 2020 Computer and Mathematical growth Database and Network Professionals 1.74% Software and Applications Developers and Analysts 63% 20% hard harder Sales and Related Telemarketers Sales Representatives, Wholesale and Technical growth 2.14% 64% 44% neutral neutral Installation and Maintenance decline Mechanics and Machinery Repairers –1.19% Electronics and Telecommunications Installers and Repairers 54% 9% hard neutral Architecture and Engineering Electrotechnology Engineers Architects and Surveyors 77% 7% hard harder Expected change, 2015–2020 Job families Expected Time to Impact on Employee Skills Mobile internet, cloud technology 65% Processing power, Big Data 3 Changing nature of work, flexible work Expected Impact on Job Quality 76% 20% Impact 2015– Impact 2015– felt already 2017 felt already 2017 4% 2018– 2018– 2020 2020 56% 2021– 2021– 2025 2025 31% Impact 2015– Impact 2015– felt already 2017 felt already 2017 13% 2018– 2018– 2020 2020 23% 2021– 2021– 2025 2025 54% Impact 2015– Impact 2015– felt already 2017 felt already 2017 23% 2018– 2018– 2020 2020 2021– 2021– 2025 2025 ⬆ Compensation growth 4.12 ⬆ Job security ⬆ Work-life balance . Industry Profile Information and Communication Technology Skills Forecast Change Management and Future Workforce Planning Skills Change, Overall Industry Current 2020 Barriers Technical skills Resource constraints.................................................................................... 74% Social skills Insufficient understanding of disruptive changes............................................ 48% Cognitive abilities Pressure from shareholders, short-term profitability....................................... 42% Process skills Workforce strategy not aligned to innovation strategy....................................
39% Insufficient priority by top management......................................................... 23% Resource management skills 73% believe future workforce planning is a leadership priority Insufficient priority by line management........................................................ 16% Content skills Complex problem solving skills Systems skills Strategies Physical abilities Invest in reskilling current employees 81% Support mobility and job rotation 35% Collaborate, educational institutions 35% Hire more short-term workers 26% Offer apprenticeships 23% Attract foreign talent 19% Target minorities’ talent 16% Target female talent 16% 0.00 0 0.05 5 0.10 10 n growing skills demand 0.15 15 0.20 20 n stable skills demand 0.25 25 0.30 30 n declining skills demand Emerging Job Family in Focus: Computer and Mathematical Occupations Key skills for 2020 Skills family Software and Applications Developers and Analysts Complex Problem Solving Complex Problem Solving Skills Information Security Analysts Critical Thinking Process Skills Data Analysts Cognitive Flexibility Cognitive Abilities Mathematical Reasoning Cognitive Abilities Active Learning 83 | The Future of Jobs Report Content Skills 60% are confident strategies are suitable .
84 | The Future of Jobs Report Industry Profile Media, Entertainment and Information Drivers of Change Workforce Disruption Top Trends Impacting Business Models Industry Average Mobile internet, cloud technology 57% Processing power, Big Data 36% Changing nature of work, flexible work 36% GROWTH 73% 30% HARD HARDER Employment outlook Skills stability Current share of female workforce Ease of recruitment, current Ease of recruitment, 2020 Main Job Families Skills stability Current share of female workforce Ease of recruitment, current Ease of recruitment, 2020 Arts, Design, Entertainment, Sports, and Media stable Advertising and Public Relations Professionals –0.59% Telecommunications and Broadcasting Technicians 66% 49% very hard harder Computer and Mathematical strong growth Data Analysts 6.94% Software and Applications Developers and Analysts 88% 23% hard harder Sales and Related growth Cashiers and Ticket Clerks 2.69% Door-To-Door Sales Workers, News and Street Vendors 86% 39% neutral neutral Management General and Operations Managers Business Services and Administration Managers 67% 12% hard neutral Expected change, 2015–2020 Job families Expected Time to Impact on Employee Skills 1 Mobile internet, cloud technology 2 Processing power, Big Data 3 Changing nature of work, flexible work Expected Impact on Job Quality 75% 25% Impact 2015– Impact 2015– felt already 2017 felt already 2017 40% 2018– 2018– 2020 2020 2021– 2021– 2025 2025 60% Impact 2015– Impact 2015– felt already 2017 felt already 2017 60% 2018– 2018– 2020 2020 2021– 2021– 2025 2025 40% Impact 2015– Impact 2015– felt already 2017 felt already 2017 2018– 2018– 2020 2020 2021– 2021– 2025 2025 ⬆ Compensation growth 1.67% ⬇ Job security ⬆ Work-life balance . Industry Profile Media, Entertainment and Information Skills Forecast Change Management and Future Workforce Planning Skills Change, Overall Industry Current 2020 Barriers Social skills Pressure from shareholders, short-term profitability....................................... 64% Process skills Workforce strategy not aligned to innovation strategy.................................... 50% Resource management skills Resource constraints.................................................................................... 36% Technical skills Insufficient understanding of disruptive changes............................................
36% Insufficient priority by line management........................................................ 21% Cognitive abilities 69% believe future workforce planning is a leadership priority Don’t know.................................................................................................. 14% Content skills Complex problem solving skills Strategies Systems skills Invest in reskilling current employees 0.10 10 n growing skills demand 0.20 20 n stable skills demand 0.25 25 0.30 30 n declining skills demand Emerging Job Family in Focus: Management Occupations Key skills for 2020 Skills family Managing Directors and Chief Executives Critical Thinking Process Skills Organisational Development Specialists People Management Resource Management Skills General and Operations Managers Complex Problem Solving Complex Problem Solving Skills Monitoring Self and Others Process Skills Management of Financial Resources Resource Management Skills 85 | The Future of Jobs Report Collaborate, educational institutions 38% 31% 23% Collaborate, other companies across industries 0.15 15 46% Hire more short-term workers 0.05 5 Target female talent Offer apprenticeships 0.00 0 77% 23% Support mobility and job rotation 15% Attract foreign talent 15% 46% are confident strategies are suitable .
86 | The Future of Jobs Report Industry Profile Mobility Drivers of Change Workforce Disruption Top Trends Impacting Business Models Industry Average Middle class in emerging markets 39% Changing nature of work, flexible work 35% Climate change, natural resources 32% Robotics, autonomous transport 29% New energy supplies and technologies 26% Mobile internet, cloud technology 16% Geopolitical volatility 16% Artificial Intelligence 16% STABLE 1 2 16% HARD HARDER Employment outlook Skills stability Current share of female workforce Ease of recruitment, current Ease of recruitment, 2020 Main Job Families Expected change, 2015–2020 Job families 58% 34% 8% 2018– 2020 Ease of recruitment, current Ease of recruitment, 2020 3 18% neutral harder growth 4.83% 62% 13% hard harder Transportation and Logistics Supply Chain and Logistics Specialists Transportation Attendants and Conductors growth 3.13% 63% 13% hard harder Sales and Related decline Sales and Marketing Professionals –1.88% Sales Representatives, Wholesale and Technical Climate change, natural resources 66% Architecture and Engineering Electrotechnology Engineers Industrial and Production Engineers Changing nature of work, flexible work 45% 2021– 2025 Current share of female workforce decline –1.43% 4% 16% hard neutral Expected Impact on Job Quality Impact 2015– felt already 2017 Skills stability Manufacturing and Production Assembly and Factory Workers Sheet and Structural Metal Workers Expected Time to Impact on Employee Skills Middle class in emerging markets 61% 37% Impact 2015– Impact 2015– felt already 2017 felt already 2017 18% 2018– 2018– 2020 2020 70% 2021– 2021– 2025 2025 20% Impact 2015– Impact 2015– felt already 2017 felt already 2017 10% 2018– 2018– 2020 2020 2021– 2021– 2025 2025 ⬆ Compensation ⬇ Job security ⬆ Work-life balance . Industry Profile Mobility Skills Forecast Change Management and Future Workforce Planning Skills Change, Overall Industry Current 2020 Barriers Social skills Insufficient understanding of disruptive changes............................................ 58% Technical skills Resource constraints.................................................................................... 50% Cognitive abilities Pressure from shareholders, short-term profitability....................................... 38% Resource management skills Insufficient priority by line management........................................................
33% Insufficient priority by top management......................................................... 21% Process skills 71% believe future workforce planning is a leadership priority Workforce strategy not aligned to innovation strategy.................................... 17% Content skills Complex problem solving skills Systems skills Strategies Physical abilities Invest in reskilling current employees 83% Support mobility and job rotation 54% Collaborate, educational institutions 29% Offer apprenticeships 29% Attract foreign talent 25% Target female talent 21% Hire more short-term workers 17% Target minorities’ talent 13% 0.00 0 0.05 5 0.10 10 n growing skills demand 0.15 15 0.20 20 n stable skills demand 0.25 25 n declining skills demand Emerging Job Families in Focus: Computer and Mathematical & Arts and Design Occupations Key skills for 2020 Skills family Data Analysts Creativity Cognitive Abilities Software and Applications Developers and Analysts Active Learning Content Skills Commercial and Industrial Designers Time Management Resource Management Skills Negotiation Social Skills Programming Technical Skills 87 | The Future of Jobs Report 0.30 30 67% are confident strategies are suitable .
88 | The Future of Jobs Report Industry Profile Professional Services Drivers of Change Workforce Disruption Top Trends Impacting Business Models Industry Average Changing nature of work, flexible work 65% Processing power, Big Data 43% Mobile internet, cloud technology 38% Sharing economy, crowdsourcing 25% Consumer ethics, privacy issues 20% Internet of Things 15% Women’s economic power, aspirations 15% Middle class in emerging markets 13% STABLE 1 2 30% HARD HARDER Employment outlook Skills stability Current share of female workforce Ease of recruitment, current Ease of recruitment, 2020 Main Job Families Expected change, 2015–2020 Skills stability Current share of female workforce Ease of recruitment, current Ease of recruitment, 2020 stable 0.33% 77% 48% neutral harder Computer and Mathematical strong growth Data Analysts 5.31% Software and Applications Developers and Analysts 54% 17% hard harder Management growth General and Operations Managers 1.00% Business Services and Administration Managers 65% 29% hard neutral Sales and Related Sales and Marketing Professionals Real Estate Sales Agents 54% 56% hard harder Job families Business and Financial Operations Management and Organisation Analysts Human Resources Specialists Expected Time to Impact on Employee Skills Changing nature of work, flexible work 67% Processing power, Big Data 3 Mobile internet, cloud technology Expected Impact on Job Quality 56% 32% Impact 2015– Impact 2015– felt already 2017 felt already 2017 8% 2018– 2018– 2020 2020 4% 2021– 2021– 2025 2025 62% 38% Impact 2015– Impact 2015– felt already 2017 felt already 2017 60% 2018– 2018– 2020 2020 2021– 2021– 2025 2025 40% Impact 2015– Impact 2015– felt already 2017 felt already 2017 2018– 2018– 2020 2020 2021– 2021– 2025 2025 ⬆ Compensation decline –3.21% ⬇ Job security ⬆ Work-life balance . Industry Profile Professional Services Skills Forecast Change Management and Future Workforce Planning Skills Change, Overall Industry Current 2020 Barriers Social skills Insufficient understanding of disruptive changes............................................ 51% Cognitive abilities Resource constraints.................................................................................... 49% Process skills Workforce strategy not aligned to innovation strategy.................................... 37% Content skills Pressure from shareholders, short-term profitability.......................................
35% Insufficient priority by top management......................................................... 23% Resource management skills 61% believe future workforce planning is a leadership priority Don’t know.................................................................................................. 19% Technical skills Complex problem solving skills Systems skills Strategies Physical abilities Invest in reskilling current employees 56% Support mobility and job rotation 40% Offer apprenticeships 33% Collaborate, other companies across industries 28% Target female talent 21% Collaborate, educational institutions 14% Collaborate, other companies in industry 14% Hire more virtual workers 12% 0.00 0 0.05 5 0.10 10 n growing skills demand 0.15 15 0.20 20 n stable skills demand 0.25 25 0.30 30 n declining skills demand Emerging Job Family in Focus: Computer and Mathematical Occupations Key skills for 2020 Skills family Mathematicians, Actuaries and Statisticians Complex Problem Solving Complex Problem Solving Skills Geospatial Information Scientists and Technologists Problem Sensitivity Cognitive Abilities Data Analysts Logical Reasoning Cognitive Abilities Mathematical Reasoning Cognitive Abilities ICT Literacy Content Skills 89 | The Future of Jobs Report 58% are confident strategies are suitable .
. Country and Regional Profiles . 92 | The Future of Jobs Report Regional Profile Association of Southeast Asian Nations Workforce Disruption Sample Overview Main Industries Employment Outlook by Main Job Family CURRENT Current workforce (thousands) 2020 Employment outlook, 2015–2020 Local share of recruitment, specialists Ease of recruitment, overall Local share of recruitment, specialists Ease of recruitment, overall Consumer — — easy — harder Energy — — hard — easier Financial Services & Investors — — easy 51–75% easier Professional Services — — very hard — harder Industry Industries 20,120 Farming, Fishing and Forestry 12,525 Transportation and Logistics 11,579 Sales and Related 10,317 Office and Administrative 6,907 Occupation types Mass Employment Assembly and Factory Workers Strategic/Specialist Financial Analysts 18% 18% 41% 24% Up to 500 500– 5,000 5,000– 50,000 More than 50,000 New and Emerging Business Services and Administration Managers Country/region Sample average Country/region hard harder neutral easy hard neutral harder — — hard hard Business, Legal and Financial Computer, Mathematical and Science 2,712 Arts, Design, Entertainment, Sports, and Media 2,700 Education and Training 2,195 Architecture and Engineering Sample average neutral Installation and Maintenance 3,604 2020 CURRENT Construction and Extraction 4,945 Ease of Recruitment Management 5,372 Number of Employees Manufacturing and Production 9,113 n Professional Services..........................................15% n Energy...............................................................15% n Financial Services & Investors.............................15% n Consumer..........................................................14% n Others................................................................41% 9,342 N/A l Growing l Declining l Stable Not shown: Social and Protective Services (7,226), Healthcare Practitioners (2,419), Hospitality and Food Related (7,046), Personal Care and Service (10,862) . Regional Profile Association of Southeast Asian Nations Drivers of Change Change Management and Future Workforce Planning Top Trends Impacting Industries Mobile internet, cloud technology Changing nature of work, flexible work 38% Processing power, Big Data 38% New energy supplies and technologies 38% Middle class in emerging markets 31% Climate change, natural resources 31% Geopolitical volatility 23% Consumer ethics, privacy issues Barriers 46% 15% Pressure from shareholders, short-term profitability.............................. 40% Resource constraints........................................................................... 40% Workforce strategy not aligned to innovation strategy........................... 35% Insufficient understanding of disruptive changes...................................
25% Don’t know......................................................................................... 20% 64% believe future workforce planning is a leadership priority Strategies Support mobility and job rotation 67% 17% 17% Impact already felt 2015– 2017 2018– 2020 93 | The Future of Jobs Report 2021– 2025 31% Hire more short-term workers 31% Collaborate, educational institutions 23% Target female talent 15% Target minorities’ talent 8% Collaborate, other companies in industry Expected Impact on Employment Outlook: Negative 46% Invest in reskilling current employees Expected Time to Impact on Employee Skills 54% Attract foreign talent Disruption in Focus: Mobile internet, Cloud Technology 8% 50% are confident strategies are suitable . 94 | The Future of Jobs Report Country Profile Australia Workforce Disruption Sample Overview Main Industries Employment Outlook by Main Job Family CURRENT Current workforce (thousands) 2020 Employment outlook, 2015–2020 Local share of recruitment, specialists Ease of recruitment, overall Local share of recruitment, specialists Ease of recruitment, overall Professional Services stable 0.91% 76–100% hard 51–75% harder Basic and Infrastructure decline –1.67% — easy — neutral Energy growth 76–100% hard 76–100% harder 76–100% hard 76–100% harder Industry Industries 1,452 Management 1,052 Sales and Related Number of Employees Occupation types Mass Employment Petroleum and Natural Gas Refining Plant Operators Strategic/Specialist Sales Representatives, Wholesale and Technical Products 9% 13% 43% 35% Up to 500 500– 5,000 5,000– 50,000 More than 50,000 New and Emerging Robotics Engineers Sample average Country/region hard harder neutral hard hard harder Construction and Extraction Installation and Maintenance Farming, Fishing and Forestry 455 Education and Training Arts, Design, Entertainment, Sports, and Media Architecture and Engineering Sample average neutral Computer, Mathematical and Science 386 Country/region Manufacturing and Production 416 2020 CURRENT Business, Legal and Financial 457 Ease of Recruitment 685 458 n Professional Services..........................................27% n Basic and Infrastructure......................................26% n Energy...............................................................22% n Information and Communication Technology.........16% n Others..................................................................9% Transportation and Logistics 550 growth 3.57% 897 593 Information and Communication Technology Office and Administrative 683 3.57% 962 harder — — hard hard N/A l Growing l Declining l Stable Not shown: Social and Protective Services (782), Healthcare Practitioners (343), Hospitality and Food Related (634), Personal Care and Service (761) . Country Profile Australia Drivers of Change Change Management and Future Workforce Planning Top Trends Impacting Industries Changing nature of work, flexible work Climate change, natural resources 38% New energy supplies and technologies 38% Mobile internet, cloud technology 29% Processing power, Big Data 24% Geopolitical volatility 24% Sharing economy, crowdsourcing 19% Women’s economic power, aspirations Barriers 52% 14% Resource constraints........................................................................... 93% Pressure from shareholders, short-term profitability.............................. 71% Workforce strategy not aligned to innovation strategy........................... 57% Insufficient understanding of disruptive changes...................................
57% Insufficient priority by top management................................................ 57% 45% believe future workforce planning is a leadership priority Strategies Invest in reskilling current employees 60% 40% Impact already felt 2015– 2017 95 | The Future of Jobs Report 2018– 2020 2021– 2025 33% Collaborate, other companies across industries 28% Target minorities’ talent 22% Collaborate, other companies in industry 22% Collaborate, educational institutions 17% Attract foreign talent Expected Impact on Employment Outlook: Neutral 33% Target female talent Expected Time to Impact on Employee Skills 61% Support mobility and job rotation Disruption in Focus: Changing Nature of Work, Flexible Work 6% 55% are confident strategies are suitable . 96 | The Future of Jobs Report Country Profile Brazil Workforce Disruption Sample Overview Main Industries Employment Outlook by Main Job Family CURRENT Current workforce (thousands) 2020 Employment outlook, 2015–2020 Local share of recruitment, specialists Ease of recruitment, overall Local share of recruitment, specialists Ease of recruitment, overall Professional Services stable –0.71% 76–100% hard — harder Mobility growth 3.08% 76–100% hard 76–100% harder Consumer decline –1.11% 76–100% hard 76–100% neutral Basic and Infrastructure decline –2.00% — easy — neutral Information and Communication Technology strong decline — neutral — harder Energy strong decline –6.00% — neutral — neutral Industry 18,329 Farming, Fishing and Forestry n Professional Services..........................................24% n Mobility..............................................................23% n Consumer..........................................................14% n Basic and Infrastructure......................................11% n Energy.................................................................8% n Information and Communication Technology...........8% n Others................................................................14% Number of Employees Occupation types Mass Employment Assembly and Factory Workers Strategic/Specialist Software and Applications Developers and Analysts 3% 16% 34% 47% Up to 500 500– 5,000 5,000– 50,000 More than 50,000 New and Emerging Biochemical Engineers Country/region Sample average Country/region hard neutral neutral hard hard harder harder — — hard 7,146 Office and Administrative 7,042 Manufacturing and Production 5,510 Management 5,237 Construction and Extraction Installation and Maintenance Business, Legal and Financial Computer, Mathematical and Science 1,376 Arts, Design, Entertainment, Sports, and Media 1,371 Education and Training Architecture and Engineering Sample average neutral Sales and Related 1,115 2020 CURRENT 8,062 1,830 Ease of Recruitment Transportation and Logistics 4,075 –5.00% 9,175 2,507 Industries hard N/A l Growing l Declining l Stable Not shown: Social and Protective Services (4,699), Healthcare Practitioners (1,227), Hospitality and Food Related (4,992), Personal Care and Service (8,257) . Country Profile Brazil Drivers of Change Change Management and Future Workforce Planning Top Trends Impacting Industries Middle class in emerging markets Changing nature of work, flexible work 42% Processing power, Big Data 27% New energy supplies and technologies 27% Mobile internet, cloud technology 24% Climate change, natural resources 21% Sharing economy, crowdsourcing 18% Consumer ethics, privacy issues Barriers 45% 12% Insufficient understanding of disruptive changes................................... 55% Workforce strategy not aligned to innovation strategy........................... 48% Pressure from shareholders, short-term profitability.............................. 48% Resource constraints...........................................................................
34% Insufficient priority by top management................................................ 28% 69% believe future workforce planning is a leadership priority Strategies Invest in reskilling current employees 73% 20% Impact already felt 2015– 2017 97 | The Future of Jobs Report 7% 2018– 2020 2021– 2025 28% Collaborate, educational institutions 28% Attract foreign talent 28% Target minorities’ talent 17% Collaborate, other companies across industries 14% Offer apprenticeships Expected Impact on Employment Outlook: Negative 52% Target female talent Expected Time to Impact on Employee Skills 59% Support mobility and job rotation Disruption in Focus: Middle class in emerging markets 14% 52% are confident strategies are suitable . 98 | The Future of Jobs Report Country Profile China Workforce Disruption Sample Overview Main Industries Employment Outlook by Main Job Family CURRENT Current workforce (thousands) 2020 Employment outlook, 2015–2020 Local share of recruitment, specialists Ease of recruitment, overall Local share of recruitment, specialists Ease of recruitment, overall — Architecture and Engineering Professional Services decline –1.48% 51–75% hard 51–75% harder — Arts, Design, Entertainment, Sports, and Media Mobility growth 3.06% 51–75% hard 76–100% harder — Business and Financial Operations — Social and Protective Services Basic and Infrastructure stable 0.50% 76–100% hard 26–50% harder — Computer and Mathematical Energy growth 2.06% 26–50% hard 76–100% neutral — Construction and Extraction — Education and Training Financial Services & Investors growth 76–100% hard 26–50% harder — Farming, Fishing and Forestry Consumer stable –0.56% 51–75% hard 51–75% harder — Healthcare Practitioners — Hospitality and Food Related — Installation and Maintenance — Life, physical, and social sciences — Legal — Management — Manufacturing and Production — Office and Administrative — Personal Care and Service — Sales and Related — Transportation and Logistics Industry Industries n Professional Services..........................................20% n Mobility..............................................................15% n Basic and Infrastructure......................................15% n Energy...............................................................14% n Financial Services & Investors.............................13% n Consumer............................................................9% n Others................................................................14% Number of Employees 2.06% Ease of Recruitment 2020 CURRENT Occupation types 16% 41% 31% 500– 5,000 5,000– 50,000 More than 50,000 Country/region Sample average hard hard harder neutral Strategic/Specialist Sales Representatives, Wholesale and Technical Products Up to 500 Sample average Mass Employment Assembly and Factory Workers 12% Country/region hard hard harder harder New and Emerging Financial and Investment Advisers — — hard hard N/A l Growing l Declining l Stable . Country Profile China Drivers of Change Change Management and Future Workforce Planning Top Trends Impacting Industries Middle class in emerging markets Changing nature of work, flexible work 33% Processing power, Big Data 31% Mobile internet, cloud technology 29% Internet of Things 21% Sharing economy, crowdsourcing 21% Climate change, natural resources 19% Consumer ethics, privacy issues Barriers 38% 17% Insufficient understanding of disruptive changes................................... 64% Resource constraints........................................................................... 55% Workforce strategy not aligned to innovation strategy........................... 50% Pressure from shareholders, short-term profitability..............................
39% Insufficient priority by top management................................................ 34% 61% believe future workforce planning is a leadership priority Strategies Invest in reskilling current employees 55% 25% 20% Impact already felt 2015– 2017 2018– 2020 99 | The Future of Jobs Report 2021– 2025 20% Collaborate, educational institutions 18% Target minorities’ talent 18% Offer apprenticeships 18% Attract foreign talent 11% Collaborate, other companies across industries Expected Impact on Employment Outlook: Neutral 36% Target female talent Expected Time to Impact on Employee Skills 48% Support mobility and job rotation Disruption in Focus: Middle class in emerging markets 11% 50% are confident strategies are suitable . 100 | The Future of Jobs Report Country Profile France Workforce Disruption Sample Overview Main Industries Employment Outlook by Main Job Family CURRENT Current workforce (thousands) 2020 Employment outlook, 2015–2020 Local share of recruitment, specialists Ease of recruitment, overall Local share of recruitment, specialists Ease of recruitment, overall Professional Services decline –3.53% 76–100% hard — harder Mobility growth — hard — harder 76–100% neutral — neutral n Professional Services..........................................62% n Mobility..............................................................12% n Financial Services & Investors.............................12% n Others................................................................14% Number of Employees Ease of Recruitment Occupation types Up to 500 500– 5,000 58% 32% 5,000– 50,000 More than 50,000 Sample average Country/region 2,151 Management Business, Legal and Financial Manufacturing and Production Farming, Fishing and Forestry Computer, Mathematical and Science Construction and Extraction hard neutral neutral hard hard harder harder New and Emerging Sales Representatives, Wholesale and Technical Products — — neutral hard Arts, Design, Entertainment, Sports, and Media 874 Education and Training 840 Installation and Maintenance 693 Architecture and Engineering Sample average neutral Strategic/Specialist Sales and Marketing Professionals 5% Country/region Mass Employment Sales and Marketing Professionals 5% Office and Administrative 920 2020 CURRENT 2,209 1,120 growth 0.00% Transportation and Logistics 1,334 Financial Services & Investors 2,453 1,618 1.25% Sales and Related 1,181 Industries 2,464 1,753 Industry N/A l Growing l Declining l Stable Not shown: Social and Protective Services (1,745), Healthcare Practitioners (849), Hospitality and Food Related (1,420), Personal Care and Service (1,843) . Country Profile France Drivers of Change Change Management and Future Workforce Planning Top Trends Impacting Industries Changing nature of work, flexible work Mobile internet, cloud technology 33% Sharing economy, crowdsourcing 33% Middle class in emerging markets 27% Processing power, Big Data 27% New energy supplies and technologies 27% Young demographics in emerging markets 20% Consumer ethics, privacy issues Barriers 60% 20% Workforce strategy not aligned to innovation strategy........................... 67% Don’t know......................................................................................... 67% Resource constraints........................................................................... 50% Insufficient understanding of disruptive changes...................................
42% Pressure from shareholders, short-term profitability.............................. 42% 75% believe future workforce planning is a leadership priority Strategies Invest in reskilling current employees 62% 13% 25% Impact already felt 2015– 2017 2018– 2020 101 | The Future of Jobs Report 2021– 2025 25% Support mobility and job rotation 25% Offer apprenticeships 25% Collaborate, educational institutions 25% Attract foreign talent 25% Collaborate, other companies in industry Expected Impact on Employment Outlook: Negative 33% Target female talent Expected Time to Impact on Employee Skills 33% Collaborate, other companies across industries Disruption in Focus: Changing Nature of Work, Flexible Work 8% 58% are confident strategies are suitable . 102 | The Future of Jobs Report Country Profile Germany Workforce Disruption Sample Overview Main Industries Employment Outlook by Main Job Family CURRENT Current workforce (thousands) 2020 Employment outlook, 2015–2020 Local share of recruitment, specialists Ease of recruitment, overall Local share of recruitment, specialists Ease of recruitment, overall Basic and Infrastructure growth 1.88% 26–50% hard 51–75% harder Mobility decline –3.67% 51–75% hard 51–75% harder Professional Services stable 0.56% 76–100% very hard 26–50% harder Energy decline –1.00% 26–50% easy 51–75% neutral stable 51–75% neutral 26–50% harder — hard — neutral n Basic and Infrastructure......................................21% n Mobility..............................................................21% n Professional Services..........................................17% n Energy...............................................................13% n Financial Services & Investors.............................10% n Information and Communication Technology...........8% n Others................................................................12% Number of Employees Financial Services & Investors Information and Communication Technology Ease of Recruitment 2020 CURRENT Occupation types Country/region Sample average Country/region hard harder neutral Strategic/Specialist Sales Representatives, Wholesale and Technical Products hard hard harder harder New and Emerging Sales Representatives, Wholesale and Technical Products — — hard 8% 22% 46% Up to 500 500– 5,000 5,000– 50,000 More than 50,000 Transportation and Logistics 2,883 Business, Legal and Financial 2,622 Manufacturing and Production 2,282 Management 2,244 Construction and Extraction Computer, Mathematical and Science Installation and Maintenance Arts, Design, Entertainment, Sports, and Media 1,373 Education and Training 1,184 Farming, Fishing and Forestry Architecture and Engineering hard Mass Employment Assembly and Factory Workers 24% 3,447 Sample average neutral Sales and Related 1,075 growth 3.33% 4,460 1,482 –0.63% Office and Administrative 1,841 Industries 4,480 1,867 Industry N/A l Growing l Declining l Stable Not shown: Social and Protective Services (2,569), Healthcare Practitioners (1,390), Hospitality and Food Related (1,978), Personal Care and Service (2,471) . Country Profile Germany Drivers of Change Change Management and Future Workforce Planning Top Trends Impacting Industries Mobile internet, cloud technology Middle class in emerging markets 32% Climate change, natural resources 29% Changing nature of work, flexible work 23% New energy supplies and technologies 23% Consumer ethics, privacy issues 23% Longevity, ageing societies 16% Processing power, Big Data Barriers 32% 16% Insufficient understanding of disruptive changes................................... 70% Resource constraints........................................................................... 63% Pressure from shareholders, short-term profitability.............................. 52% Workforce strategy not aligned to innovation strategy...........................
33% Insufficient priority by line management............................................... 26% 74% believe future workforce planning is a leadership priority Strategies Invest in reskilling current employees Expected Impact on Employment Outlook: Neutral 60% 40% Impact already felt 2015– 2017 103 | The Future of Jobs Report 30% Attract foreign talent Expected Time to Impact on Employee Skills 56% Support mobility and job rotation Disruption in Focus: Mobile internet, cloud technology 30% Collaborate, educational institutions 22% Target female talent 19% Target minorities’ talent 19% Collaborate, other companies in industry 15% Collaborate, vocational training and cert. providers 15% 2018– 2020 2021– 2025 52% are confident strategies are suitable .
104 | The Future of Jobs Report Regional Profile Gulf Cooperation Council Workforce Disruption Sample Overview Main Industries Employment Outlook by Main Job Family CURRENT Current workforce (thousands) 2020 Employment outlook, 2015–2020 Local share of recruitment, specialists Ease of recruitment, overall Local share of recruitment, specialists Ease of recruitment, overall Consumer stable 0.00% 51–75% hard 26–50% neutral Information and Communication Technology stable 0.56% 51–75% hard 26–50% hard Professional Services decline –2.73% — hard — hard Financial Services & Investors growth 3.75% 26–50% hard 26–50% hard Energy growth 51–75% neutral 76–100% easier 26–50% hard 0–25% easier Industry 1,165 Sales and Related n Consumer..........................................................19% n Information and Communication Technology.........17% n Professional Services..........................................15% n Financial Services & Investors.............................14% n Energy...............................................................14% n Basic and Infrastructure......................................11% n Others................................................................10% Number of Employees Basic and Infrastructure decline –1.43% 2020 CURRENT Occupation types 10% 60% 30% 500– 5,000 5,000– 50,000 More than 50,000 Sample average Country/region hard neutral neutral hard hard neutral harder — — very hard hard Office and Administrative 700 Management 603 Farming, Fishing and Forestry 528 Manufacturing and Production 484 Business, Legal and Financial Computer, Mathematical and Science Construction and Extraction Education and Training 271 Arts, Design, Entertainment, Sports, and Media 258 Installation and Maintenance 225 Architecture and Engineering Sample average hard Strategic/Specialist General and Operations Managers Up to 500 Country/region Mass Employment Assembly and Factory Workers 771 275 Ease of Recruitment Transportation and Logistics 365 2.14% 957 332 Industries New and Emerging Managing Directors and Chief Executives N/A l Growing l Declining l Stable Not shown: Social and Protective Services (1,383), Healthcare Practitioners (238), Hospitality and Food Related (1,288), Personal Care and Service (1,226) . Regional Profile Gulf Cooperation Council Drivers of Change Change Management and Future Workforce Planning Top Trends Impacting Industries New energy supplies and technologies Mobile internet, cloud technology 44% Changing nature of work, flexible work 33% Young demographics in emerging markets 33% Climate change, natural resources 22% Consumer ethics, privacy issues 22% Women’s economic power, aspirations 22% Geopolitical volatility Barriers 56% 22% Resource constraints........................................................................... 56% Workforce strategy not aligned to innovation strategy........................... 56% Insufficient understanding of disruptive changes................................... 33% No barriers.........................................................................................
33% Insufficient priority by top management................................................ 22% 67% believe future workforce planning is a leadership priority Strategies Invest in reskilling current employees Expected Impact on Employment Outlook: Positive 60% Impact already felt 40% 2015– 2017 105 | The Future of Jobs Report 2018– 2020 2021– 2025 44% Attract foreign talent Expected Time to Impact on Employee Skills 44% Collaborate, educational institutions Disruption in Focus: New Energy Supplies and Technologies 33% Support mobility and job rotation 22% Target female talent 22% Offer apprenticeships 22% Collaborate, other companies in industry 11% Collaborate, vocational training and cert. providers 11% 89% are confident strategies are suitable .
106 | The Future of Jobs Report Country Profile India Workforce Disruption Sample Overview Main Industries Employment Outlook by Main Job Family CURRENT Current workforce (thousands) 2020 Employment outlook, 2015–2020 Local share of recruitment, specialists Ease of recruitment, overall Local share of recruitment, specialists Ease of recruitment, overall — Architecture and Engineering Information and Communication Technology stable –0.38% 51–75% neutral 51–75% neutral — Arts, Design, Entertainment, Sports, and Media Mobility growth 1.15% 76–100% neutral 76–100% neutral — Business and Financial Operations — Community, Social and Protective Services Energy growth 1.36% 76–100% hard 76–100% harder — Computer and Mathematical Basic and Infrastructure growth 3.13% 76–100% hard 51–75% harder — Construction and Extraction — Education and Training strong growth 51–75% easy 26–50% harder — Farming, Fishing and Forestry strong growth 76–100% 5.00% hard 51–75% neutral — Healthcare Practitioners — Hospitality and Food Related — Installation and Maintenance — Life, physical, and social sciences — Legal — Management — Manufacturing and Production — Office and Administrative — Personal Care and Service — Sales and Related — Transportation and Logistics Industry Industries n Information and Communication Technology.........27% n Mobility..............................................................18% n Energy...............................................................15% n Basic and Infrastructure......................................14% n Professional Services..........................................11% n Consumer............................................................6% n Others................................................................10% Number of Employees Professional Services 5.00% Consumer Ease of Recruitment 2020 CURRENT Occupation types Mass Employment Database and Network Professionals Strategic/Specialist Software and Applications Developers and Analysts 2% 20% 41% 37% Up to 500 500– 5,000 5,000– 50,000 More than 50,000 New and Emerging Data Analysts Country/region Sample average Country/region Sample average neutral hard neutral neutral hard hard harder harder — — hard hard N/A l Growing l Declining l Stable . Country Profile India Drivers of Change Change Management and Future Workforce Planning Top Trends Impacting Industries Changing nature of work, flexible work Climate change, natural resources 40% Processing power, Big Data 33% Mobile internet, cloud technology 27% Middle class in emerging markets 27% New energy supplies and technologies 23% Young demographics in emerging markets 17% Women’s economic power, aspirations Barriers 43% 17% Insufficient understanding of disruptive changes................................... 68% Resource constraints........................................................................... 48% Pressure from shareholders, short-term profitability.............................. 40% Workforce strategy not aligned to innovation strategy...........................
28% Insufficient priority by line management............................................... 24% 76% believe future workforce planning is a leadership priority Strategies Invest in reskilling current employees 8% 69% 23% Impact already felt 2015– 2017 2018– 2020 107 | The Future of Jobs Report 2021– 2025 28% Target female talent 24% Attract foreign talent 12% Target minorities’ talent 12% Offer apprenticeships 8% Collaborate, other companies across industries Expected Impact on Employment Outlook: Positive 48% Collaborate, educational institutions Expected Time to Impact on Employee Skills 48% Support mobility and job rotation Disruption in Focus: Changing Nature of Work, Flexible Work 8% 60% are confident strategies are suitable . 108 | The Future of Jobs Report Country Profile Italy Workforce Disruption Sample Overview Main Industries Employment Outlook by Main Job Family CURRENT Current workforce (thousands) 2020 Employment outlook, 2015–2020 Local share of recruitment, specialists Ease of recruitment, overall Local share of recruitment, specialists Ease of recruitment, overall Mobility stable 0.18% 76–100% hard 51–75% easier Basic and Infrastructure stable –0.58% 51–75% hard 51–75% neutral Consumer decline –1.82% 76–100% hard 51–75% harder Information and Communication Technology stable 0.56% 76–100% hard — harder Energy growth 1.67% 51–75% hard 26–50% easier Industries n Mobility..............................................................29% n Basic and Infrastructure......................................26% n Consumer..........................................................24% n Information and Communication Technology.........10% n Energy.................................................................6% n Others..................................................................5% 2,411 Sales and Related 2,304 Office and Administrative 2,025 Transportation and Logistics 1,574 Manufacturing and Production 1,339 Construction and Extraction 1,306 Business, Legal and Financial 1,143 Management 1,097 Industry Installation and Maintenance 980 Number of Employees 873 Ease of Recruitment 2020 CURRENT Occupation types Mass Employment Assembly and Factory Workers Strategic/Specialist Electrotechnology Engineers 27% 52% 9% 12% Up to 500 500– 5,000 5,000– 50,000 More than 50,000 New and Emerging Materials Engineers Country/region Sample average Country/region hard neutral neutral hard hard neutral harder — — very hard hard Computer, Mathematical and Science 683 Arts, Design, Entertainment, Sports, and Media 645 Education and Training 510 Architecture and Engineering Sample average neutral Farming, Fishing and Forestry N/A l Growing l Declining l Stable Not shown: Social and Protective Services (1,511), Healthcare Practitioners (632), Hospitality and Food Related (1,303), Personal Care and Service (1,706) . Country Profile Italy Drivers of Change Change Management and Future Workforce Planning Top Trends Impacting Industries Changing nature of work, flexible work New energy supplies and technologies 46% Climate change, natural resources 42% Middle class in emerging markets 23% Geopolitical volatility 23% Robotics, autonomous transport 23% Mobile internet, cloud technology 15% Consumer ethics, privacy issues Barriers 46% 15% Pressure from shareholders, short-term profitability.............................. 46% Resource constraints........................................................................... 38% Insufficient understanding of disruptive changes................................... 33% Workforce strategy not aligned to innovation strategy...........................
29% Insufficient priority by top management................................................ 29% 63% believe future workforce planning is a leadership priority Strategies Invest in reskilling current employees 25% 58% 17% Impact already felt 2015– 2017 2018– 2020 109 | The Future of Jobs Report 2021– 2025 38% Support mobility and job rotation 29% Offer apprenticeships 17% Collaborate, other companies in industry 17% Hire more short-term workers 17% Target female talent Expected Impact on Employment Outlook: Negative 42% Collaborate, educational institutions Expected Time to Impact on Employee Skills 50% Attract foreign talent Disruption in Focus: Changing Nature of Work, Flexible Work 13% 46% are confident strategies are suitable . 110 | The Future of Jobs Report Country Profile Japan Workforce Disruption Sample Overview Main Industries Employment Outlook by Main Job Family CURRENT Current workforce (thousands) 2020 Employment outlook, 2015–2020 Local share of recruitment, specialists Ease of recruitment, overall Local share of recruitment, specialists Ease of recruitment, overall Information and Communication Technology growth 2.78% 51–75% hard 76–100% harder Professional Services stable 0.00% 76–100% hard 51–75% harder Basic and Infrastructure stable 0.20% 51–75% hard 51–75% harder Media, Entertainment and Information stable 0.00% 51–75% very hard 76–100% harder Financial Services & Investors decline 76–100% hard 76–100% harder 76–100% hard 76–100% harder n Information and Communication Technology.........22% n Professional Services..........................................19% n Basic and Infrastructure......................................19% n Media, Entertainment and Information...................9% n Consumer............................................................8% n Financial Services & Investors...............................8% n Others................................................................15% Number of Employees Consumer 2020 CURRENT Occupation types 14% 48% 14% Up to 500 500– 5,000 5,000– 50,000 More than 50,000 Sample average Country/region hard harder neutral hard hard harder — hard 4,694 Manufacturing and Production 3,091 Farming, Fishing and Forestry 2,926 Construction and Extraction 2,546 Installation and Maintenance Business, Legal and Financial Management Computer, Mathematical and Science 1,671 Education and Training Arts, Design, Entertainment, Sports, and Media Architecture and Engineering harder — Transportation and Logistics Sample average hard Strategic/Specialist Electrotechnology Engineers 24% Country/region Mass Employment Sales Representatives, Wholesale and Technical Products 6,431 1,428 Ease of Recruitment Office and Administrative 1,507 decline –4.44% 8,201 2,173 –3.00% Sales and Related 2,308 Industries 8,246 2,443 Industry hard New and Emerging Personal Care Workers in Health Services N/A l Growing l Declining l Stable Not shown: Social and Protective Services (4,683), Healthcare Practitioners (1,230), Hospitality and Food Related (4,205), Personal Care and Service (4,507) . Country Profile Japan Drivers of Change Change Management and Future Workforce Planning Top Trends Impacting Industries Changing nature of work, flexible work Mobile internet, cloud technology 47% Internet of Things 26% Longevity, ageing societies 21% Middle class in emerging markets 18% Climate change, natural resources 16% Processing power, Big Data 16% New energy supplies and technologies Barriers 50% 16% Resource constraints........................................................................... 69% Workforce strategy not aligned to innovation strategy........................... 49% Insufficient understanding of disruptive changes................................... 43% Pressure from shareholders, short-term profitability..............................
43% Don’t know......................................................................................... 29% 86% believe future workforce planning is a leadership priority Strategies Invest in reskilling current employees Expected Impact on Employment Outlook: Neutral 24% 41% 29% 6% Impact already felt 2015– 2017 2018– 2020 2021– 2025 111 | The Future of Jobs Report 34% Attract foreign talent Expected Time to Impact on Employee Skills 54% Support mobility and job rotation Disruption in Focus: Changing Nature of Work, Flexible Work 23% Target female talent 23% Offer apprenticeships 14% Collaborate, other companies across industries 14% Collaborate, other companies in industry 11% Hire more short-term workers 9% 43% are confident strategies are suitable . 112 | The Future of Jobs Report Country Profile Mexico Workforce Disruption Sample Overview Main Industries Employment Outlook by Main Job Family CURRENT Current workforce (thousands) 2020 Employment outlook, 2015–2020 Local share of recruitment, specialists Ease of recruitment, overall Local share of recruitment, specialists Ease of recruitment, overall Consumer stable 0.00% 76–100% hard 76–100% harder Mobility growth 1.54% 51–75% hard 26–50% harder Financial Services & Investors growth 4.00% 76–100% hard 51–75% harder Basic and Infrastructure growth 2.92% 76–100% neutral — harder Information and Communication Technology growth 76–100% hard — easier Energy growth 1.88% 76–100% hard 76–100% easier n Consumer..........................................................27% n Mobility..............................................................18% n Basic and Infrastructure......................................12% n Financial Services & Investors.............................12% n Information and Communication Technology...........8% n Energy.................................................................7% n Others................................................................16% Number of Employees Ease of Recruitment 2020 CURRENT Occupation types Mass Employment Assembly and Factory Workers Strategic/Specialist Business Services and Administration Managers 12% 18% 39% 31% Up to 500 500– 5,000 5,000– 50,000 More than 50,000 New and Emerging Food Processing and Related Trades Workers Country/region Sample average Country/region hard neutral neutral hard hard harder harder — — hard Farming, Fishing and Forestry 4,489 Sales and Related 3,773 Manufacturing and Production 3,255 Office and Administrative 2,566 Construction and Extraction 2,257 Management Installation and Maintenance Business, Legal and Financial Computer, Mathematical and Science Sample average neutral 5,038 1,031 2.50% Transportation and Logistics 1,388 Industries 5,536 1,815 Industry hard 775 Education and Training 770 Arts, Design, Entertainment, Sports, and Media 633 Architecture and Engineering N/A l Growing l Declining l Stable Not shown: Social and Protective Services (3,565), Healthcare Practitioners (681), Hospitality and Food Related (3,834), Personal Care and Service (5,886) . Country Profile Mexico Drivers of Change Change Management and Future Workforce Planning Top Trends Impacting Industries Changing nature of work, flexible work Mobile internet, cloud technology 33% Middle class in emerging markets 31% Climate change, natural resources 25% Processing power, Big Data 25% New energy supplies and technologies 19% Geopolitical volatility 17% Internet of Things Barriers 42% 14% Insufficient understanding of disruptive changes................................... 63% Pressure from shareholders, short-term profitability.............................. 57% Resource constraints........................................................................... 53% Workforce strategy not aligned to innovation strategy...........................
30% Don’t know......................................................................................... 27% 80% believe future workforce planning is a leadership priority Strategies Invest in reskilling current employees Expected Impact on Employment Outlook: Positive 38% 46% 8% 8% Impact already felt 2015– 2017 2018– 2020 2021– 2025 113 | The Future of Jobs Report 30% Support mobility and job rotation Expected Time to Impact on Employee Skills 40% Target female talent Disruption in Focus: Changing Nature of Work, Flexible Work 27% Offer apprenticeships 23% Collaborate, educational institutions 23% Target minorities’ talent 20% Attract foreign talent 17% Collaborate, other companies across industries 13% 63% are confident strategies are suitable . 114 | The Future of Jobs Report Country Profile South Africa Workforce Disruption Sample Overview Main Industries Employment Outlook by Main Job Family CURRENT Current workforce (thousands) 2020 Employment outlook, 2015–2020 Local share of recruitment, specialists Ease of recruitment, overall Local share of recruitment, specialists Ease of recruitment, overall Financial Services & Investors growth 1.25% 76–100% hard 51–75% neutral Basic and Infrastructure decline –3.79% 51–75% hard 51–75% harder Information and Communication Technology decline –3.75% 76–100% hard 76–100% neutral Mobility growth 2.78% 76–100% hard — harder Professional Services decline — easy — harder — neutral — neutral Industry Industries n Financial Services & Investors.............................35% n Basic and Infrastructure......................................28% n Information and Communication Technology.........11% n Mobility..............................................................10% n Professional Services............................................7% n Consumer............................................................5% n Others..................................................................5% 1,609 Sales and Related 1,562 Transportation and Logistics 1,530 Management 1,444 Office and Administrative 1,152 Manufacturing and Production Number of Employees decline –2.00% 2020 CURRENT Occupation types 0% 11% 49% 40% 500– 5,000 5,000– 50,000 More than 50,000 Sample average Country/region hard neutral neutral hard hard neutral harder — — very hard hard Farming, Fishing and Forestry Installation and Maintenance Business, Legal and Financial Computer, Mathematical and Science 219 Arts, Design, Entertainment, Sports, and Media 186 Education and Training 137 Architecture and Engineering Sample average hard Strategic/Specialist Sales and Marketing Professionals Up to 500 Country/region Mass Employment Assembly and Factory Workers 705 259 Ease of Recruitment Construction and Extraction 458 Consumer 896 652 –1.25% New and Emerging Data Analysts N/A l Growing l Declining l Stable Not shown: Social and Protective Services (808), Healthcare Practitioners (218), Hospitality and Food Related (894), Personal Care and Service (1,596) . Country Profile South Africa Drivers of Change Change Management and Future Workforce Planning Top Trends Impacting Industries Processing power, Big Data Changing nature of work, flexible work 34% Middle class in emerging markets 31% Mobile internet, cloud technology 25% Geopolitical volatility 25% Climate change, natural resources 22% Sharing economy, crowdsourcing 22% New energy supplies and technologies Barriers 38% 19% Insufficient understanding of disruptive changes................................... 68% Resource constraints........................................................................... 52% Workforce strategy not aligned to innovation strategy........................... 44% Pressure from shareholders, short-term profitability..............................
36% Insufficient priority by line management............................................... 28% 60% believe future workforce planning is a leadership priority Strategies Invest in reskilling current employees Expected Impact on Employment Outlook: Negative 50% 50% Impact already felt 2015– 2017 115 | The Future of Jobs Report 32% Support mobility and job rotation Expected Time to Impact on Employee Skills 56% Target female talent Disruption in Focus: Processing power, Big Data 32% Attract foreign talent 16% Offer apprenticeships 12% Collaborate, educational institutions 12% Target minorities’ talent 12% Collaborate, other companies across industries 2018– 2020 2021– 2025 4% 44% are confident strategies are suitable . 116 | The Future of Jobs Report Country Profile Turkey Workforce Disruption Sample Overview Main Industries Employment Outlook by Main Job Family CURRENT Current workforce (thousands) 2020 Employment outlook, 2015–2020 Local share of recruitment, specialists Ease of recruitment, overall Local share of recruitment, specialists Ease of recruitment, overall Media, Entertainment and Information stable 0.00% 51–75% very hard 51–75% harder Financial Services & Investors growth 4.62% 51–75% hard 26–50% neutral Consumer growth 4.00% 76–100% hard 76–100% harder Mobility growth 1.00% 76–100% hard 76–100% harder 2,450 Transportation and Logistics 2,003 Manufacturing and Production 1,979 Sales and Related 1,636 Management Office and Administrative 1,594 n Media, Entertainment and Information.................31% n Financial Services & Investors.............................29% n Mobility..............................................................10% n Consumer..........................................................10% n Others................................................................20% Farming, Fishing and Forestry Construction and Extraction 1,318 Industries 5,053 1,628 Industry Installation and Maintenance 665 Number of Employees 582 Ease of Recruitment 2020 CURRENT Occupation types Up to 500 6% 500– 5,000 35% 35% 5,000– 50,000 More than 50,000 Sample average Country/region hard neutral neutral very hard hard harder harder — — hard hard Computer, Mathematical and Science 446 Education and Training 406 Arts, Design, Entertainment, Sports, and Media 380 Architecture and Engineering Sample average hard Strategic/Specialist Assembly and Factory Workers 24% Country/region Mass Employment Assembly and Factory Workers Business, Legal and Financial New and Emerging Nanosystems Engineers N/A l Growing l Declining l Stable Not shown: Social and Protective Services (1,554), Healthcare Practitioners (334), Hospitality and Food Related (1,596), Personal Care and Service (2,309) . Country Profile Turkey Drivers of Change Change Management and Future Workforce Planning Top Trends Impacting Industries Changing nature of work, flexible work Mobile internet, cloud technology 33% Middle class in emerging markets 33% Geopolitical volatility 33% Young demographics in emerging markets 27% Climate change, natural resources 20% Processing power, Big Data 20% Sharing economy, crowdsourcing Barriers 47% 20% Insufficient understanding of disruptive changes................................... 50% Resource constraints........................................................................... 50% Pressure from shareholders, short-term profitability.............................. 50% Workforce strategy not aligned to innovation strategy...........................
50% Don’t know......................................................................................... 36% 64% believe future workforce planning is a leadership priority Strategies Invest in reskilling current employees Expected Impact on Employment Outlook: Positive 14% 57% 29% Impact already felt 2015– 2017 2018– 2020 117 | The Future of Jobs Report 36% Target female talent Expected Time to Impact on Employee Skills 71% Support mobility and job rotation Disruption in Focus: Changing Nature of Work, Flexible Work 29% Offer apprenticeships 29% Collaborate, educational institutions 21% Attract foreign talent 14% Hire more short-term workers 14% Collaborate, other companies across industries 2021– 2025 50% are confident strategies are suitable 7% . 118 | The Future of Jobs Report Country Profile United Kingdom Workforce Disruption Sample Overview Main Industries Employment Outlook by Main Job Family CURRENT Current workforce (thousands) 2020 Employment outlook, 2015–2020 Local share of recruitment, specialists Ease of recruitment, overall Local share of recruitment, specialists Ease of recruitment, overall Professional Services stable 0.16% 51–75% neutral 26–50% neutral Financial Services & Investors stable 0.00% 76–100% neutral 51–75% harder Media, Entertainment and Information growth 2.50% 76–100% hard 51–75% harder Information and Communication Technology growth 1.36% 51–75% hard 51–75% harder Energy growth 26–50% hard 0–25% harder — neutral — neutral n Professional Services..........................................32% n Financial Services & Investors.............................16% n Media, Entertainment and Information.................15% n Information and Communication Technology.........14% n Energy...............................................................12% n Basic and Infrastructure........................................4% n Others..................................................................6% Number of Employees Basic and Infrastructure decline –1.00% Ease of Recruitment 2020 CURRENT Occupation types Mass Employment Client Information and Customer Service Workers Strategic/Specialist Lawyers 10% 13% 32% 45% Up to 500 500– 5,000 5,000– 50,000 More than 50,000 New and Emerging Software and Applications Developers and Analysts Country/region Sample average Country/region hard neutral neutral hard hard harder — neutral 2,445 Office and Administrative 2,111 Transportation and Logistics 1,981 Business, Legal and Financial 1,808 Computer, Mathematical and Science 1,463 Manufacturing and Production Education and Training Arts, Design, Entertainment, Sports, and Media Architecture and Engineering 1,192 Construction and Extraction harder — Sales and Related Sample average neutral 2,846 1,198 2.69% Management 1,241 Industries 3,599 1,394 Industry hard 935 Installation and Maintenance 900 Farming, Fishing and Forestry N/A l Growing l Declining l Stable Not shown: Social and Protective Services (2,294), Healthcare Practitioners (1,002), Hospitality and Food Related (1,855), Personal Care and Service (2,218) . Country Profile United Kingdom Drivers of Change Change Management and Future Workforce Planning Top Trends Impacting Industries Mobile internet, cloud technology Changing nature of work, flexible work 45% Processing power, Big Data 40% Middle class in emerging markets 30% Geopolitical volatility 23% New energy supplies and technologies 17% Climate change, natural resources 15% Internet of Things Barriers 49% 13% Insufficient understanding of disruptive changes................................... 62% Resource constraints........................................................................... 55% Pressure from shareholders, short-term profitability.............................. 45% Workforce strategy not aligned to innovation strategy...........................
36% Insufficient priority by top management................................................ 24% 76% believe future workforce planning is a leadership priority Strategies Invest in reskilling current employees 78% 17% Impact already felt 2015– 2017 119 | The Future of Jobs Report 4% 2018– 2020 2021– 2025 36% Offer apprenticeships 19% Collaborate, educational institutions 17% Attract foreign talent 17% Target minorities’ talent 12% Hire more short-term workers Expected Impact on Employment Outlook: Neutral 38% Target female talent Expected Time to Impact on Employee Skills 48% Support mobility and job rotation Disruption in Focus: Mobile internet, cloud technology 5% 57% are confident strategies are suitable . 120 | The Future of Jobs Report Country Profile United States Workforce Disruption Sample Overview Main Industries Employment Outlook by Main Job Family CURRENT Current workforce (thousands) 2020 Employment outlook, 2015–2020 Local share of recruitment, specialists Ease of recruitment, overall Local share of recruitment, specialists Ease of recruitment, overall Professional Services growth 1.77% 51–75% neutral 26–50% harder Financial Services & Investors growth 2.76% 51–75% hard 26–50% neutral Information and Communication Technology stable 0.43% 26–50% neutral 26–50% neutral Basic and Infrastructure stable 0.21% 51–75% hard 26–50% harder Healthcare decline 51–75% hard 26–50% harder 26–50% hard 26–50% neutral Industry Industries 22,766 Office and Administrative 15,423 Sales and Related Number of Employees Energy decline –2.35% 2020 CURRENT Occupation types Country/region Sample average Country/region hard neutral neutral Strategic/Specialist Data Analysts hard hard harder harder New and Emerging Data Analysts — — hard hard Mass Employment Assembly and Factory Workers 12% 12% 36% 40% Up to 500 500– 5,000 5,000– 50,000 More than 50,000 9,216 Education and Training 9,158 Management 8,834 Business, Legal and Financial Construction and Extraction Installation and Maintenance Computer, Mathematical and Science 2,624 Arts, Design, Entertainment, Sports, and Media 2,533 Architecture and Engineering 972 Farming, Fishing and Forestry Sample average neutral Manufacturing and Production 5,379 Ease of Recruitment 9,230 6,502 –2.14% Transportation and Logistics 5,681 n Professional Services..........................................21% n Financial Services & Investors.............................17% n Information and Communication Technology.........13% n Basic and Infrastructure......................................13% n Healthcare.........................................................11% n Energy.................................................................9% n Others................................................................15% 9,749 N/A l Growing l Declining l Stable Not shown: Social and Protective Services (5,909), Healthcare Practitioners (8,236), Hospitality and Food Related (12468), Personal Care and Service (11,623) . Country Profile United States Drivers of Change Change Management and Future Workforce Planning Top Trends Impacting Industries Changing nature of work, flexible work Mobile internet, cloud technology 34% Middle class in emerging markets 33% Processing power, Big Data 29% Climate change, natural resources 23% New energy supplies and technologies 21% Geopolitical volatility 20% Sharing economy, crowdsourcing Barriers 38% 16% Insufficient understanding of disruptive changes................................... 60% Resource constraints........................................................................... 55% Pressure from shareholders, short-term profitability.............................. 48% Workforce strategy not aligned to innovation strategy...........................
40% Insufficient priority by line management............................................... 22% 74% believe future workforce planning is a leadership priority Strategies Invest in reskilling current employees 45% 45% 6% Impact already felt 2015– 2017 2018– 2020 121 | The Future of Jobs Report 2021– 2025 26% Attract foreign talent 21% Collaborate, educational institutions 21% Target minorities’ talent 16% Collaborate, other companies across industries 14% Offer apprenticeships Expected Impact on Employment Outlook: Neutral 38% Target female talent Expected Time to Impact on Employee Skills 51% Support mobility and job rotation Disruption in Focus: Changing Nature of Work, Flexible Work 12% 56% are confident strategies are suitable . . Industry Gender Gap Profiles . 124 | The Future of Jobs Report Industry Gender Gap Profile Basic and Infrastructure Workforce Disruption, 2015–2020 Composition by Role and Level Industry Average Percentage of Women STABLE 58% 13% 35% Employment outlook Skills stability Current share of women Gender wage gap HARDER NEUTRAL Relative ease of recruitment, current Relative ease of recruitment, 2020 2% CEOs Main Job Families Employment outlook Job families Manufacturing and Production Assembly and Factory Workers Skills stability Current share of women Gender wage gap Relative ease of recruiting women, current 62% 9% 42% much harder harder stable 0.73% 59% 11% 19% harder neutral decline –2.18% 72% 9% 38% much harder harder stable 0.41% 44% 11% 64% harder Board Members Relative ease of recruiting women, 2020 decline –1.84% 35% neutral Chemical Processing Plant Operators Architecture and Engineering Chemical Engineers Current Expected in 2020 Civil Engineers Construction and Extraction Mining and Petroleum Extraction Workers Construction Laborers Management Business Services and Administration Managers 22% Job Family in Focus: Management ⬆ Job family with largest share of women Compensation ⬇ Job security ⬆ Work-life balance 13% 9% 29% 21% 17% Junior level Manufacturing, Mining and Construction Managers Middle level Senior level Junior level Middle level Senior level 14% 20% 23% 27% Line roles Staff roles Line roles Staff roles . Industry Gender Gap Profile Basic and Infrastructure Companies’ Rationales for Gender Parity Companies’ Approaches to Leveraging Female Talent Fairness and equality 39% Barriers Enhance innovation 33% Unconscious bias among managers.............................................................. 50% External pressuresreputation 28% Lack of role models..................................................................................... 44% Government regulation 22% Lack of work-life balance............................................................................. 42% Enhance decision-making 19% Lack of qualified incoming talent..................................................................
33% No rationale 17% Reflect gender composition of customer base 14% 10% Perceive women’s economic power, aspirations as a driver of change Women’s confidence, aspirations.................................................................. 28% 35% Perceive attracting female talent as a key future workforce strategy 35% Perceive a gender wage gap for equally qualified employees in the same role Strategies Set targets and measure progress 46% Build awareness of the benefits among managers 41% Development and leadership training of women 28% 26% 30% 18% 24% Current 2020 Current 2020 Business-to-consumer 21% of total customers Business-to-government 20% of total customers 24% No strategy 2020 27% Offer, support flexible work 16% 32% Demonstrate leadership commitment Current 35% Promote work-life balance 125 | The Future of Jobs Report believe that gender parity is a leadership priority Unclear career paths.................................................................................... 31% Female Share of Customer Base Business-to-business 58% of total customers 50% 22% Don’t know 19% 58% are confident strategies are suitable .
126 | The Future of Jobs Report Industry Gender Gap Profile Consumer Workforce Disruption, 2015–2020 Composition by Role and Level Industry Average Percentage of Women STABLE 70% 27% 49% HARDER HARDER Employment outlook Skills stability Current share of women Gender wage gap Relative ease of recruitment, current Relative ease of recruitment, 2020 10% CEOs Main Job Families Employment outlook Job families Manufacturing and Production Assembly and Factory Workers Skills stability Current share of women Gender wage gap Relative ease of recruiting women, current 62% 22% 43% harder harder stable 0.83% 78% 52% 47% harder harder stable –0.88% 67% 44% 83% harder neutral decline –1.00% 70% 22% 50% harder Board Members Relative ease of recruiting women, 2020 decline –3.57% 21% harder Food Processing and Related Trades Workers Sales and Related Shop Salespersons Current Expected in 2020 Sales Representatives, Wholesale and Technical Business and Financial Operations Sales and Marketing Professionals Management and Organisation Analysts Management General and Operations Managers 33% Job Family in Focus: Sales and Related ⬆ Job family with largest share of women Compensation ⬇ Job security ⬌ Work-life balance 26% 16% 37% 33% 24% Junior level Business Services and Administration Managers Middle level Senior level Junior level Middle level Senior level 31% 37% 34% 41% Line roles Staff roles Line roles Staff roles . Industry Gender Gap Profile Consumer Companies’ Rationales for Gender Parity Companies’ Approaches to Leveraging Female Talent Fairness and equality 75% Barriers Reflect gender composition of customer base 35% Lack of work-life balance............................................................................. 70% Expand talent pool 30% Unconscious bias among managers.............................................................. 55% Enhance innovation 20% Lack of role models..................................................................................... 40% External pressuresreputation 20% Unclear career paths....................................................................................
30% Enhance decision-making 15% Financial returns 10% 21% Perceive women’s economic power, aspirations as a driver of change Societal pressures....................................................................................... 25% 25% Perceive attracting female talent as a key future workforce strategy 49% Perceive a gender wage gap for equally qualified employees in the same role Strategies Promote work-life balance 50% Development and leadership training of women 45% Build awareness of the benefits among managers 40% Set targets and measure progress 18% 47% 49% 11% 15% 2020 Current 2020 Current 2020 Business-to-consumer 65% of total customers Business-to-government 11% of total customers 25% Offer, support flexible work 14% 30% Demonstrate leadership commitment Current 30% Transparent career paths, salary structures 127 | The Future of Jobs Report believe that gender parity is a leadership priority Women’s confidence, aspirations.................................................................. 30% Female Share of Customer Base Business-to-business 24% of total customers 60% 25% Support women’s integration into the value chain 25% 55% are confident strategies are suitable .
128 | The Future of Jobs Report Industry Gender Gap Profile Energy Workforce Disruption, 2015–2020 Composition by Role and Level Industry Average Percentage of Women STABLE 70% 15% 31% Employment outlook Skills stability Current share of women Gender wage gap HARDER NEUTRAL Relative ease of recruitment, current Relative ease of recruitment, 2020 0% CEOs Main Job Families Employment outlook Job families Architecture and Engineering Energy and Petroleum Engineers Skills stability Current share of women Gender wage gap Relative ease of recruiting women, current 65% 11% 33% harder neutral decline –3.11% 62% 22% 23% harder neutral growth 2.06% 92% 16% 50% harder easier decline –1.15% 100% 15% 20% harder Board Members Relative ease of recruiting women, 2020 growth 1.70% 32% harder Electrotechnology Engineers Manufacturing and Production Assembly and Factory Workers Current Expected in 2020 Petroleum and Natural Gas Refining Plant Operators Management General and Operations Managers Business Services and Administration Managers Construction and Extraction Mining and Petroleum Extraction Workers 24% Job Family in Focus: Manufacturing and Production ⬆ Job family with largest share of women Compensation ⬇ Job security ⬆ Work-life balance 19% 11% 27% 27% 20% Junior level Mining and Petroleum Plant Operators Middle level Senior level Junior level Middle level Senior level 19% 22% 25% 30% Line roles Staff roles Line roles Staff roles . Industry Gender Gap Profile Energy Companies’ Rationales for Gender Parity Companies’ Approaches to Leveraging Female Talent Fairness and equality 50% Barriers Enhance decision-making 45% Unconscious bias among managers.............................................................. 70% Reflect gender composition of customer base 40% Lack of qualified incoming talent.................................................................. 60% Expand talent pool 25% Lack of role models..................................................................................... 55% Enhance innovation 20% Lack of work-life balance.............................................................................
30% Government regulation 15% Demand by employees 10% 13% Perceive women’s economic power, aspirations as a driver of change Don’t know.................................................................................................. 15% 36% Perceive attracting female talent as a key future workforce strategy 31% Perceive a gender wage gap for equally qualified employees in the same role Strategies Demonstrate leadership commitment 45% Set targets and measure progress 40% Development and leadership training of women 35% Build awareness of the benefits among managers 30% Transparent career paths, salary structures 25% Offer, support flexible work 25% Support women’s integration into the value chain 25% 18% 23% 26% 26% 18% 19% Current 2020 Current 2020 Current 2020 129 | The Future of Jobs Report believe that gender parity is a leadership priority Societal pressures....................................................................................... 25% Female Share of Customer Base Business-to-business 51% of total customers 75% Business-to-consumer 19% of total customers Business-to-government 21% of total customers Promote work-life balance 15% 65% are confident strategies are suitable .
130 | The Future of Jobs Report Industry Gender Gap Profile Financial Services & Investors Workforce Disruption, 2015–2020 Composition by Role and Level Industry Average Percentage of Women GROWTH 57% 29% 38% Employment outlook Skills stability Current share of women Gender wage gap HARDER NEUTRAL Relative ease of recruitment, current Relative ease of recruitment, 2020 9% CEOs Main Job Families Employment outlook Job families Business and Financial Operations Financial and Investment Advisers Skills stability Current share of women Gender wage gap Relative ease of recruiting women, current 63% 36% 36% harder neutral growth 4.50% 60% 35% 27% harder harder stable –0.68% 70% 38% 63% harder easier growth 2.20% 48% 26% 7% harder Board Members Relative ease of recruiting women, 2020 stable 0.79% 35% neutral Investment Fund Managers Computer and Mathematical Data Analysts Current Expected in 2020 Information Security Analysts Sales and Related Securities and Finance Dealers and Brokers Sales and Purchasing Agents and Brokers Management General and Operations Managers 43% Job Family in Focus: Sales and Related ⬇ Job family with largest share of women Compensation ⬇ Job security ⬌ Work-life balance 33% 20% 43% 40% 30% Junior level Business Services and Administration Managers Middle level Senior level Junior level Middle level Senior level 35% 42% 39% 43% Line roles Staff roles Line roles Staff roles . Industry Gender Gap Profile Financial Services & Investors Companies’ Rationales for Gender Parity Companies’ Approaches to Leveraging Female Talent Fairness and equality 60% Barriers Reflect gender composition of customer base 43% Lack of work-life balance............................................................................. 53% Enhance innovation 43% Lack of role models..................................................................................... 47% Enhance decision-making 30% Women’s confidence, aspirations.................................................................. 43% Expand talent pool 23% Unconscious bias among managers..............................................................
37% Financial returns 17% Government regulation 13% 9% Perceive women’s economic power, aspirations as a driver of change Unclear career paths.................................................................................... 20% 30% Perceive attracting female talent as a key future workforce strategy 38% Perceive a gender wage gap for equally qualified employees in the same role Strategies Offer, support flexible work 43% Promote work-life balance 43% Demonstrate leadership commitment 37% Set targets and measure progress 33% Development and leadership training of women 30% Transparent career paths, salary structures 23% Build awareness of the benefits among managers 20% 20% 32% 40% 41% 16% 27% Current 2020 Current 2020 Current 2020 131 | The Future of Jobs Report believe that gender parity is a leadership priority Lack of talent, leadership development for women........................................ 23% Female Share of Customer Base Business-to-business 37% of total customers 63% Business-to-consumer 39% of total customers Business-to-government 16% of total customers No strategy 20% 70% are confident strategies are suitable .
132 | The Future of Jobs Report Industry Gender Gap Profile Healthcare Workforce Disruption, 2015–2020 Composition by Role and Level Industry Average Percentage of Women STABLE 71% 38% 15% Employment outlook Skills stability Current share of women Gender wage gap NEUTRAL NEUTRAL Relative ease of recruitment, current Relative ease of recruitment, 2020 6% CEOs Main Job Families Employment outlook Job families Manufacturing and Production Chemical Processing Plant Operators Skills stability Current share of women Gender wage gap Relative ease of recruiting women, current 85% 42% 0% neutral neutral stable -0.71% 100% 40% 0% neutral neutral decline –1.82% 70% 63% 25% harder neutral — — 85% — easier Board Members Relative ease of recruiting women, 2020 stable 0.79% — harder Assembly and Factory Workers Life, Physical, and Social Sciences Biologists and Geneticists Current Expected in 2020 Chemists and Chemical Laboratory Scientists Sales and Related Shop Salespersons Sales Representatives, Technical and Scientific Personal Care and Service Personal Care Aides 39% 31% 15% 46% 44% 28% Junior level Middle level Senior level Junior level Middle level Senior level Job Family in Focus: Personal Care and Service Job family with largest share of women — — — 44% 41% 49% 48% Compensation Job security Work-life balance Line roles Staff roles Line roles Staff roles . Industry Gender Gap Profile Healthcare Companies’ Rationales for Gender Parity Companies’ Approaches to Leveraging Female Talent Fairness and equality 50% Barriers Reflect gender composition of customer base 40% Unconscious bias among managers.............................................................. 50% Enhance innovation 40% Lack of role models..................................................................................... 50% 30% Lack of qualified incoming talent.................................................................. 40% Enhance decision-making Don’t know..................................................................................................
30% 60% believe that gender parity is a leadership priority Lack of work-life balance............................................................................. 20% Societal pressures....................................................................................... 20% 10% Perceive women’s economic power, aspirations as a driver of change 17% Perceive attracting female talent as a key future workforce strategy 15% Perceive a gender wage gap for equally qualified employees in the same role Strategies Set targets and measure progress 50% Offer, support flexible work 40% Build awareness of the benefits among managers 40% Female Share of Customer Base 60% are confident strategies are suitable 50% 43% 57% 57% 60% 60% Current 2020 Current 2020 Current 2020 Business-to-business 51% of total customers 133 | The Future of Jobs Report Business-to-consumer 31% of total customers Business-to-government 18% of total customers .
134 | The Future of Jobs Report Industry Gender Gap Profile Information and Communication Technology Workforce Disruption, 2015–2020 Composition by Role and Level Industry Average Percentage of Women STABLE 65% 21% 25% HARDER HARDER Employment outlook Skills stability Current share of women Gender wage gap Relative ease of recruitment, current Relative ease of recruitment, 2020 5% CEOs Main Job Families Employment outlook Job families Computer and Mathematical Database and Network Professionals Skills stability Current share of women Gender wage gap Relative ease of recruiting women, current 63% 20% 33% harder harder growth 2.14% 64% 44% 25% harder neutral decline –1.19% 54% 9% 30% harder neutral 77% 7% 8% harder Board Members Relative ease of recruiting women, 2020 growth 1.74% 19% harder Software and Applications Developers and Analysts Sales and Related Telemarketers Current Expected in 2020 Sales Representatives, Wholesale and Technical Installation and Maintenance Mechanics and Machinery Repairers Electronics and Telecommunications Installers and Repairers Architecture and Engineering Electrotechnology Engineers growth 4.12% 32% Job Family in Focus: Sales and Related ⬆ Job family with largest share of women Compensation ⬆ Job security ⬆ Work-life balance 21% 11% 34% 29% 20% Junior level Architects and Surveyors Middle level Senior level Junior level Middle level Senior level 23% 33% 32% 38% Line roles Staff roles Line roles Staff roles . Industry Gender Gap Profile Information and Communication Technology Companies’ Rationales for Gender Parity Companies’ Approaches to Leveraging Female Talent Fairness and equality 63% Barriers Expand talent pool 37% Lack of qualified incoming talent.................................................................. 57% Reflect gender composition of customer base 33% Lack of work-life balance............................................................................. 47% External pressuresreputation 33% Unconscious bias among managers.............................................................. 47% Enhance innovation 27% Lack of role models.....................................................................................
37% Enhance decision-making 23% Government regulation 20% 3% Perceive women’s economic power, aspirations as a driver of change Lack of talent, leadership development for women........................................ 27% 16% Perceive attracting female talent as a key future workforce strategy 25% Perceive a gender wage gap for equally qualified employees in the same role Strategies Promote work-life balance 40% Set targets and measure progress 37% Transparent career paths, salary structures 37% Build awareness of the benefits among managers 33% Development and leadership training of women 25% 33% 24% 30% 17% 21% 2020 Current 2020 Current 2020 Business-to-consumer 29% of total customers Business-to-government 18% of total customers 30% Demonstrate leadership commitment Current 33% Offer, support flexible work 135 | The Future of Jobs Report believe that gender parity is a leadership priority Women’s confidence, aspirations.................................................................. 37% Female Share of Customer Base Business-to-business 53% of total customers 37% 30% Support women’s integration into the value chain 20% 47% are confident strategies are suitable .
136 | The Future of Jobs Report Industry Gender Gap Profile Media, Entertainment and Information Workforce Disruption, 2015–2020 Composition by Role and Level Industry Average Percentage of Women GROWTH 73% 30% 18% HARDER EASIER Employment outlook Skills stability Current share of women Gender wage gap Relative ease of recruitment, current Relative ease of recruitment, 2020 13% CEOs Main Job Families Job families Arts, Design, Entertainment, Sports, and Media Advertising and Public Relations Professionals Employment outlook Skills stability Current share of women Gender wage gap Relative ease of recruiting women, current 66% 49% 15% neutral neutral strong growth 6.94% 88% 23% 11% harder easier growth 2.69% 86% 39% 13% harder easier growth 1.67% 67% 12% 33% harder Board Members Relative ease of recruiting women, 2020 stable –0.59% 22% easier Telecommunications and Broadcasting Technicians Computer and Mathematical Data Analysts Current Expected in 2020 Software and Applications Developers and Analysts Sales and Related Cashiers and Ticket Clerks Door-To-Door Sales Workers, News and Street Vendors Management General and Operations Managers 35% Job Family in Focus: Arts, Design, Entertainment, Sports, and Media ⬌ Job family with largest share of women Compensation ⬇ Job security ⬌ Work-life balance 25% 25% 36% 32% 33% Junior level Business Services and Administration Managers Middle level Senior level Junior level Middle level Senior level 38% 47% 43% 46% Line roles Staff roles Line roles Staff roles . Industry Gender Gap Profile Media, Entertainment and Information Companies’ Rationales for Gender Parity Companies’ Approaches to Leveraging Female Talent Enhance innovation 38% Barriers Fairness and equality 31% Lack of work-life balance............................................................................. 54% Reflect gender composition of customer base 31% Unconscious bias among managers.............................................................. 46% Enhance decision-making 31% Lack of role models..................................................................................... 31% Financial returns 31% Don’t know..................................................................................................
31% Expand talent pool 23% External pressuresreputation 15% 7% Perceive women’s economic power, aspirations as a driver of change 46% believe that gender parity is a leadership priority Women’s confidence, aspirations.................................................................. 31% No barriers.................................................................................................. 23% 46% Perceive attracting female talent as a key future workforce strategy 18% Perceive a gender wage gap for equally qualified employees in the same role Strategies Promote work-life balance Build awareness of the benefits among managers 31% Offer, support flexible work Female Share of Customer Base 46% 31% 62% are confident strategies are suitable 20% 32% 48% 44% 15% 19% Current 2020 Current 2020 Current 2020 Business-to-business 41% of total customers 137 | The Future of Jobs Report Business-to-consumer 42% of total customers Business-to-government 11% of total customers .
138 | The Future of Jobs Report Industry Gender Gap Profile Mobility Workforce Disruption, 2015–2020 Composition by Role and Level Industry Average Percentage of Women STABLE 61% 16% 39% Employment outlook Skills stability Current share of women Gender wage gap HARDER NEUTRAL Relative ease of recruitment, current Relative ease of recruitment, 2020 9% CEOs Main Job Families Employment outlook Job families Manufacturing and Production Assembly and Factory Workers Skills stability Current share of women Gender wage gap Relative ease of recruiting women, current 66% 18% 30% harder neutral growth 4.83% 62% 13% 36% harder harder growth 3.13% 63% 13% 13% harder neutral decline –1.88% 40% 16% 33% harder Board Members Relative ease of recruiting women, 2020 decline –1.43% 17% neutral Sheet and Structural Metal Workers Architecture and Engineering Electrotechnology Engineers Current Expected in 2020 Industrial and Production Engineers Transportation and Logistics Supply Chain and Logistics Specialists Transportation Attendants and Conductors Sales and Related Sales and Marketing Professionals 28% Job Family in Focus: Manufacturing and Production ⬆ Job family with largest share of women Compensation ⬇ Job security ⬇ Work-life balance 21% 13% 33% 30% 21% Junior level Sales Representatives, Wholesale and Technical Middle level Senior level Junior level Middle level Senior level 25% 34% 31% 36% Line roles Staff roles Line roles Staff roles . Industry Gender Gap Profile Mobility Companies’ Rationales for Gender Parity Companies’ Approaches to Leveraging Female Talent Fairness and equality 58% Barriers Enhance innovation 33% Lack of qualified incoming talent.................................................................. 63% Enhance decision-making 29% Lack of work-life balance............................................................................. 54% Expand talent pool 29% Lack of role models..................................................................................... 50% Demand by employees 21% Unconscious bias among managers..............................................................
33% Reflect gender composition of customer base 13% External pressures/reputation 13% 6% Perceive women’s economic power, aspirations as a driver of change Women’s confidence, aspirations.................................................................. 29% 21% Perceive attracting female talent as a key future workforce strategy 39% Perceive a gender wage gap for equally qualified employees in the same role Strategies Promote work-life balance 63% Development and leadership training of women 42% Transparent career paths, salary structures 29% Demonstrate leadership commitment 29% Build awareness of the benefits among managers 25% Set targets and measure progress 21% Support women’s integration into the value chain 21% 21% 30% 21% 27% 16% 19% Current 2020 Current 2020 Current 2020 139 | The Future of Jobs Report believe that gender parity is a leadership priority Societal pressures....................................................................................... 33% Female Share of Customer Base Business-to-business 51% of total customers 54% Business-to-consumer 31% of total customers Business-to-government 18% of total customers Offer, support flexible work 17% 58% are confident strategies are suitable .
140 | The Future of Jobs Report Industry Gender Gap Profile Professional Services Workforce Disruption, 2015–2020 Composition by Role and Level Industry Average Percentage of Women STABLE 67% 30% 22% Employment outlook Skills stability Current share of women Gender wage gap HARDER NEUTRAL Relative ease of recruitment, current Relative ease of recruitment, 2020 9% CEOs Main Job Families Employment outlook Job families Business and Financial Operations Management and Organisation Analysts Skills stability Current share of women Gender wage gap Relative ease of recruiting women, current 77% 48% 15% neutral neutral strong growth 5.31% 54% 17% 31% harder harder growth 1.00% 65% 29% 21% harder easier decline –3.21% 54% 56% 8% neutral Board Members Relative ease of recruiting women, 2020 stable 0.33% 23% neutral Human Resources Specialists Computer and Mathematical Data Analysts Current Expected in 2020 Software and Applications Developers and Analysts Management General and Operations Managers Business Services and Administration Managers Sales and Related Sales and Marketing Professionals 39% Job Family in Focus: Sales and Related ⬆ Job family with largest share of women Compensation ⬇ Job security ⬆ Work-life balance 33% 22% 43% 40% 34% Junior level Real Estate Sales Agents Middle level Senior level Junior level Middle level Senior level 44% 44% 44% 46% Line roles Staff roles Line roles Staff roles . Industry Gender Gap Profile Professional Services Companies’ Rationales for Gender Parity Companies’ Approaches to Leveraging Female Talent Fairness and equality 50% Barriers Reflect gender composition of customer base 39% Women’s confidence, aspirations.................................................................. 50% Enhance innovation 25% Lack of work-life balance............................................................................. 42% Enhance decision-making 25% Unconscious bias among managers.............................................................. 42% Financial returns 22% Societal pressures.......................................................................................
39% External pressuresreputation 14% 15% Perceive women’s economic power, aspirations as a driver of change Lack of role models..................................................................................... 31% 21% Perceive attracting female talent as a key future workforce strategy 22% Perceive a gender wage gap for equally qualified employees in the same role Strategies Promote work-life balance 47% Demonstrate leadership commitment 36% Set targets and measure progress 36% Offer, support flexible work 36% Development and leadership training of women Female Share of Customer Base 31% Build awareness of the benefits among managers 25% Don’t know 31% 45% 32% 30% 20% 28% Current 2020 Current 2020 Current 2020 Business-to-business 61% of total customers 141 | The Future of Jobs Report believe that gender parity is a leadership priority Lack of qualified incoming talent.................................................................. 36% 17% No rationale 42% Business-to-consumer 23% of total customers Business-to-government 17% of total customers 17% Support women’s integration into the value chain 14% 50% are confident strategies are suitable .
. Acknowledgements GLOBAL AGENDA COUNCIL ON THE FUTURE OF JOBS GLOBAL AGENDA COUNCIL ON GENDER PARITY Jeffrey Joerres, Executive Chairman Emeritus, ManpowerGroup; Council Chair J. Frank Brown, Managing Director and Chief Operating Officer, General Atlantic LLC; Council Chair Jamie McAuliffe, President and CEO, Education for Employment; Council Vice-Chair Mara Swan, Executive Vice-President, Global Strategy and Talent, ManpowerGroup; Council Vice-Chair Umran Beba, Senior Vice-President and Chief Human Resources Officer, Asia, Middle East and Africa, PepsiCo Inc. Shelley Bird, Executive Vice-President, Cardinal Health Azita Berar Awad, Director, Employment Policy Department, International Labour Organization (ILO) (since June 2015) Ozlem Denizmen, Head, Social Investments, Dogus Group Tan Chorh-Chuan, President, National University of Singapore Natalie Costello, Vice-President, Chartering and Commercial Operations BP Shipping, BP Elaine J. Dorward-King, Executive Vice-President, Sustainability and External Relations, Newmont Mining Corporation Arturo Condo, President, INCAE Business School Valerie Germain, Global Managing Partner, Functional Practices, Heidrick & Struggles, International Inc. Pascaline Descy, Head, Research and Policy Analysis, European Centre for the Development of Vocational Training (CEDEFOP) Rick Goings, Chairman and Chief Executive Officer, Tupperware Brands Corporation John Evans, General Secretary, Trade Union Advisory Committee to the Organisation for Economic Co-operation and Development John Irons, Managing Director, Rockefeller Foundation Herminia Ibarra, Cora Chaired Professor of Leadership and Learning and Professor of Organizational Behaviour, INSEAD Laura Liswood, Secretary-General, Council of Women World Leaders Yoko Ishikura, Professor Emeritus, Hitotsubashi University Meg McCarthy, Executive Vice-President, Innovation, Technology and Service Operations, Aetna Chauncy Lennon, Senior Program Director, Workforce Development, JPMorgan Chase Gagan Singh, Chief Executive Officer, Business, India and Chairman, Sri Lanka Operations, Jones Lang LaSalle, Inc Andrew McAfee, Principal Research Scientist, MIT Center for Digital Business Alexander Türpitz, Partner and Managing Director, The Boston Consulting Group Patricia Milligan, Global Leader, Multinational Client Group, Mercer Laura D’Andrea Tyson, Professor and Director, Haas School of Business, University of California, Berkeley Vikas Pota, Chief Executive, Varkey Foundation Martina Viarengo, Assistant Professor, International Economics, The Graduate Institute of International and Development Studies José Manuel Salazar Xirinachs, Assistant Director-General for Policy, International Labour Organization (ILO) (until June 2015) Stefano Scarpetta, Director for Employment, Labour and Social Affairs, Organisation for Economic Co-operation and Development (OECD) Bettina Schaller Bossert, Director, Group Public Affairs, Adecco Group (since September 2015) Antje Wessel, Head, Global Leadership Transition Program, Bayer AG A special thank you to the Global Agenda Council on Gender Parity. Mohammed Al Sellemi, Director of Human Resources, Saudi Aramco AT THE WORLD ECONOMIC FORUM Hanne Shapiro, Director, Policy and Business Analysis, Danish Technological Institute Richard Samans, Head of the Centre for the Global Agenda; Member of the Managing Board Jennifer Silberman, Vice-President, Corporate Responsibility, Hilton Saadia Zahidi, Head, Gender Parity and Employment Initiatives; Member of the Executive Committee Mark De Smedt, Chief Human Resources Officer, Adecco Group (until September 2015) Till Alexander Leopold, Project Lead, Employment, Skills and Human Capital Initiative; Council Manager Nigel Twose, Senior Director, Jobs Cross-Cutting Solutions Area, World Bank (until September 2015) Vesselina Ratcheva, Data Analyst, Gender Parity and Employment Initiatives Tae Yoo, Senior Vice-President, Cisco A special thank you to the Global Agenda Council on the Future of Jobs. (Cont’d.) The Future of Jobs Report | 143 . We would like to express our deep gratitude to the Chairs and Vice-Chairs of the Global Agenda Council on the Future of Jobs and the Global Agenda Council on Gender Parity, as well as to all Council Members and Global Challenge Partners for their guidance and support in the execution of the Forum’s Future of Jobs Survey. A very special thank you to Jessica Camus and Tamara Leonardi for their excellent work and inputs on the conception phase of this project. We are also grateful for the invaluable support of our colleagues across the Forum in helping to execute the Future of Jobs Survey, and, in particular, to Yasmina Bekhouche, Kristin Keveloh, Paulina Padilla Ugarte, Valerie Peyre, Pearl Samandari, Susan Wilkinson and Lena Woodward. Thank you to Michael Fisher for his superb editorial work, Neil Weinberg for his excellent graphic design and layout and Kamal Kamaoui and the World Economic Forum’s Publications team. We gratefully acknowledge the support and collaboration of Lutz Finger, Jason Schissel and Mario Rodriguez of LinkedIn and use of LinkedIn’s Economic Graph data as well as the financial support of The Rockefeller Foundation in the production of this Report. 144 | The Future of Jobs Report . Contributors Till Alexander Leopold is a Project Lead of the Global Challenge on Employment, Skills and Human Capital at the World Economic Forum. His responsibilities include leadership of the Global Challenge’s insights and analysis workstream, co-authorship of the Forum’s Human Capital Report, codevelopment of the Future of Jobs project and management of the Global Agenda Council on the Future of Jobs and the Global Agenda Council on Gender Parity. He also co-organizes community activities at the World Economic Forum’s Annual Meeting and regional summits. Till previously served as an economist and project manager at the United Nations and International Labour Organization, where his work focused on policy analysis, research and technical cooperation in the field of entrepreneurship and innovation ecosystems, and as a consultant and analyst in the field of impact investing and social entrepreneurship, with particular first-hand experience in SubSaharan Africa and South Asia.
He has co-authored several research reports on inclusive business and private sector development in emerging and frontier markets and moderated workshops on these topics at international development conferences. Till holds Masters degrees in Social Anthropology, Finance and Development Economics from the University of Cambridge and London University’s School of Oriental and African Studies (SOAS). Vesselina Ratcheva is a Data Analyst working in the World Economic Forum’s Human Capital and Gender Parity team. She is responsible for data processing, analysis and visualization.
Vesselina was previously responsible for Data, Research and Evaluation at National Numeracy, a skills charity in the United Kingdom. She has worked on a variety of research projects for the past 10 years, covering international migration, experiences of urban infrastructure, political mobilization, organizational culture and national identity— consistently using mixed research methods. She holds a PhD in Social Anthropology, an MSc in Comparative and Cross Cultural Research Methods and a BA in Social Anthropology and Maths.
Ratcheva is dedicated to exploring the best ways to ensure more just social and political systems with a specific focus on skills, employment and work, identity (gender, ethnic) and culture. Saadia Zahidi is Head of the Global Challenge on Employment, Skills and Human Capital, Head of the Global Challenge on Gender Parity and Member of the Executive Committee at the World Economic Forum. Zahidi founded and co-authors the Forum’s Global Gender Gap Report, the Corporate Gender Gap Report, the Human Capital Report, the Future of Jobs Report and the Industry Gender Gap Report. In her work on gender as well as employment, Zahidi has translated analysis into action by mobilizing a wide network of constituents—business leaders, governments, civil society and academia—to work together to set targets, share best practices, create new publicprivate partnerships, muster resources and change mindsets. In past roles, she has managed civil society and international organization portfolios at the Forum and was also previously an Economist with the Forum’s Global Competitiveness Programme.
Zahidi serves as a board member and advisor for several organizations and is a frequent speaker at international conferences and in the media. She earned her BA in Economics at Smith College, MPhil in International Economics at the Graduate Institute of International Studies and MPA at the Harvard Kennedy School. Her research interests include issues of gender equality, women’s leadership, skills gaps, employment and human capital.
She is currently writing a book on Womenomics in the Muslim World and was awarded the inaugural Bracken Bower Prize by the Financial Times and McKinsey for this project. She is a native of Pakistan. The Future of Jobs Report | 145 . . The World Economic Forum would like to thank Adecco Group, African Rainbow Minerals, Alghanim Industries, AlixPartners, The Bahrain Economic Development Board, Chobani, The Coca-Cola Company, Edelman, GEMS Education, Infosys, LinkedIn, ManpowerGroup, Mercer (MMC), Microsoft Corporation, Pearson, The Rockefeller Foundation, SAP, Saudi Aramco, Siemens, Tata Consultancy Services, Tupperware Brands Corporation, Uber, Workday, WPP and Zain for their invaluable support of the Global Challenge Initiative on Employment, Skills and Human Capital and this Report. The Adecco Group, based in Zurich, Switzerland, is the world’s leading provider of HR solutions. With more than 32,000 FTE employees and around 5,100 branches in over 60 countries and territories around the world, Adecco Group offers a wide variety of services, connecting around 700,000 associates with its clients every day. The services offered fall into the broad categories of temporary staffing, permanent placement, career transition and talent development, as well as outsourcing and consulting. Adecco inspires individuals and organisations to work more effectively and efficiently and creates greater choice in the domain of work, for the benefit of all concerned. As the world’s leading provider of HR solutions—a business that has a positive impact on millions of people every day—it is conscious of its global role.
Helping people to better work, better life is its common purpose and the way in which it contributes to society. Adecco Group is a Fortune Global 500 company. www.adecco.com African Rainbow Minerals (ARM) is a leading South African diversified mining and minerals company with long-life, low unit cost operations and significant growth opportunities. ARM mines iron ore, manganese ore and alloys, chrome ore and alloys, platinum group metals, copper, nickel and coal.
The company also has an investment in gold through its shareholding in Harmony. ARM is committed to responsible environmental stewardship as a fundamental part of sustainable value creation. www.arm.co.za Alghanim Industries is one of the largest privately owned companies in the Gulf region. Founded in 1932, the company has since grown into a multi-billion dollar conglomerate, employing more than 14,000 employees in 30 businesses and operating in over 40 countries across the Middle East and North Africa, Turkey, India and emerging Asian economies. www.alghanim.com AlixPartners is a global business advisory firm recognized for deep expertise in restoring performance and creating value.
Its managing directors work alongside boards of directors, lenders, investors, government institutions and the legal community to provide complementary services across corporate finance, information management, litigation support and organizational effectiveness to address financial and commercial challenges at all stages of the business lifecycle. www.alixpartners.com The Bahrain Economic Development Board (EDB) is a dynamic public agency with responsibility for attracting inward investment into Bahrain focusing on target economic sectors in which the Kingdom offers significant strengths. Key areas include manufacturing, ICT, and logistics and transport services. The financial services sector in Bahrain is particularly strong and the EDB supports the continuing growth of the banking industry and key sub-sectors, including Islamic finance, wealth management, asset management, and insurance and re-insurance. www.bahrainedb.com The Future of Jobs Report | 147 .
Chobani was founded on the belief that people have great taste—they just need great options. Chobani produces high-quality, authentic, strained Greek yogurt products made with only natural ingredients from its New York and Idaho plants. Chobani is committed to using milk from regional farms and strengthening its surrounding local economies. Chobani gives 10% of its annual profits to charities worldwide through the company’s charitable foundation. Chobani products are available in the US, Australia, in Asia and Latin America. www.chobani.com The Coca-Cola Company (NYSE: KO) is the world’s largest beverage company, refreshing consumers with more than 500 sparkling and still brands.
Led by Coca-Cola, one of the world’s most valuable and recognizable brands, the Company’s portfolio features 16 billion-dollar brands including Diet Coke, Fanta, Sprite, Coca-Cola Zero, vitaminwater, Powerade, Minute Maid, Simply, Georgia and Del Valle. Globally, it is the No. 1 provider of sparkling beverages, readyto-drink coffees, and juices and juice drinks.
Through the world’s largest beverage distribution system, consumers in more than 200 countries enjoy its beverages at a rate of more than 1.8 billion servings a day. With an enduring commitment to building sustainable communities, the Company is focused on initiatives that reduce its environmental footprint, support active, healthy living, create a safe, inclusive work environment, and enhance the economic development of the communities where it operates. Together with its bottling partners, it ranks among the world’s top 10 private employers with more than 700,000 system associates. www.thecocacolacompany.com Edelman is a leading global communications marketing firm that partners with many of the world’s largest and emerging businesses and organizations, helping them evolve, promote and protect their brands and reputations.
It has 65 offices and more than 5,500 employees worldwide, as well as affiliates in more than 30 cities. www.edelman.com GEMS Education is a leading international education provider. It runs high-performing schools and offers consulting services to the public and private sectors. For over 55 years, it has provided high-quality education to hundreds of thousands of children.
GEMS has a global network of award-winning schools which provide high-quality holistic education to more than 250,000 students. It employs over 20,000 education professionals, specialists and staff. Its world-class leadership team combines business and education expertise from around the globe. www.gemseducation.com Infosys is a global leader in consulting, technology, outsourcing and next-generation services.
It enables clients in more than 50 countries to stay a step ahead of the competition. Its expertise spans industries. From helping build lighter and stronger passenger jets and creating more fuel efficient cars, to enabling banks to provide financial inclusion to the most remote corners of the globe, Infosys delivers powerful innovations.
And in doing so, it changes the way the world works and lives. www.infosys.com LinkedIn connects the world’s professionals to make them more productive and successful and transforms the ways companies hire, market and sell. Our vision is to create economic opportunity for every member of the global workforce through the ongoing development of the world’s first Economic Graph. LinkedIn has more than 400 million members and has offices around the world. www.linkedin.com 148 | The Future of Jobs Report .
ManpowerGroup™ (NYSE: MAN) is the world’s workforce expert, creating innovative workforce solutions, for more than 65 years. It connects more than 600,000 people to meaningful work across a wide range of skills and industries every day. Through its ManpowerGroup family of brands—Manpower®, Experis®, Right Management® and ManpowerGroup® Solutions—it helps more than 400,000 clients in 80 countries and territories address their critical talent needs, providing comprehensive solutions to resource, manage and develop talent. In 2015, ManpowerGroup was named one of the World’s Most Ethical Companies for the fifth consecutive year and one of Fortune’s Most Admired Companies, confirming its position as the most trusted and admired brand in the industry.
ManpowerGroup makes powering the world of work humanly possible. www.manpowergroup.com Mercer is a global consulting leader in talent, health, retirement and investments. Mercer helps clients around the world advance the health, wealth and careers of their most vital asset – their people. Mercer’s more than 20,000 employees are based in 43 countries and the firm operates in over 140 countries.
Mercer is a wholly owned subsidiary of Marsh & McLennan Companies (NYSE: MMC), a global professional services firm offering clients advice and solutions in the areas of risk, strategy and people. With annual revenue of $13 billion and 57,000 colleagues worldwide, Marsh & McLennan Companies is also the parent company of Marsh, a leader in insurance broking and risk management; Guy Carpenter, a leader in providing risk and reinsurance intermediary services; and Oliver Wyman, a leader in management consulting. www.mercer.com Microsoft is a worldwide leader in software, services and solutions that help people and businesses realize their full potential. Since it was founded in 1975, it has worked to achieve this mission by creating technology that transforms the way people work, play and communicate. Microsoft does business throughout the world, with over 90,000 employees and offices in more than 100 countries.
Through its people, partnerships and technology, the company helps to address some of the world’s most pressing societal challenges and create social and economic opportunities that improve people’s lives. Microsoft upholds a belief that social and economic opportunity go hand in hand. When individuals, communities and governments thrive, so does business.
To support this cycle, the company focuses on strengthening economies, addressing societal challenges, promoting a healthy online environment and managing a sustainable business. www.microsoft.com Pearson is the world’s leading education company. From pre-school to high school, early learning to professional certification, its curriculum materials, multimedia learning tools and testing programmes help to educate millions of people worldwide—more than any other private enterprise. www.pearson.com The Rockefeller Foundation supports work to advance inclusive economies that expand opportunities for more broadly shared prosperity and to build greater resilience by helping people, communities and institutions prepare for, withstand and emerge stronger from acute shocks and chronic stresses. This affirms its pioneering philanthropic mission—since 1913—to promote the well-being of humanity throughout the world. www.rockefellerfoundation.org The Future of Jobs Report | 149 .
As market leader in enterprise application software, SAP (NYSE: SAP) helps companies of all sizes and industries run better. From back office to boardroom, warehouse to storefront, desktop to mobile device, SAP empowers people and organizations to work together more efficiently and use business insight more effectively to stay ahead of the competition. SAP applications and services enable more than 296,000 customers to operate profitably, adapt continuously and grow sustainably. www.sap.com Saudi Aramco is a leading, globally integrated energy and chemicals company. From producing approximately one in every eight barrels of the world’s crude oil supply to developing new energy technologies, Saudi Aramco’s global team is dedicated to creating positive impacts. The company relentlessly pursues the ideas that make its resources more dependable, more sustainable, and more useful.
By strategically conducting its commercial activities in ways that trigger economic multiplier effects, the company delivers added value to the communities in which it operates. Whether it is the energy of its resources or the intellectual and creative energy of its people, Saudi Aramco is focused on harnessing the full potential of both for the benefit of the greatest number of people possible. www.saudiaramco.com Siemens AG (Berlin and Munich) is a global technology powerhouse that has stood for engineering excellence, innovation, quality, reliability and internationality for more than 165 years. The company is active in more than 200 countries, focusing on the areas of electrification, automation and digitalization. One of the world’s largest producers of energy-efficient, resourcesaving technologies, Siemens is No.
1 in offshore wind turbine construction, a leading supplier of combined cycle turbines for power generation, a major provider of power transmission solutions, and a pioneer in infrastructure solutions as well as automation, drive and software solutions for industry. The company is also a leading provider of medical imaging equipment—such as computed tomography and magnetic resonance imaging systems—and a leader in laboratory diagnostics as well as clinical IT. In fiscal 2014, which ended on 30 September 2014, Siemens generated revenue from continuing operations of 71.9 billion euros and net income of 5.5 billion euros.
At the end of September 2014, the company had around 357,000 employees worldwide. www.siemens.com Tata Consultancy Services (TCS) is a global IT services company that was rated as the fastest growing brand in its industry worldwide in 2015, with a brand value of $8.27 billion. It ranks in the topmost tier of its industry in terms of market capitalization, employees and brand value, and is the industry leader in customer satisfaction. TCS offers a consulting-led, integrated portfolio of IT, business process services, infrastructure, engineering and assurance services. The company is recognized as the top employer in its industry, with over 335,000 of the world’s best-trained consultants working in 46 countries.
Under the leadership of its current CEO, N. Chandrasekaran, TCS has grown at a compounded annual rate of 26% over the past three years and has generated consolidated revenues of $15.5 billion for the year ended 31 March 2015. www.tcs.com Tupperware Brands Corporation is the leading global marketer of innovative, premium products across multiple brands, utilizing a relationship-based selling method through an independent sales force of 2.9 million. For more than 65 years, Tupperware Brands has connected women through its worldwide sales force—propelling the organization’s business objectives while positively impacting the lives of women through a unique business model that educates and empowers through economic opportunities, training and enhanced self-confidence. www.tupperwarebrands.com 150 | The Future of Jobs Report . Uber is evolving the way the world moves. By seamlessly connecting riders to drivers through its apps, it makes cities more accessible, opening up more possibilities for riders and more business for drivers. From its founding in 2009 to its launches in hundreds of cities today, Uber’s rapidly expanding global presence continues to bring people and their cities closer. www.uber.com Workday is a leading provider of enterprise cloud applications for finance and human resources. Founded in 2005, Workday delivers financial management, human capital management, and analytics applications designed for the world’s largest companies, educational institutions, and government agencies. More than 1,000 organizations, ranging from medium-sized businesses to Fortune 500 enterprises, have selected Workday. www.workday.com WPP is the world’s leading communications services group, with billings of $72.3 billion and revenues of $17.3 billion in 2013, providing national, multinational and global clients with advertising; media investment management; data investment management; public relations & public affairs; branding & identity; healthcare communications; and direct, digital, interactive, promotion & specialist communications.
WPP’s worldwide companies include JWT, Ogilvy & Mather, Y&R, Grey Group, United Network, GroupM, Mindshare, MEC, MediaCom, Maxus, Kantar (including Millward Brown and TNS), Burson-Marsteller, Hill+Knowlton Strategies, Cohn & Wolfe, RLM Finsbury, Ogilvy Public Relations, Landor, Brand Union, Fitch, Sudler & Hennessey, Ogilvy CommonHealth Worldwide, ghg, AKQA, OgilvyOne, Wunderman and WPP Digital, among others. WPP companies provide communications services to clients worldwide, including 350 of the Fortune Global 500; all 30 of the Dow Jones 30; 63 of the NASDAQ 100; and 31 of the Fortune e-50. Collectively, WPP employs 179,000 people (including associates) in more than 3,000 offices in 111 countries. www.wpp.com Zain is a leading telecommunications operator across the Middle East and Africa providing mobile voice and data services to over 44.3 million active customers as of 31 December 2014. With a commercial presence in eight countries, Zain operates in Kuwait, Bahrain, Iraq, Jordan, Saudi Arabia, South Sudan and Sudan.
In Lebanon, the Group manages touch on behalf of the government. In Morocco, Zain has a 15.5% stake in INWI through a joint venture. Zain is listed on the Kuwait Stock Exchange. www.zain.com The Future of Jobs Report | 151 .
. The World Economic Forum would like to thank Alghanim Industries, A.T. Kearney, Bank of America, Bloomberg, Hubert Burda Media, Centene Corporation, The Coca-Cola Company, EY, Heidrick & Struggles, JLL, Johnson Controls Inc., ManpowerGroup, Old Mutual, Omnicom, Ooredoo, PwC, Renault-Nissan Alliance, Takeda Pharmaceutical, and Tupperware Brands Corporation for their invaluable support of the Global Challenge on Gender Parity and this Report. Alghanim Industries is one of the largest privately owned companies in the Gulf region. Founded in 1932, the company has since grown into a multi-billion dollar conglomerate, employing more than 14,000 employees in 30 businesses and operating in over 40 countries across the Middle East and North Africa, Turkey, India and emerging Asian economies. www.alghanim.com A.T. Kearney is a leading global management consulting firm with offices in more than 40 countries.
Since 1926, A.T. Kearney has been a trusted adviser to the world’s foremost organizations. A.T.
Kearney is a partner-owned firm, committed to helping clients achieve immediate impact and growing advantage on their most missioncritical issues. www.atkearney.com Bank of America is one of the world’s largest financial institutions, serving individual consumers, small- and middle-market businesses and large corporations with banking, investing, asset management and other financial and risk management products and services. The company provides unmatched convenience in the United States, serving approximately 48 million consumer and small business relationships with some 4,800 retail banking offices and around 16,000 ATMs, and award-winning online banking with 31 million active users and approximately 18 million mobile users. www.bankofamerica.com Bloomberg, L.P. is the leading global provider of financial data, analytics, news and media.
Bloomberg provides real-time financial information to more than 310,000 subscribers; through Bloomberg Law, Bloomberg Government and Bloomberg New Energy Finance, the company provides data, news, and analytics to decision makers in industries beyond finance. Bloomberg News, TV, Radio, Mobile, Internet and two magazines—Businessweek and Markets—cover the world with over 2,300 news professionals. The company employs more than 17,000 people in 192 locations around the world. www.bloomberg.com The Future of Jobs Report | 153 .
At total consolidated sales of €2.46 billion and over 10,000 employees in 18 countries, Hubert Burda Media is one of Europe’s largest consumer internet companies. Burda’s digital activities have been the main driver of the company’s growth. Hubert Burda Media reaches over 160 million users online; 40 million consumers enter into paying relationships with one of Burda’s 400 brands. As Germany’s leading magazine publishing house, the company offers about 80 magazines in Germany and another 240 magazines all over the world. www.hubert-burda-media.com Centene Corporation, a Fortune 500 company, is a diversified, multi-national healthcare enterprise that provides a portfolio of services to government-sponsored healthcare programs, focusing on under-insured and uninsured individuals.
Many receive benefits provided under Medicaid, including the State Children’s Health Insurance Program (CHIP), as well as Aged, Blind or Disabled (ABD), Foster Care and Long Term Care (LTC), in addition to other state-sponsored/hybrid programs and Medicare (Special Needs Plans). The Company operates local health plans and offers a range of health insurance solutions. It also contracts with other healthcare and commercial organizations to provide specialty services including behavioral health management, care management software, correctional healthcare services, dental benefits management, in-home health services, life and health management, managed vision, pharmacy benefits management, specialty pharmacy and telehealth services. www.centene.com The Coca-Cola Company (NYSE: KO) is the world’s largest beverage company, refreshing consumers with more than 500 sparkling and still brands.
Led by CocaCola, one of the world’s most valuable and recognizable brands, the Company’s portfolio features 16 billion-dollar brands including Diet Coke, Fanta, Sprite, CocaCola Zero, vitaminwater, Powerade, Minute Maid, Simply, Georgia and Del Valle. Globally, it is the No. 1 provider of sparkling beverages, ready-to-drink coffees, and juices and juice drinks. Through the world’s largest beverage distribution system, consumers in more than 200 countries enjoy its beverages at a rate of more than 1.8 billion servings a day.
With an enduring commitment to building sustainable communities, the Company is focused on initiatives that reduce its environmental footprint, support active, healthy living, create a safe, inclusive work environment, and enhance the economic development of the communities where it operates. Together with its bottling partners, it ranks among the world’s top 10 private employers with more than 700,000 system associates. www.thecocacolacompany.com EY is a global leader in assurance, tax, transaction and advisory services. The insights and quality services it delivers help build trust and confidence in the capital markets and in economies the world over.
EY develops outstanding leaders who team to deliver on its promises to all of its stakeholders. EY plays a critical role in building a better working world for its people, its clients and its communities. www.ey.com Heidrick & Struggles serves the executive talent and leadership needs of the world’s top organizations as the premier provider of leadership consulting, culture shaping and senior-level executive search services. The consultants of Heidrick leverage deep expertise across every industry sector and an unparalleled global presence.
Heidrick & Struggles pioneered the profession of executive search more than 60 years ago. Today, the firm serves as a trusted adviser, providing integrated leadership solutions and helping its clients change the world, one leadership team at a time. www.heidrick.com 154 | The Future of Jobs Report . JLL (NYSE: JLL) is a professional services and investment management firm offering specialized real estate services to clients seeking increased value by owning, occupying and investing in real estate. With annual fee revenue of $4.7 billion and gross revenue of $5.4 billion, JLL has more than 230 corporate offices, operates in 80 countries and has a global workforce of approximately 58,000. On behalf of its clients, the firm provides management and real estate outsourcing services for a property portfolio of 3.4 billion square feet, or 316 million square metres, and completed $118 billion in sales, acquisitions and finance transactions in 2014. Its investment management business, LaSalle Investment Management, has $55.3 billion of real estate assets under management.
JLL is the brand name, and a registered trademark, of Jones Lang LaSalle. www.joneslanglasalle.com Johnson Controls is a global diversified technology and industrial leader serving customers in more than 150 countries. Its 170,000 employees create quality products, services and solutions to optimize energy and operational efficiencies of buildings; lead-acid automotive batteries and advanced batteries for hybrid and electric vehicles; and seating components and systems for automobiles. The company’s commitment to sustainability dates back to 1885, with the invention of the first electric room thermostat.
Through its growth strategies and by increasing market share, Johnson Controls is committed to delivering value to shareholders and making its customers successful. In 2014, Johnson Controls reported annual sales of $42.8 billion and is consistently ranked on the U.S. Fortune 500 and Global Fortune 500.
Johnson Controls is committed to good corporate governance and community service. In 2015, Corporate Responsibility Magazine recognized Johnson Controls the no. 14 company in its annual “100 Best Corporate Citizens” list, confirming its position as an ethical and trusted brand in the industries it serves. www.johnsoncontrols.com ManpowerGroupTM (NYSE: MAN) is the world’s workforce expert, creating innovative workforce solutions, for more than 65 years.
It connects more than 600,000 people to meaningful work across a wide range of skills and industries every day. Through its ManpowerGroup family of brands—Manpower®, Experis®, Right Management® and ManpowerGroup® Solutions—it helps more than 400,000 clients in 80 countries and territories address their critical talent needs, providing comprehensive solutions to resource, manage and develop talent. In 2015, ManpowerGroup was named one of the World’s Most Ethical Companies for the fifth consecutive year and one of Fortune’s Most Admired Companies, confirming its position as the most trusted and admired brand in the industry.
ManpowerGroup makes powering the world of work humanly possible. www.manpowergroup.com Old Mutual provides investment, savings, insurance and banking services to more than 17 million customers in Africa, the Americas, Asia and Europe. Originating in South Africa in 1845, Old Mutual has been listed on the London and Johannesburg Stock Exchanges, among others, since 1999. In the year ended 31 December 2014, the Group reported adjusted operating profit before tax of £1.6 billion (on an IFRS basis) and had £319 billion of funds under management from core operations.
For further information on Old Mutual plc, please visit the corporate website at www. oldmutual.com. www.oldmutual.com The Future of Jobs Report | 155 . Omnicom is a strategic holding company headquartered in New York. It manages a portfolio of global market leaders in the disciplines of advertising, marketing services, specialty communications, interactive/digital media and media buying services. Omnicom Group companies cover more than 30 marketing communications disciplines across more than 200 strategic brand platforms, comprising three global advertising agency networks, leading national advertising agencies, a global network of more than 175 marketing services companies and a media group that includes two of the world’s premier providers of media planning and buying services. Omnicom’s commitment to excellence, quality and client satisfaction is a primary reason why its record of new business wins and longevity of major client relationships are the best in the business. Its agency brands are consistently acknowledged as having the best creative talent in the world in all disciplines.
A leader in digital media, Omnicom Group has been ranked number one in digital share of revenue among all holding companies. www.omnicomgroup.com Ooredoo is a leading international communications company delivering mobile, fixed, broadband internet and corporate managed services tailored to the needs of consumers and businesses across markets in the Middle East, North Africa and Southeast Asia. As a community-focused company, Ooredoo is guided by its vision of enriching people’s lives and its belief that it can stimulate human growth by leveraging communications to help people achieve their full potential. Ooredoo has a presence in markets such as Qatar, Kuwait, Oman, Algeria, Tunisia, Iraq, Palestine, the Maldives, Myanmar and Indonesia.
The company was named “Best Mobile Operator of the Year” at the World Communication Awards 2013. The company reported revenues of US$ 9.1 billion in 2014 and had a consolidated global customer base of more than 107 million people as of 31 December 2014. Ooredoo’s shares are listed on the Qatar Exchange and the Abu Dhabi Securities Exchange. www.ooredoo.com At PwC, our purpose is to build trust in society and solve important problems. We’re a network of firms in 157 countries with more than 208,000 people who are committed to delivering quality in assurance, advisory and tax services.
Find out more and tell us what matters to you by visiting us at www.pwc.com. PwC refers to the PwC network and/or one or more of its member firms, each of which is a separate legal entity. Please see www.pwc.com/structure for further details. www.pwc.com Founded in 1999, the Renault-Nissan Alliance is the longest-lasting cross-cultural combination among major automakers.
It sells one in 10 cars globally and employs nearly 450,000 people in nearly 200 countries. Renault and Nissan are separate companies but enjoy a cross-shareholding partnership which focuses on resultsdriven synergies and respects brand and corporate identities. The Alliance has expanded to include collaborations with Germany’s Daimler, China’s Dong Feng and Russia’s AvtoVAZ, among others.
Renault and Nissan are the only automakers massproducing and selling zero-emission vehicles, including the Nissan LEAF and Renault Zoe, which are 100% electric and can be fully recharged with purely renewable energy. Together, the Alliance has sold more than 200,000 electric vehicles—more than all of the other major automakers combined. The Alliance is committed to expanding the zero-emission infrastructure around the world and has agreements with over 100 cities, states and countries that are working to ensure electric vehicles are both affordable and convenient. www.alliance-renault-nissan.com 156 | The Future of Jobs Report .
Takeda Pharmaceutical is a global pharmaceutical company with a presence in more than 70 countries around the world. The company has a history spanning over 230 years and is currently the top pharmaceutical company in Japan and Asia, as well as one of the top 20 pharmaceutical firms globally. It pursues its mission to strive towards better health for people worldwide through leading innovation in medicine in four therapeutic areas: CNS, cardiovascular and metabolic diseases, gastroenterology and oncology. www.takeda.com Tupperware Brands Corporation is the leading global marketer of innovative, premium products across multiple brands, utilizing a relationship-based selling method through an independent sales force of 2.9 million. For more than 65 years, Tupperware Brands has connected women through its worldwide sales force—propelling the organization’s business objectives while positively impacting the lives of women through a unique business model that educates and empowers through economic opportunities, training and enhanced self-confidence. www.tupperwarebrands.com The Future of Jobs Report | 157 .
. The World Economic Forum, committed to improving the state of the world, is the International Organization for Public-Private Cooperation. The Forum engages the foremost political, business and other leaders of society to shape global, regional and industry agendas. World Economic Forum 91–93 route de la Capite CH-1223 Cologny/Geneva Switzerland Tel.: +41 (0) 22 869 1212 Fax: +41 (0) 22 786 2744 contact@weforum.org www.weforum.org . . . . .


