


Description
Bullseye
Highlights
Absolute Returns
W
ealthy investors tend to have a very different mindset than the average investor. Most average investors are looking
to get rich, whereas wealthy investors are looking to stay rich by preserving their wealth and increasing their assets
with slow and steady growth over the long term. Wealthy investors rarely chase short-term performance, whereas average
investors have trouble staying invested for a period long enough to gain the full benefits of the stock market. Why? Many
average investors go in and out of the market chasing short-term performance, often at exactly the wrong time.
And for many others, the ups and downs of the market are simply too much to take so they stay on the sidelines altogether. Relative Returns: Following the Market Up and Down Relative return strategies are designed to track or beat a given asset class or index. So, in a declining market, these strategies will follow the index downward. In fact, they often have mandates that require them to stay invested regardless of the market environment.
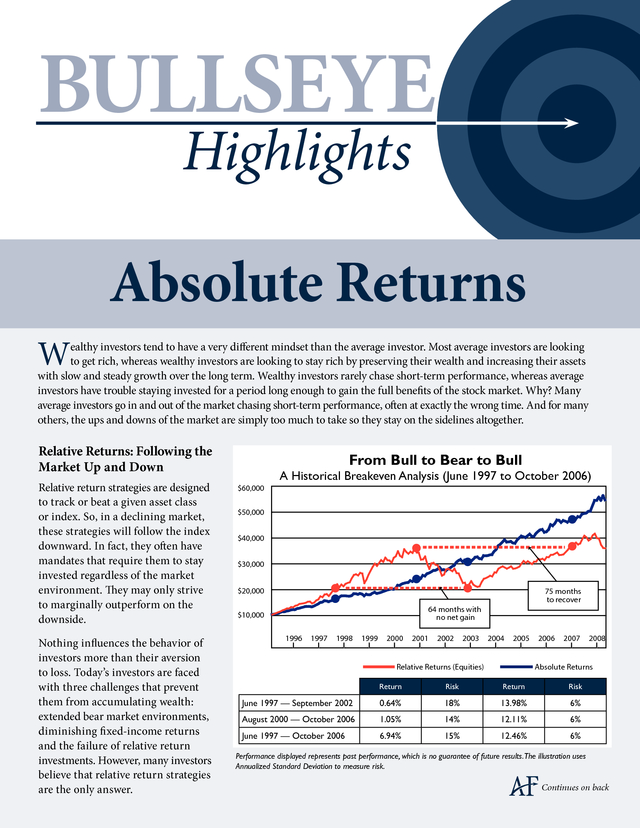
They may only strive to marginally outperform on the downside. Nothing influences the behavior of investors more than their aversion to loss. Today’s investors are faced with three challenges that prevent them from accumulating wealth: extended bear market environments, diminishing fixed-income returns and the failure of relative return investments. However, many investors believe that relative return strategies are the only answer. From Bull to Bear to Bull $60,000 A Historical Breakeven Analysis (June 1997 to October 2006) $50,000 $40,000 $30,000 $20,000 75 months to recover 64 months with no net gain $10,000 1996 1997 1998 1999 2000 2001 2002 2003 2004 2005 Relative Returns (Equities) 2006 2007 2008 Absolute Returns Return Risk Return Risk June 1997 — September 2002 0.64% 18% 13.98% 6% August 2000 — October 2006 1.05% 14% 12.11% 6% June 1997 — October 2006 6.94% 15% 12.46% 6% Performance displayed represents past performance, which is no guarantee of future results.The illustration uses Annualized Standard Deviation to measure risk. Continues on back .
Absolute Returns: Seeking Positive Returns in ALL Markets Many institutional and wealthy investors use absolute return investing as a way to reduce volatility and lower risk within a portfolio. Absolute return strategies aim to generate positive returns independent of a benchmark or index by exploiting market inefficiencies and minimizing exposure to the correlation effect of traditional investments. In a declining market a successfully implemented absolute return strategy aspires to provide positive returns or avoid (hedge) market risk. Conversely, in a rising market a relative return strategy benefits from the rising of its asset class. Absolute return strategies may or may not participate in such a rise, depending on whether the strategies are hedged against the asset class and whether the sources of the absolute return strategies’ returns are related to that asset class. Rolling Return Analysis of Relative and Absolute Returns (As of 6/30/2009) Equity Relative Returns Bond Relative Returns Absolute Return Strategy (ARS) Relative Return Portfolio (60 Equity/40 Bond) Relative Return Portfolio with 20% ARS 1 Year Returns -26.21% 6.05% -15.17% -13.90% -14.01% 3 Year Returns -8.22% 6.43% 1.76% -2.20% -1.31% 5 Year Returns -2.24% 5.01% 4.70% 0.90% 1.72% 10 Year Returns -2.22% 5.98% 9.74% 1.33% 3.05% 1 Year Risk 28.49% 6.06% 7.12% 18.43% 15.68% 3 Year Risk 18.97% 4.04% 7.70% 11.97% 10.25% 5 Year Risk 15.50% 3.63% 7.24% 9.69% 8.39% 10 Year Risk 16.03% 3.78% 6.87% 9.67% 8.19% Period Performance displayed represents past performance, which is no guarantee of future results.The illustration uses Annualized Standard Deviation to measure risk. Most investment managers would agree that they were not hired to lose money.
However, there are fundamental differences in their approach. Relative return managers look only at active risk, whereas absolute return managers consider total risk. The active risk approach relies on long-term average return models with less concern about shortterm capital preservation.
Unfortunately, many investors may not experience the long-term benefit if they don’t have the tolerance for short-term volatility swings. Since compounding is such a critical component of growth, investors who use only a relative return strategy have greater exposure to the effects of negative compounding during prolonged periods of declining or sideways markets. Absolute return managers try to minimize short-term volatility, thus reducing the dramatic effect of negative compounding.
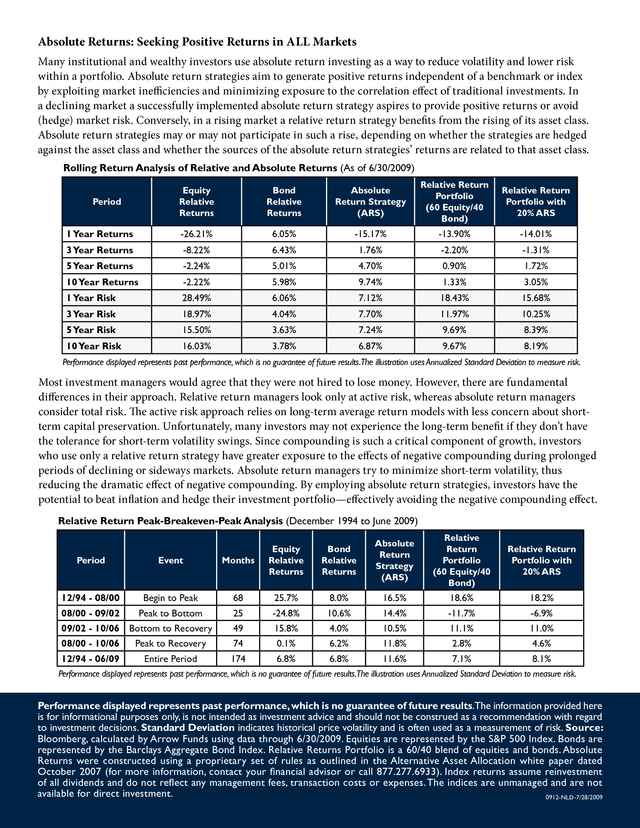
By employing absolute return strategies, investors have the potential to beat inflation and hedge their investment portfolio—effectively avoiding the negative compounding effect. Relative Return Peak-Breakeven-Peak Analysis (December 1994 to June 2009) Bond Relative Returns Absolute Return Strategy (ARS) Relative Return Portfolio (60 Equity/40 Bond) Relative Return Portfolio with 20% ARS Period Event Months Equity Relative Returns 12/94 - 08/00 Begin to Peak 68 25.7% 8.0% 16.5% 18.6% 18.2% 08/00 - 09/02 Peak to Bottom 25 -24.8% 10.6% 14.4% -11.7% -6.9% 09/02 - 10/06 Bottom to Recovery 49 15.8% 4.0% 10.5% 11.1% 11.0% 08/00 - 10/06 Peak to Recovery 74 0.1% 6.2% 11.8% 2.8% 4.6% 12/94 - 06/09 Entire Period 174 6.8% 6.8% 11.6% 7.1% 8.1% Performance displayed represents past performance, which is no guarantee of future results.The illustration uses Annualized Standard Deviation to measure risk. Performance displayed represents past performance, which is no guarantee of future results.The information provided here is for informational purposes only, is not intended as investment advice and should not be construed as a recommendation with regard to investment decisions. Standard Deviation indicates historical price volatility and is often used as a measurement of risk. Source: Bloomberg, calculated by Arrow Funds using data through 6/30/2009.
Equities are represented by the S&P 500 Index. Bonds are represented by the Barclays Aggregate Bond Index. Relative Returns Portfolio is a 60/40 blend of equities and bonds.
Absolute Returns were constructed using a proprietary set of rules as outlined in the Alternative Asset Allocation white paper dated October 2007 (for more information, contact your financial advisor or call 877.277.6933). Index returns assume reinvestment of all dividends and do not reflect any management fees, transaction costs or expenses. The indices are unmanaged and are not available for direct investment. 0912-NLD-7/28/2009 .
And for many others, the ups and downs of the market are simply too much to take so they stay on the sidelines altogether. Relative Returns: Following the Market Up and Down Relative return strategies are designed to track or beat a given asset class or index. So, in a declining market, these strategies will follow the index downward. In fact, they often have mandates that require them to stay invested regardless of the market environment.
They may only strive to marginally outperform on the downside. Nothing influences the behavior of investors more than their aversion to loss. Today’s investors are faced with three challenges that prevent them from accumulating wealth: extended bear market environments, diminishing fixed-income returns and the failure of relative return investments. However, many investors believe that relative return strategies are the only answer. From Bull to Bear to Bull $60,000 A Historical Breakeven Analysis (June 1997 to October 2006) $50,000 $40,000 $30,000 $20,000 75 months to recover 64 months with no net gain $10,000 1996 1997 1998 1999 2000 2001 2002 2003 2004 2005 Relative Returns (Equities) 2006 2007 2008 Absolute Returns Return Risk Return Risk June 1997 — September 2002 0.64% 18% 13.98% 6% August 2000 — October 2006 1.05% 14% 12.11% 6% June 1997 — October 2006 6.94% 15% 12.46% 6% Performance displayed represents past performance, which is no guarantee of future results.The illustration uses Annualized Standard Deviation to measure risk. Continues on back .
Absolute Returns: Seeking Positive Returns in ALL Markets Many institutional and wealthy investors use absolute return investing as a way to reduce volatility and lower risk within a portfolio. Absolute return strategies aim to generate positive returns independent of a benchmark or index by exploiting market inefficiencies and minimizing exposure to the correlation effect of traditional investments. In a declining market a successfully implemented absolute return strategy aspires to provide positive returns or avoid (hedge) market risk. Conversely, in a rising market a relative return strategy benefits from the rising of its asset class. Absolute return strategies may or may not participate in such a rise, depending on whether the strategies are hedged against the asset class and whether the sources of the absolute return strategies’ returns are related to that asset class. Rolling Return Analysis of Relative and Absolute Returns (As of 6/30/2009) Equity Relative Returns Bond Relative Returns Absolute Return Strategy (ARS) Relative Return Portfolio (60 Equity/40 Bond) Relative Return Portfolio with 20% ARS 1 Year Returns -26.21% 6.05% -15.17% -13.90% -14.01% 3 Year Returns -8.22% 6.43% 1.76% -2.20% -1.31% 5 Year Returns -2.24% 5.01% 4.70% 0.90% 1.72% 10 Year Returns -2.22% 5.98% 9.74% 1.33% 3.05% 1 Year Risk 28.49% 6.06% 7.12% 18.43% 15.68% 3 Year Risk 18.97% 4.04% 7.70% 11.97% 10.25% 5 Year Risk 15.50% 3.63% 7.24% 9.69% 8.39% 10 Year Risk 16.03% 3.78% 6.87% 9.67% 8.19% Period Performance displayed represents past performance, which is no guarantee of future results.The illustration uses Annualized Standard Deviation to measure risk. Most investment managers would agree that they were not hired to lose money.
However, there are fundamental differences in their approach. Relative return managers look only at active risk, whereas absolute return managers consider total risk. The active risk approach relies on long-term average return models with less concern about shortterm capital preservation.
Unfortunately, many investors may not experience the long-term benefit if they don’t have the tolerance for short-term volatility swings. Since compounding is such a critical component of growth, investors who use only a relative return strategy have greater exposure to the effects of negative compounding during prolonged periods of declining or sideways markets. Absolute return managers try to minimize short-term volatility, thus reducing the dramatic effect of negative compounding.
By employing absolute return strategies, investors have the potential to beat inflation and hedge their investment portfolio—effectively avoiding the negative compounding effect. Relative Return Peak-Breakeven-Peak Analysis (December 1994 to June 2009) Bond Relative Returns Absolute Return Strategy (ARS) Relative Return Portfolio (60 Equity/40 Bond) Relative Return Portfolio with 20% ARS Period Event Months Equity Relative Returns 12/94 - 08/00 Begin to Peak 68 25.7% 8.0% 16.5% 18.6% 18.2% 08/00 - 09/02 Peak to Bottom 25 -24.8% 10.6% 14.4% -11.7% -6.9% 09/02 - 10/06 Bottom to Recovery 49 15.8% 4.0% 10.5% 11.1% 11.0% 08/00 - 10/06 Peak to Recovery 74 0.1% 6.2% 11.8% 2.8% 4.6% 12/94 - 06/09 Entire Period 174 6.8% 6.8% 11.6% 7.1% 8.1% Performance displayed represents past performance, which is no guarantee of future results.The illustration uses Annualized Standard Deviation to measure risk. Performance displayed represents past performance, which is no guarantee of future results.The information provided here is for informational purposes only, is not intended as investment advice and should not be construed as a recommendation with regard to investment decisions. Standard Deviation indicates historical price volatility and is often used as a measurement of risk. Source: Bloomberg, calculated by Arrow Funds using data through 6/30/2009.
Equities are represented by the S&P 500 Index. Bonds are represented by the Barclays Aggregate Bond Index. Relative Returns Portfolio is a 60/40 blend of equities and bonds.
Absolute Returns were constructed using a proprietary set of rules as outlined in the Alternative Asset Allocation white paper dated October 2007 (for more information, contact your financial advisor or call 877.277.6933). Index returns assume reinvestment of all dividends and do not reflect any management fees, transaction costs or expenses. The indices are unmanaged and are not available for direct investment. 0912-NLD-7/28/2009 .


