2017 Outlook - Opportunities in Non-Traditional Fixed Income and Structured Credit
Angel Oak Capital Advisors


Description
2017 Outlook
Opportunities in non-traditional fixed income
and structured credit
Covered Topics
→→ Key drivers of the U.S. fixed income markets in 2017
→→ Views on the economy and interest rates with the new
administration
Contributors
Sreeni Prabhu
Chief Investment Officer
Brad Friedlander
Head Portfolio Manager
→→ Outlook for the mortgage credit market
Navid Abghari
Senior Portfolio Manager
→→ A deeper dive into floating rate loans and CLOs
Sam Dunlap
Senior Portfolio Manager
→→ Impact of the commercial real estate (CRE) market on
Matt Kennedy, CFA
Senior Portfolio Manager
CMBS in 2017
→→ Overall outlook for high yield bonds in today’s economy
→→ A look at investment-grade bonds, financial credits and
community bank sub-debt
Berkin Kologlu
Senior Portfolio Manager
Kin Lee
Senior Portfolio Manager
Colin McBurnette
Portfolio Manager
Clayton Triick, CFA
Portfolio Manager
1
. What have been the main drivers for the U.S. fixed income markets
in 2016, and what do you feel will be the key drivers in 2017?
14%
140%
13%
130%
12%
120%
11%
110%
10%
100%
9%
90%
8%
80%
7%
70%
6%
60%
1981
1986
1991
1996
2001
2006
2011
2016
U.S. Household Debt to Disposable Income Ratio
We expect the U.S. economic outlook to be favorable
if the Trump administration delivers on market
expectations of tax cuts, corporate tax reform,
large scale fiscal stimulus, and major deregulation
("Trumponomics").
We believe Trumponomics will FIGURE 2: U.S. HOUSEHOLD SPENDING CAPACITY U.S. Household Debt Service Ratio What are your general thoughts and outlook for the U.S.
economy in a Trump administration, and whom do you expect to be the industry winners? Yield S&P 500 Total Return FIGURE 1: S&P COMPARED WITH 10-YR TREASURY 2016 was a tale of two halves and two completely unexpected election results. The first half was driven 2016 Performance by worries of a corporate credit default cycle led by commodity-related credits, fears of a U.S. recession, 3.0% 15.0% and a Chinese currency devaluation, all of which led to a major risk-off environment.
Equities and other risk assets were off to a tumultuous start in 2016. 2.5% 10.0% The S&P total return index was down as much as 10.27% as of February 11 (Figure 1), marking the 2.0% 5.0% worst start of all time. Risk assets began to recover by the summer, but the Brexit vote surprised all market participants and some feared the worst. The bid for 1.5% 0.0% risk-free assets surged on the heels of Brexit, with 11/8 – Trump Elected 7/5 – 10-YR the 10-year note yield closing at a 1.37% yield on Treasury Low (1.37%) 1.0% -5.0% July 8, the lowest in its history.
“Lower for longer” 6/23 – Brexit seemed here to stay, although ironically Brexit was actually the catalyst for risk-on trades in the second 0.5% -10.0% half of 2016. The economic data began to improve S&P 500 TR (LA) 2/11 – S&P 500 in the U.S., recession worries began to subside, Low (-10.27%) 10-YR Treasury Rate (RA) equities began to rise, commodities recovered, -15.0% 0.0% credit spreads began to tighten, and risk-free rates Source: Bloomberg began to rise off post-Brexit lows. “Lower for longer” was still the widely held expectation in the U.S. prior to the November election, but the Trump victory changed everything heading into year-end.
Inflation and growth expectations completely changed, and the risk-free term structure repriced accordingly. We believe reflationary macro trends will continue in earnest in 2017, buoyed by the rekindling of animal spirits thanks to the surprise Trump victory. The election outcome is expected to pour gas on the Federal Open Market Committee (FOMC) inflation fire smoldering throughout the post-crisis period, through greater fiscal expansion, tax cuts, and deregulation-driven credit expansion.
It is still too early to predict what effect a Trump administration will have, but expectations are high. All the above will be beneficial for our strategies as they should all drive higher-than-expected inflation and growth in 2017. Our short effective duration profile should continue to benefit performance as U.S.
risk-free rates rise, driven by increased inflation and growth expectations in 2017. Tax cuts and fiscal expansion should keep credit spreads stable to tighter throughout the year as corporate earnings and ever-improving consumer balance sheets outweigh the effects of higher interest rates. U.S. Household Debt Service Ratio (LA) Source: Bloomberg U.S.
Household Debt to Disposable Income Ratio (RA) 2 . be the final potent cocktail to rid the U.S. of the bitter taste of deflation and anemic growth. The post-crisis expansion, now in its 77th month, still has a long way to go as the consumer credit box expands. Seventy percent of the U.S.
economy is related to consumer spending, and wages have finally begun to outpace inflation seven years into the recovery. Additionally, household leverage is at its lowest level since 2002 (Figure 2). Consumer credit expansion through mortgage credit has been hindered due to tightening credit standards, but residential mortgage guidelines have finally begun to relax (Figure 3). The coming consumer credit expansion, coupled with the potential of Trumponomics, will have some clear winners and losers.
We believe the winners could include risk assets that perform well in inflationary environments, such as equities, real estate, real estate-backed assets, floating rate securities, short duration assets, and high current carry credit spread assets. We believe the losers could be duration-sensitive assets, particularly negatively convex fixed income products such as agency mortgages. FIGURE 3: MORTGAGE CREDIT LENDING REMAINS TIGHT, BUT IS LOOSENING 770 760 750 740 730 720 710 700 Newly Originated Weighted Average FICO Score Source: Morgan Stanley What are your views on U.S. interest rates in 2017, and looking across the fixed income landscape, what do you feel will be the key themes in finding attractive risk-adjusted returns in a potentially rising interest rate environment? With this rate view in mind, three overarching themes will drive portfolio positioning across our strategies: 1. 8% FIGURE 4: SPREAD VS.
DURATION-RELATIVE VALUE Yield 7% Spread / Discount Margin We believe the FOMC will prove to be more hawkish than expected in 2017, marking the first time in the post-crisis period the FOMC will have been more hawkish than market participants. Higher headline inflation data should begin to pressure longer duration assets as the reset of higher year-over-year crude prices flows through. Market participants could begin to price in more than the two FOMC hikes currently anticipated in 2017 if the growth and inflation data begins to surprise to the upside.
We expect this will lead to a higher yet slightly flatter risk-free curve in the U.S. with rates increasing approximately 50-75 bps. Minimize interest rate sensitivity with a bias toward floating rate credit assets 2. Overweight structured credit relative to traditional U.S. fixed income 6% BBB- CMBS 5% 4% Non-Prime Residential Loans NA RMBS 3% BBB CLO BBB- Community Bank Sub-Debt HY Corp 2% IG Corp Barclays Finance Baa Index 1% 0% 0 2 4 6 8 Average Life (Years) 10 12 Source: Angel Oak Capital, Wells Fargo, and Yield Book Spread equivalent swap rate as of 12/31/16 3. Target less-levered sectors with positive credit fundamentals Therefore, we remain overweight non-agency mortgage credit through both legacy floating rate non-agency residential mortgage-backed securities (NA RMBS) and new non-prime residential mortgage loans.
Legacy NA RMBS remains attractive due to floating rate coupons, deeply discounted dollar prices, and appreciating collateral. Non-prime newly originated loans stand out for their underwriting quality, low LTVs, and historically wide credit spreads. Both sectors stand to potentially benefit from an inflationary growth environment driven by Trumponomics. 3 .
Targeted opportunities currently exist in non-agency commercial mortgage-backed securities (NA CMBS) and collateralized loan obligations (CLOs) due to their recent underperformance relative to corporate credit. While corporate credit outperformed in 2016, many areas of structured credit lagged over the same time period. In particular, BBB- investment-grade tranches of CMBS are attractive relative to BBB corporates. For example, BBB- CMBS spreads are 450 bps wider than BBB corporate bonds, and 200 bps more than the trailing two-year average.
CLOs also represent relative value due to their floating rate structure and wide spreads relative to traditional corporate credit, particularly BBB-, BB-, and AAA-rated tranches. Within high yield and investment-grade corporate credit, we favor specific sectors that we believe should benefit under a new policy regime, including regional financial credit, home builders, and building materials companies. What developments do you see occurring in the mortgage credit market in 2017? FIGURE 5: HISTORICAL U.S. MORTGAGE INTEREST RATES With or without Trumponomics, we believe the legacy NA RMBS market in 2017 should continue to benefit from the strong fundamental tailwinds of the broad-based housing market recovery, improving credit performance, historically low mortgage rates (Figure 5), and favorable supply/ demand technicals.
These tailwinds for the asset class could strengthen even further if Trumponomics comes to fruition. The expected pickup in growth from fiscal stimulus and tax cuts would be very positive for the U.S. consumer and borrower.
Most important, the deregulatory aspects of Trumponomics may be even more beneficial to the legacy NA RMBS market. 14 12 10 (%) 8 6 4 2 0 12-Month Voluntary Prepayment Rate (%) Housing Price Index Loan-to-Value (%) Significant deregulation would be expected to expand the credit box, which has been historically tight since the financial crisis. If the credit box were to expand, the ability for creditconstrained legacy NA RMBS borrowers to refinance would U.S. Effective Rate of Interest on Mortgage Debt Outstanding improve.
More flexible credit standards and the fundamentals Source: Bloomberg mentioned above are most noticeable in the prepayment activity in our NA RMBS (Figure 6). The broad-based housing recovery has resulted in solid improvement in home prices in FIGURE 6: LEGACY NON-AGENCY RMBS VPR & LTV the U.S. The combined effect of home price appreciation 110 9 and ongoing amortization has resulted in the Federal Housing Finance Agency Home Price Index adjusted 105 loan-to-value (HPI LTV) reaching parity with purchase 8 100 price LTVs.
This has improved legacy NA RMBS borrowers’ ability to refinance and has increased housing turnover 95 7 in the U.S. (e.g., moving, upsizing, or downsizing homes). Increased refinance and housing turnover activity in the 90 U.S. is illustrated by the increased voluntary prepayment 6 85 rate (VPR) of our legacy holdings.
The weighted average market price of the legacy NA RMBS allocation is still at 80 5 a significant discount to par; therefore, an increase in 75 VPRs improves the yield of our holdings. Moreover, VPRs increase the bond principal cash flow, which shortens the 70 4 weighted average life (WAL). In our view, this will be the Oct-12 Apr-13 Oct -13 Apr -14 Oct -14 Apr -15 Oct -15 Apr -16 Oct -16 catalyst for increased appreciation in the legacy NA RMBS HPI LTV (LA) 12M VPR (RA) allocation.
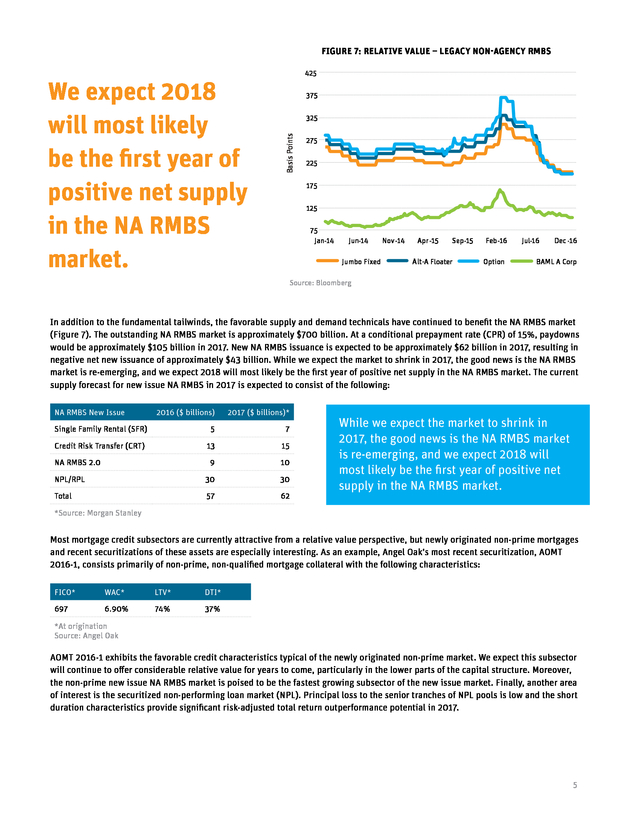
As market expectations for VPRs increase, WALs Source:Bloomberg; Angel Oak shrink, and discount margins increase, market participants will be willing to pay higher dollar prices. This opportunity is best captured through floating rate below-investment-grade legacy NA RMBS, where improving economic scenarios and ratings upgrades should lead to potentially attractive risk-adjusted total returns over the next two to three years. 4 . FIGURE 7: RELATIVE VALUE – LEGACY NON-AGENCY RMBS 375 325 Basis Points We expect 2018 will most likely be the first year of positive net supply in the NA RMBS market. 425 275 225 175 125 75 Jan-14 Jun-14 Jumbo Fixed Nov-14 Apr -15 Sep-15 Alt-A Floater Feb-16 Option Jul-16 Dec -16 BAML A Corp Source: Bloomberg In addition to the fundamental tailwinds, the favorable supply and demand technicals have continued to benefit the NA RMBS market (Figure 7). The outstanding NA RMBS market is approximately $700 billion. At a conditional prepayment rate (CPR) of 15%, paydowns would be approximately $105 billion in 2017. New NA RMBS issuance is expected to be approximately $62 billion in 2017, resulting in negative net new issuance of approximately $43 billion.
While we expect the market to shrink in 2017, the good news is the NA RMBS market is re-emerging, and we expect 2018 will most likely be the first year of positive net supply in the NA RMBS market. The current supply forecast for new issue NA RMBS in 2017 is expected to consist of the following: NA RMBS New Issue 2016 ($ billions) 2017 ($ billions)* Single Family Rental (SFR) 5 7 Credit Risk Transfer (CRT) 13 15 9 10 NPL/RPL 30 30 Total 57 62 NA RMBS 2.0 While we expect the market to shrink in 2017, the good news is the NA RMBS market is re-emerging, and we expect 2018 will most likely be the first year of positive net supply in the NA RMBS market. *Source: Morgan Stanley Most mortgage credit subsectors are currently attractive from a relative value perspective, but newly originated non-prime mortgages and recent securitizations of these assets are especially interesting. As an example, Angel Oak’s most recent securitization, AOMT 2016-1, consists primarily of non-prime, non-qualified mortgage collateral with the following characteristics: FICO* WAC* LTV* DTI* 697 6.90% 74% 37% *At origination Source: Angel Oak AOMT 2016-1 exhibits the favorable credit characteristics typical of the newly originated non-prime market.
We expect this subsector will continue to offer considerable relative value for years to come, particularly in the lower parts of the capital structure. Moreover, the non-prime new issue NA RMBS market is poised to be the fastest growing subsector of the new issue market. Finally, another area of interest is the securitized non-performing loan market (NPL).
Principal loss to the senior tranches of NPL pools is low and the short duration characteristics provide significant risk-adjusted total return outperformance potential in 2017. 5 . $6 billion moved into floating rate bank loan funds in the second half of 2016. Do you expect this trend to continue, and how would this impact the CLO market? The percentage of loans trading above par is typically a strong indicator of refinancing activity in the loan market, and we expect this activity to continue in 2017, pushing prepayment speeds higher. This is a major challenge for loan investors and certainly one where the CLO market differentiates itself, because CLOs have good call protection and shortening maturities mean higher yields given discounted prices in mezzanine tranches of CLOs. The technical picture for loans is expected to remain strong. Issuance should remain relatively muted due to limited M&A activity and regulatory pressure on underwriters, while demand continues to be high as investors look for floating rate exposure.
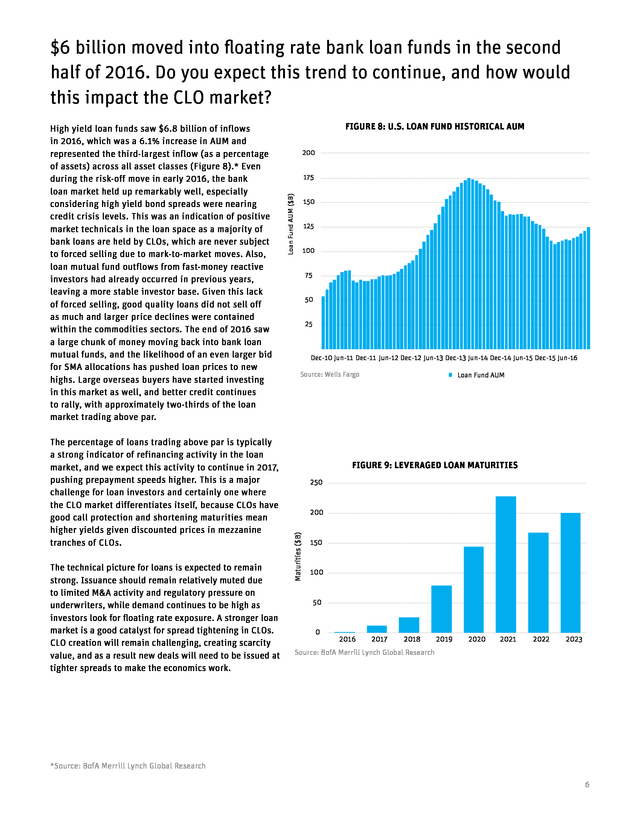
A stronger loan market is a good catalyst for spread tightening in CLOs. CLO creation will remain challenging, creating scarcity value, and as a result new deals will need to be issued at tighter spreads to make the economics work. FIGURE 8: U.S. LOAN FUND HISTORICAL AUM 200 Loan Fund AUM ($B) 175 150 125 100 75 50 25 Dec-10 Jun-11 Dec-11 Jun-12 Dec-12 Jun-13 Dec-13 Jun-14 Dec-14 Jun-15 Dec-15 Jun-16 Source: Wells Fargo Loan Fund AUM FIGURE 9: LEVERAGED LOAN MATURITIES 250 200 Maturities ($B) High yield loan funds saw $6.8 billion of inflows in 2016, which was a 6.1% increase in AUM and represented the third-largest inflow (as a percentage of assets) across all asset classes (Figure 8).* Even during the risk-off move in early 2016, the bank loan market held up remarkably well, especially considering high yield bond spreads were nearing credit crisis levels. This was an indication of positive market technicals in the loan space as a majority of bank loans are held by CLOs, which are never subject to forced selling due to mark-to-market moves.
Also, loan mutual fund outflows from fast-money reactive investors had already occurred in previous years, leaving a more stable investor base. Given this lack of forced selling, good quality loans did not sell off as much and larger price declines were contained within the commodities sectors. The end of 2016 saw a large chunk of money moving back into bank loan mutual funds, and the likelihood of an even larger bid for SMA allocations has pushed loan prices to new highs.
Large overseas buyers have started investing in this market as well, and better credit continues to rally, with approximately two-thirds of the loan market trading above par. 150 100 50 0 2016 2017 2018 2019 2020 2021 2022 2023 Source: BofA Merrill Lynch Global Research *Source: BofA Merrill Lynch Global Research 6 . What will be the drivers of CLO performance in 2017? Following sharp declines in early 2016, the CLO market bounced back in a big way with spreads finishing at their tights for the year across the entire capital structure. Still, on a relative basis, CLO spreads look attractive as there is room for further improvement given post-crisis tights that were set in the early part of 2015. CLO tranches generally lagged the fund flow-driven rally we saw in corporate bonds (both IG and HY) in 2016 and still remain cheap relative to high yield loans. Our reasons for optimism on CLO performance are several. The macro picture supports being long credit risk.
Although there is a lot of uncertainty, the potential for fiscal stimulus, tax reform, and a decrease in regulatory pressure points in the direction of economic growth. These potential changes lead us to believe that inflationary pressures will increase. Economic growth is a fundamental positive for owning U.S.
corporates. Furthermore, three-month LIBOR currently sits at approximately 1%, and we believe the potential for further Fed hikes in 2017 will continue to generate demand for floating rate assets. As a result, we expect relative outperformance versus corporate bonds that have already experienced huge spread tightening and have limited ability to absorb rate increases via further tightening. The fundamentals of U.S. credit look more typical of the end of a business cycle, with leverage on balance sheets relatively high. Interest coverage is still in good shape, and any stress from higher borrowing costs appears to be manageable given current earnings levels, and certainly so if earnings growth materializes.
Importantly, companies continue to push maturities forward, with refinancing risk not material until 2019. In this kind of environment it is unlikely that we will see a broad-based spike in default rates. We discussed the favorable technical picture in the high yield loan market and the secondary effect of limited CLO issuance, likely below the 2016 new issuance amount of $72 billion for U.S. CLOs, which was already close to a 30% decline when compared with 2015 issuance.
The new risk retention rules requiring CLO managers to bring capital to the table will also be a hindrance for CLO issuance. Just 50% of CLO managers already have risk retention solutions but others are highly likely to follow, as capital is a scarce resource and will become a factor in the ability to do more deals. The CLO market broadened in appeal in 2016 with a large number of new investors coming into the fold. Our estimate is that close to 50% of new issuance went into non-U.S.
buyer accounts. In addition to this, investors with sticky capital, such as pension funds, insurance companies, and private equity and wealth funds, made allocations to the space in 2016. The broadening of the buyer base and shift in composition of capital from fast money to longer term capital may benefit the CLO market.
Spread pickup relative to comparable asset classes, high floating rate carry, structural protections against defaults, and upside under early redemption scenarios are all features that make CLOs attractive. While CLO tranches further down the capital structure exhibit a high beta relative to corporate credit spreads, we believe investors are compensated well for these risks and expect allocations to the sector will continue, especially in investment-grade tranches where we see strong real-money sponsorship. How is the pervading negativity in the commercial real estate market impacting CMBS, and do you expect that to continue? CMBS experienced high spread volatility in 2016, which resulted in the sector underperforming the broader fixed income market. For example, CMBS conduit 3.0 BBB- bonds finished the year with an approximately -1% total return [Source: GS Economics Research]. A disappointing second half of 2015 resulted in CMBS starting 2016 at attractively wide levels.
However, through the first half of 2016, spreads continued to widen in sympathy with macro concerns and Brexit. Unlike other credit sensitive assets in the second half of 2016, CMBS spreads remained stubbornly wide until the Trump election victory, when the increase in the 10-year Treasury yield brought in yield buyers. This additional sponsorship resulted in spreads tightening in the fourth quarter and is a favorable tailwind for the start of 2017. The commercial real estate headlines did little to help CMBS spreads in 2016.
Headwinds included the negative implications of e-commerce for the bricks-and-mortar retail sector and the upcoming maturity of approximately $228 billion of 2007 CMBS originations. As a result, investors began demanding higher risk premiums for deals that exhibited less favorable credit characteristics. Market participants also began to differentiate between deals.
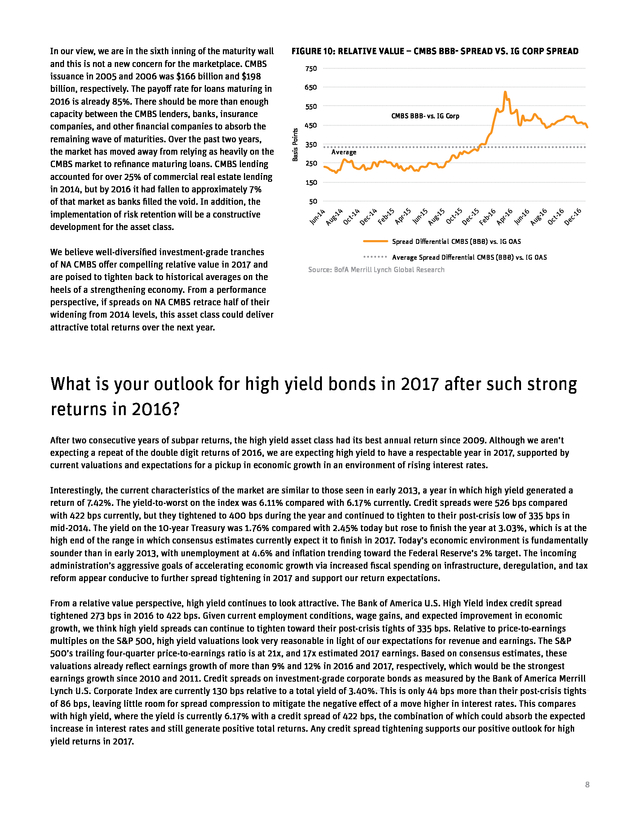
BBB- rated bond spreads priced in a range of approximately 425 bps to 700 bps in 2016. 7 . FIGURE 10: RELATIVE VALUE – CMBS BBB- SPREAD VS. IG CORP SPREAD 750 650 550 CMBS BBB- vs. IG Corp Basis Points In our view, we are in the sixth inning of the maturity wall and this is not a new concern for the marketplace. CMBS issuance in 2005 and 2006 was $166 billion and $198 billion, respectively.
The payoff rate for loans maturing in 2016 is already 85%. There should be more than enough capacity between the CMBS lenders, banks, insurance companies, and other financial companies to absorb the remaining wave of maturities. Over the past two years, the market has moved away from relying as heavily on the CMBS market to refinance maturing loans.
CMBS lending accounted for over 25% of commercial real estate lending in 2014, but by 2016 it had fallen to approximately 7% of that market as banks filled the void. In addition, the implementation of risk retention will be a constructive development for the asset class. 450 350 Average 250 150 50 Spread Differential CMBS (BBB) vs. IG OAS - We believe well-diversified investment-grade tranches of NA CMBS offer compelling relative value in 2017 and are poised to tighten back to historical averages on the heels of a strengthening economy.
From a performance perspective, if spreads on NA CMBS retrace half of their widening from 2014 levels, this asset class could deliver attractive total returns over the next year. Average Spread Differential CMBS (BBB) vs. IG OAS - Source: BofA Merrill Lynch Global Research What is your outlook for high yield bonds in 2017 after such strong returns in 2016? After two consecutive years of subpar returns, the high yield asset class had its best annual return since 2009. Although we aren’t expecting a repeat of the double digit returns of 2016, we are expecting high yield to have a respectable year in 2017, supported by current valuations and expectations for a pickup in economic growth in an environment of rising interest rates. Interestingly, the current characteristics of the market are similar to those seen in early 2013, a year in which high yield generated a return of 7.42%.
The yield-to-worst on the index was 6.11% compared with 6.17% currently. Credit spreads were 526 bps compared with 422 bps currently, but they tightened to 400 bps during the year and continued to tighten to their post-crisis low of 335 bps in mid-2014. The yield on the 10-year Treasury was 1.76% compared with 2.45% today but rose to finish the year at 3.03%, which is at the high end of the range in which consensus estimates currently expect it to finish in 2017.
Today’s economic environment is fundamentally sounder than in early 2013, with unemployment at 4.6% and inflation trending toward the Federal Reserve’s 2% target. The incoming administration’s aggressive goals of accelerating economic growth via increased fiscal spending on infrastructure, deregulation, and tax reform appear conducive to further spread tightening in 2017 and support our return expectations. From a relative value perspective, high yield continues to look attractive. The Bank of America U.S.
High Yield index credit spread tightened 273 bps in 2016 to 422 bps. Given current employment conditions, wage gains, and expected improvement in economic growth, we think high yield spreads can continue to tighten toward their post-crisis tights of 335 bps. Relative to price-to-earnings multiples on the S&P 500, high yield valuations look very reasonable in light of our expectations for revenue and earnings.
The S&P 500’s trailing four-quarter price-to-earnings ratio is at 21x, and 17x estimated 2017 earnings. Based on consensus estimates, these valuations already reflect earnings growth of more than 9% and 12% in 2016 and 2017, respectively, which would be the strongest earnings growth since 2010 and 2011. Credit spreads on investment-grade corporate bonds as measured by the Bank of America Merrill Lynch U.S.
Corporate Index are currently 130 bps relative to a total yield of 3.40%. This is only 44 bps more than their post-crisis tights of 86 bps, leaving little room for spread compression to mitigate the negative effect of a move higher in interest rates. This compares with high yield, where the yield is currently 6.17% with a credit spread of 422 bps, the combination of which could absorb the expected increase in interest rates and still generate positive total returns.
Any credit spread tightening supports our positive outlook for high yield returns in 2017. 8 . Given the expectations of a pickup in economic growth, higher inflation, gradually rising interest rates, and a stronger U.S. dollar, we are focused on sectors and issuers that can be competitive and prosper within that environment. As an example, we are favoring sectors that are less susceptible to imports, such as telecommunications. With expectations for continued employment improvements and wage gains combined with financial deregulation and less restrictive lending requirements, we also like issuers that we believe could benefit from a pickup in new home construction, including home builders and building materials companies. Within your investment-grade corporate allocation, why are you overweight financial credits, particularly regional and community bank subordinated debt? In the wake of the financial crisis, banks are more stable FIGURE 11: BANK SUBORDINATED DEBT due to higher capital requirements and increased regulatory oversight.
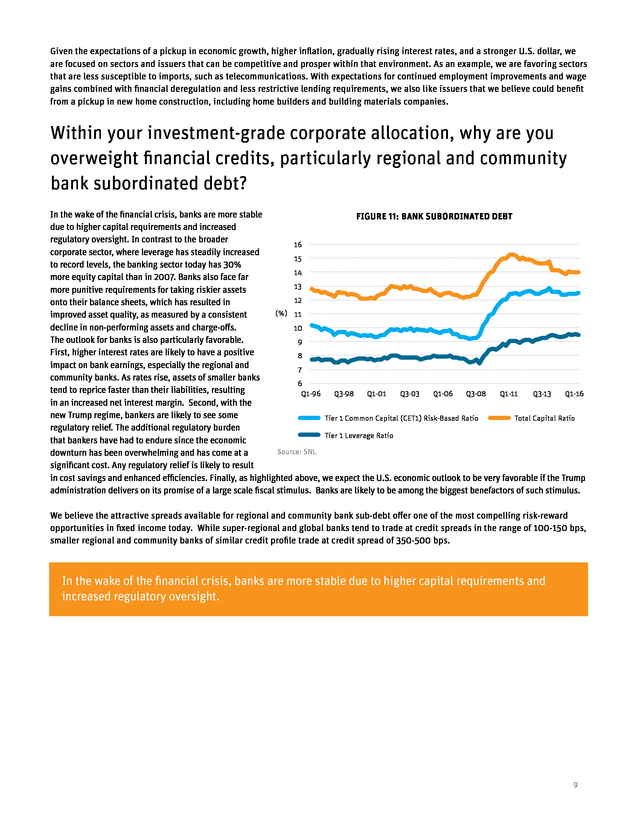
In contrast to the broader 16 corporate sector, where leverage has steadily increased 15 to record levels, the banking sector today has 30% 14 more equity capital than in 2007. Banks also face far 13 more punitive requirements for taking riskier assets 12 onto their balance sheets, which has resulted in (%) 11 improved asset quality, as measured by a consistent decline in non-performing assets and charge-offs. 10 The outlook for banks is also particularly favorable. 9 First, higher interest rates are likely to have a positive 8 impact on bank earnings, especially the regional and 7 community banks. As rates rise, assets of smaller banks 6 tend to reprice faster than their liabilities, resulting Q1-96 Q3-98 Q1-01 Q3-03 Q1-06 Q3-08 Q1-11 Q3-13 Q1-16 in an increased net interest margin.
Second, with the new Trump regime, bankers are likely to see some Tier 1 Common Capital (CET1) Risk-Based Ratio Total Capital Ratio regulatory relief. The additional regulatory burden Tier 1 Leverage Ratio that bankers have had to endure since the economic Source: SNL downturn has been overwhelming and has come at a significant cost. Any regulatory relief is likely to result in cost savings and enhanced efficiencies.
Finally, as highlighted above, we expect the U.S. economic outlook to be very favorable if the Trump administration delivers on its promise of a large scale fiscal stimulus. Banks are likely to be among the biggest benefactors of such stimulus. We believe the attractive spreads available for regional and community bank sub-debt offer one of the most compelling risk-reward opportunities in fixed income today.
While super-regional and global banks tend to trade at credit spreads in the range of 100-150 bps, smaller regional and community banks of similar credit profile trade at credit spread of 350-500 bps. In the wake of the financial crisis, banks are more stable due to higher capital requirements and increased regulatory oversight. 9 . © 2017 Angel Oak Capital Advisors, which is the advisor to the Angel Oak Funds Must be preceded or accompanied by a prospectus. To obtain an electronic copy of the prospectus, please visit www.angeloakcapital.com. Mutual fund investing involves risk. Principal loss is possible. The Funds can make short sales of securities, which involves the risk that losses in securities may exceed the original amount invested.
Leverage, which may exaggerate the effect of any increase or decrease in the value of securities in a Fund’s portfolio on the Fund’s Net Asset Value and therefore may increase the volatility of a Fund. Investments in foreign securities involve greater volatility and political, economic and currency risks and differences in accounting methods. These risks are increased for emerging markets.
Investments in fixed income instruments typically decrease in value when interest rates rise. Derivatives involve risks different from and, in certain cases, greater than the risks presented by more traditional investments. Investments in asset-backed and mortgage-backed securities include additional risks that investors should be aware of, such as credit risk, prepayment risk, possible illiquidity and default, as well as increased susceptibility to adverse economic developments.
Investments in lower-rated and nonrated securities presents a greater risk of loss to principal and interest than higher-rated securities. A non-diversified fund may be more susceptible to being adversely affected by a single corporate, economic, political or regulatory occurrence than a diversified fund. Funds will incur higher and duplicative costs when they invest in mutual funds, ETFs, and other investment companies.
There is also the risk that the Funds may suffer losses due to the investment practices of the underlying funds. For more information on these risks and other risks of the Funds, please see the Prospectus. Opinions expressed are as of 12/31/16 and are subject to change at any time, are not guaranteed, and should not be considered investment advice. The Angel Oak Funds are distributed by Quasar Distributors, LLC. It is not possible to invest directly in an index. Diversification does not guarantee a profit or protect from loss in a declining market. Earnings growth is not a measure of a Fund’s future performance. Fund holdings and/or sector allocations are subject to change at any time and are not recommendations to buy or sell any security. The Funds did not hold any of the securities mentioned as of 12/31/16. ARM: Adjustable-rate mortgage. Bank of America Merrill Lynch U.S. High Yield Index: Tracks the performance of below investment grade, but not in default, U.S.
dollar denominated corporate bonds publicly issued in the U.S. domestic market, and includes issues with a credit rating of BBB or below, as rated by Moody’s and S&P. Bank of America Merrill Lynch U.S. IG Bond Index: Tracks the performance of U.S.
dollar denominated investment-grade corporate debt publicly issued in the U.S. domestic market. Qualifying securities must have an investment-grade rating (based on an average of Moody’s, S&P, and Fitch), at least 18 months to final maturity at the time of issuance, at least one year remaining term to final maturity as of the rebalancing date, a fixed coupon schedule, and a minimum amount outstanding of $250 million. Barclays Finance Baa Index: The index is the Baa component of the U.S.
Credit Bond Index. The index includes publicly issued U.S. corporate and specified foreign debentures and secured notes that meet the specified maturity, liquidity, and quality requirements.
To qualify, bonds must be SEC-registered. Basis Point (bps): One hundredth of 1%; used to denote the percentage change in a financial instrument. Beta: A measure of a security’s sensitivity to market movements. Cash Flow: The net amount of cash and cash equivalents being transferred into and out of a business, especially as affecting liquidity. Collateralized loan obligation (CLO): A security backed by a portfolio of senior-secured floating rate loans made to corporations. Commercial mortgage-backed securities (CMBS): CMBS are backed by pools of individual commercial mortgages. The payments from all of the individual commercial mortgages are distributed to the holder of the commercial mortgage security. Securities are structured into tranches with the higher rated securities receiving payments first and the lower rated securities taking losses first. Community bank sub-debt: Subordinated debentures of financial institutions with total assets of less than $20 billion. Credit spread: The difference in yield between two bonds of similar maturity but different credit quality. DTI: Debt-to-income. Duration: Measures a portfolio’s sensitivity to changes in interest rates.
Generally, the longer the effective duration, the greater the price change relative to interest rate movements. Federal Housing Finance Agency Home Price Index: A broad measure of the movement of single-family house prices in the U.S. Apart from serving as an indicator of house price trends, the House Price Index (HPI) provides an analytical tool for estimating changes in the rates of mortgage defaults, prepayments, and housing affordability. FICO: The Fair Isaac Corporation, more commonly known as FICO, is best known for producing the most widely used consumer credit scores that financial institutions use in deciding whether to lend money or issue credit. Household Debt Service Ratio: An estimate of the ratio of debt payments to disposable personal income. M&A: Mergers and acquisitions. NPL: Non-performing loan. Non-agency RMBS: Mortgage-backed securities sponsored by private companies other than government sponsored enterprises such as Fannie Mae or Freddie Mac. Securities are structured into tranches with the higher rated securities receiving payments first and the lower rated securities taking losses first. Non-prime residential loans: Loans where the borrower’s FICO score is below 680. Price-to-Earnings Ratio (P/E Ratio): The ratio for valuing a company that measures its current share price relative to its per-share earnings. RPL: Re-performing loan. S&P 500 Index: An American stock market index based on the market capitalizations of 500 large companies having common stock listed on the NYSE or NASDAQ. Swap rate: The fixed rate that a receiver demands in exchange for the uncertainty of having to pay the short-term LIBOR (floating) rate over time.
At any given time, the market’s forecast of what LIBOR will be in the future is reflected in the forward LIBOR curve. Tranche: A portion of debt or structured financing. Each portion, or tranche, is one of several related securities offered at the same time but with different risks, rewards, and maturities. WAC: Weighted average coupon. Yield-to-Worst (YTW): The lowest yield an investor can expect when investing in a callable bond. Learn more at AngelOakCapital.com info@angeloakcapital.com Toll Free: 888.685.2915 10 .
We believe Trumponomics will FIGURE 2: U.S. HOUSEHOLD SPENDING CAPACITY U.S. Household Debt Service Ratio What are your general thoughts and outlook for the U.S.
economy in a Trump administration, and whom do you expect to be the industry winners? Yield S&P 500 Total Return FIGURE 1: S&P COMPARED WITH 10-YR TREASURY 2016 was a tale of two halves and two completely unexpected election results. The first half was driven 2016 Performance by worries of a corporate credit default cycle led by commodity-related credits, fears of a U.S. recession, 3.0% 15.0% and a Chinese currency devaluation, all of which led to a major risk-off environment.
Equities and other risk assets were off to a tumultuous start in 2016. 2.5% 10.0% The S&P total return index was down as much as 10.27% as of February 11 (Figure 1), marking the 2.0% 5.0% worst start of all time. Risk assets began to recover by the summer, but the Brexit vote surprised all market participants and some feared the worst. The bid for 1.5% 0.0% risk-free assets surged on the heels of Brexit, with 11/8 – Trump Elected 7/5 – 10-YR the 10-year note yield closing at a 1.37% yield on Treasury Low (1.37%) 1.0% -5.0% July 8, the lowest in its history.
“Lower for longer” 6/23 – Brexit seemed here to stay, although ironically Brexit was actually the catalyst for risk-on trades in the second 0.5% -10.0% half of 2016. The economic data began to improve S&P 500 TR (LA) 2/11 – S&P 500 in the U.S., recession worries began to subside, Low (-10.27%) 10-YR Treasury Rate (RA) equities began to rise, commodities recovered, -15.0% 0.0% credit spreads began to tighten, and risk-free rates Source: Bloomberg began to rise off post-Brexit lows. “Lower for longer” was still the widely held expectation in the U.S. prior to the November election, but the Trump victory changed everything heading into year-end.
Inflation and growth expectations completely changed, and the risk-free term structure repriced accordingly. We believe reflationary macro trends will continue in earnest in 2017, buoyed by the rekindling of animal spirits thanks to the surprise Trump victory. The election outcome is expected to pour gas on the Federal Open Market Committee (FOMC) inflation fire smoldering throughout the post-crisis period, through greater fiscal expansion, tax cuts, and deregulation-driven credit expansion.
It is still too early to predict what effect a Trump administration will have, but expectations are high. All the above will be beneficial for our strategies as they should all drive higher-than-expected inflation and growth in 2017. Our short effective duration profile should continue to benefit performance as U.S.
risk-free rates rise, driven by increased inflation and growth expectations in 2017. Tax cuts and fiscal expansion should keep credit spreads stable to tighter throughout the year as corporate earnings and ever-improving consumer balance sheets outweigh the effects of higher interest rates. U.S. Household Debt Service Ratio (LA) Source: Bloomberg U.S.
Household Debt to Disposable Income Ratio (RA) 2 . be the final potent cocktail to rid the U.S. of the bitter taste of deflation and anemic growth. The post-crisis expansion, now in its 77th month, still has a long way to go as the consumer credit box expands. Seventy percent of the U.S.
economy is related to consumer spending, and wages have finally begun to outpace inflation seven years into the recovery. Additionally, household leverage is at its lowest level since 2002 (Figure 2). Consumer credit expansion through mortgage credit has been hindered due to tightening credit standards, but residential mortgage guidelines have finally begun to relax (Figure 3). The coming consumer credit expansion, coupled with the potential of Trumponomics, will have some clear winners and losers.
We believe the winners could include risk assets that perform well in inflationary environments, such as equities, real estate, real estate-backed assets, floating rate securities, short duration assets, and high current carry credit spread assets. We believe the losers could be duration-sensitive assets, particularly negatively convex fixed income products such as agency mortgages. FIGURE 3: MORTGAGE CREDIT LENDING REMAINS TIGHT, BUT IS LOOSENING 770 760 750 740 730 720 710 700 Newly Originated Weighted Average FICO Score Source: Morgan Stanley What are your views on U.S. interest rates in 2017, and looking across the fixed income landscape, what do you feel will be the key themes in finding attractive risk-adjusted returns in a potentially rising interest rate environment? With this rate view in mind, three overarching themes will drive portfolio positioning across our strategies: 1. 8% FIGURE 4: SPREAD VS.
DURATION-RELATIVE VALUE Yield 7% Spread / Discount Margin We believe the FOMC will prove to be more hawkish than expected in 2017, marking the first time in the post-crisis period the FOMC will have been more hawkish than market participants. Higher headline inflation data should begin to pressure longer duration assets as the reset of higher year-over-year crude prices flows through. Market participants could begin to price in more than the two FOMC hikes currently anticipated in 2017 if the growth and inflation data begins to surprise to the upside.
We expect this will lead to a higher yet slightly flatter risk-free curve in the U.S. with rates increasing approximately 50-75 bps. Minimize interest rate sensitivity with a bias toward floating rate credit assets 2. Overweight structured credit relative to traditional U.S. fixed income 6% BBB- CMBS 5% 4% Non-Prime Residential Loans NA RMBS 3% BBB CLO BBB- Community Bank Sub-Debt HY Corp 2% IG Corp Barclays Finance Baa Index 1% 0% 0 2 4 6 8 Average Life (Years) 10 12 Source: Angel Oak Capital, Wells Fargo, and Yield Book Spread equivalent swap rate as of 12/31/16 3. Target less-levered sectors with positive credit fundamentals Therefore, we remain overweight non-agency mortgage credit through both legacy floating rate non-agency residential mortgage-backed securities (NA RMBS) and new non-prime residential mortgage loans.
Legacy NA RMBS remains attractive due to floating rate coupons, deeply discounted dollar prices, and appreciating collateral. Non-prime newly originated loans stand out for their underwriting quality, low LTVs, and historically wide credit spreads. Both sectors stand to potentially benefit from an inflationary growth environment driven by Trumponomics. 3 .
Targeted opportunities currently exist in non-agency commercial mortgage-backed securities (NA CMBS) and collateralized loan obligations (CLOs) due to their recent underperformance relative to corporate credit. While corporate credit outperformed in 2016, many areas of structured credit lagged over the same time period. In particular, BBB- investment-grade tranches of CMBS are attractive relative to BBB corporates. For example, BBB- CMBS spreads are 450 bps wider than BBB corporate bonds, and 200 bps more than the trailing two-year average.
CLOs also represent relative value due to their floating rate structure and wide spreads relative to traditional corporate credit, particularly BBB-, BB-, and AAA-rated tranches. Within high yield and investment-grade corporate credit, we favor specific sectors that we believe should benefit under a new policy regime, including regional financial credit, home builders, and building materials companies. What developments do you see occurring in the mortgage credit market in 2017? FIGURE 5: HISTORICAL U.S. MORTGAGE INTEREST RATES With or without Trumponomics, we believe the legacy NA RMBS market in 2017 should continue to benefit from the strong fundamental tailwinds of the broad-based housing market recovery, improving credit performance, historically low mortgage rates (Figure 5), and favorable supply/ demand technicals.
These tailwinds for the asset class could strengthen even further if Trumponomics comes to fruition. The expected pickup in growth from fiscal stimulus and tax cuts would be very positive for the U.S. consumer and borrower.
Most important, the deregulatory aspects of Trumponomics may be even more beneficial to the legacy NA RMBS market. 14 12 10 (%) 8 6 4 2 0 12-Month Voluntary Prepayment Rate (%) Housing Price Index Loan-to-Value (%) Significant deregulation would be expected to expand the credit box, which has been historically tight since the financial crisis. If the credit box were to expand, the ability for creditconstrained legacy NA RMBS borrowers to refinance would U.S. Effective Rate of Interest on Mortgage Debt Outstanding improve.
More flexible credit standards and the fundamentals Source: Bloomberg mentioned above are most noticeable in the prepayment activity in our NA RMBS (Figure 6). The broad-based housing recovery has resulted in solid improvement in home prices in FIGURE 6: LEGACY NON-AGENCY RMBS VPR & LTV the U.S. The combined effect of home price appreciation 110 9 and ongoing amortization has resulted in the Federal Housing Finance Agency Home Price Index adjusted 105 loan-to-value (HPI LTV) reaching parity with purchase 8 100 price LTVs.
This has improved legacy NA RMBS borrowers’ ability to refinance and has increased housing turnover 95 7 in the U.S. (e.g., moving, upsizing, or downsizing homes). Increased refinance and housing turnover activity in the 90 U.S. is illustrated by the increased voluntary prepayment 6 85 rate (VPR) of our legacy holdings.
The weighted average market price of the legacy NA RMBS allocation is still at 80 5 a significant discount to par; therefore, an increase in 75 VPRs improves the yield of our holdings. Moreover, VPRs increase the bond principal cash flow, which shortens the 70 4 weighted average life (WAL). In our view, this will be the Oct-12 Apr-13 Oct -13 Apr -14 Oct -14 Apr -15 Oct -15 Apr -16 Oct -16 catalyst for increased appreciation in the legacy NA RMBS HPI LTV (LA) 12M VPR (RA) allocation.
As market expectations for VPRs increase, WALs Source:Bloomberg; Angel Oak shrink, and discount margins increase, market participants will be willing to pay higher dollar prices. This opportunity is best captured through floating rate below-investment-grade legacy NA RMBS, where improving economic scenarios and ratings upgrades should lead to potentially attractive risk-adjusted total returns over the next two to three years. 4 . FIGURE 7: RELATIVE VALUE – LEGACY NON-AGENCY RMBS 375 325 Basis Points We expect 2018 will most likely be the first year of positive net supply in the NA RMBS market. 425 275 225 175 125 75 Jan-14 Jun-14 Jumbo Fixed Nov-14 Apr -15 Sep-15 Alt-A Floater Feb-16 Option Jul-16 Dec -16 BAML A Corp Source: Bloomberg In addition to the fundamental tailwinds, the favorable supply and demand technicals have continued to benefit the NA RMBS market (Figure 7). The outstanding NA RMBS market is approximately $700 billion. At a conditional prepayment rate (CPR) of 15%, paydowns would be approximately $105 billion in 2017. New NA RMBS issuance is expected to be approximately $62 billion in 2017, resulting in negative net new issuance of approximately $43 billion.
While we expect the market to shrink in 2017, the good news is the NA RMBS market is re-emerging, and we expect 2018 will most likely be the first year of positive net supply in the NA RMBS market. The current supply forecast for new issue NA RMBS in 2017 is expected to consist of the following: NA RMBS New Issue 2016 ($ billions) 2017 ($ billions)* Single Family Rental (SFR) 5 7 Credit Risk Transfer (CRT) 13 15 9 10 NPL/RPL 30 30 Total 57 62 NA RMBS 2.0 While we expect the market to shrink in 2017, the good news is the NA RMBS market is re-emerging, and we expect 2018 will most likely be the first year of positive net supply in the NA RMBS market. *Source: Morgan Stanley Most mortgage credit subsectors are currently attractive from a relative value perspective, but newly originated non-prime mortgages and recent securitizations of these assets are especially interesting. As an example, Angel Oak’s most recent securitization, AOMT 2016-1, consists primarily of non-prime, non-qualified mortgage collateral with the following characteristics: FICO* WAC* LTV* DTI* 697 6.90% 74% 37% *At origination Source: Angel Oak AOMT 2016-1 exhibits the favorable credit characteristics typical of the newly originated non-prime market.
We expect this subsector will continue to offer considerable relative value for years to come, particularly in the lower parts of the capital structure. Moreover, the non-prime new issue NA RMBS market is poised to be the fastest growing subsector of the new issue market. Finally, another area of interest is the securitized non-performing loan market (NPL).
Principal loss to the senior tranches of NPL pools is low and the short duration characteristics provide significant risk-adjusted total return outperformance potential in 2017. 5 . $6 billion moved into floating rate bank loan funds in the second half of 2016. Do you expect this trend to continue, and how would this impact the CLO market? The percentage of loans trading above par is typically a strong indicator of refinancing activity in the loan market, and we expect this activity to continue in 2017, pushing prepayment speeds higher. This is a major challenge for loan investors and certainly one where the CLO market differentiates itself, because CLOs have good call protection and shortening maturities mean higher yields given discounted prices in mezzanine tranches of CLOs. The technical picture for loans is expected to remain strong. Issuance should remain relatively muted due to limited M&A activity and regulatory pressure on underwriters, while demand continues to be high as investors look for floating rate exposure.
A stronger loan market is a good catalyst for spread tightening in CLOs. CLO creation will remain challenging, creating scarcity value, and as a result new deals will need to be issued at tighter spreads to make the economics work. FIGURE 8: U.S. LOAN FUND HISTORICAL AUM 200 Loan Fund AUM ($B) 175 150 125 100 75 50 25 Dec-10 Jun-11 Dec-11 Jun-12 Dec-12 Jun-13 Dec-13 Jun-14 Dec-14 Jun-15 Dec-15 Jun-16 Source: Wells Fargo Loan Fund AUM FIGURE 9: LEVERAGED LOAN MATURITIES 250 200 Maturities ($B) High yield loan funds saw $6.8 billion of inflows in 2016, which was a 6.1% increase in AUM and represented the third-largest inflow (as a percentage of assets) across all asset classes (Figure 8).* Even during the risk-off move in early 2016, the bank loan market held up remarkably well, especially considering high yield bond spreads were nearing credit crisis levels. This was an indication of positive market technicals in the loan space as a majority of bank loans are held by CLOs, which are never subject to forced selling due to mark-to-market moves.
Also, loan mutual fund outflows from fast-money reactive investors had already occurred in previous years, leaving a more stable investor base. Given this lack of forced selling, good quality loans did not sell off as much and larger price declines were contained within the commodities sectors. The end of 2016 saw a large chunk of money moving back into bank loan mutual funds, and the likelihood of an even larger bid for SMA allocations has pushed loan prices to new highs.
Large overseas buyers have started investing in this market as well, and better credit continues to rally, with approximately two-thirds of the loan market trading above par. 150 100 50 0 2016 2017 2018 2019 2020 2021 2022 2023 Source: BofA Merrill Lynch Global Research *Source: BofA Merrill Lynch Global Research 6 . What will be the drivers of CLO performance in 2017? Following sharp declines in early 2016, the CLO market bounced back in a big way with spreads finishing at their tights for the year across the entire capital structure. Still, on a relative basis, CLO spreads look attractive as there is room for further improvement given post-crisis tights that were set in the early part of 2015. CLO tranches generally lagged the fund flow-driven rally we saw in corporate bonds (both IG and HY) in 2016 and still remain cheap relative to high yield loans. Our reasons for optimism on CLO performance are several. The macro picture supports being long credit risk.
Although there is a lot of uncertainty, the potential for fiscal stimulus, tax reform, and a decrease in regulatory pressure points in the direction of economic growth. These potential changes lead us to believe that inflationary pressures will increase. Economic growth is a fundamental positive for owning U.S.
corporates. Furthermore, three-month LIBOR currently sits at approximately 1%, and we believe the potential for further Fed hikes in 2017 will continue to generate demand for floating rate assets. As a result, we expect relative outperformance versus corporate bonds that have already experienced huge spread tightening and have limited ability to absorb rate increases via further tightening. The fundamentals of U.S. credit look more typical of the end of a business cycle, with leverage on balance sheets relatively high. Interest coverage is still in good shape, and any stress from higher borrowing costs appears to be manageable given current earnings levels, and certainly so if earnings growth materializes.
Importantly, companies continue to push maturities forward, with refinancing risk not material until 2019. In this kind of environment it is unlikely that we will see a broad-based spike in default rates. We discussed the favorable technical picture in the high yield loan market and the secondary effect of limited CLO issuance, likely below the 2016 new issuance amount of $72 billion for U.S. CLOs, which was already close to a 30% decline when compared with 2015 issuance.
The new risk retention rules requiring CLO managers to bring capital to the table will also be a hindrance for CLO issuance. Just 50% of CLO managers already have risk retention solutions but others are highly likely to follow, as capital is a scarce resource and will become a factor in the ability to do more deals. The CLO market broadened in appeal in 2016 with a large number of new investors coming into the fold. Our estimate is that close to 50% of new issuance went into non-U.S.
buyer accounts. In addition to this, investors with sticky capital, such as pension funds, insurance companies, and private equity and wealth funds, made allocations to the space in 2016. The broadening of the buyer base and shift in composition of capital from fast money to longer term capital may benefit the CLO market.
Spread pickup relative to comparable asset classes, high floating rate carry, structural protections against defaults, and upside under early redemption scenarios are all features that make CLOs attractive. While CLO tranches further down the capital structure exhibit a high beta relative to corporate credit spreads, we believe investors are compensated well for these risks and expect allocations to the sector will continue, especially in investment-grade tranches where we see strong real-money sponsorship. How is the pervading negativity in the commercial real estate market impacting CMBS, and do you expect that to continue? CMBS experienced high spread volatility in 2016, which resulted in the sector underperforming the broader fixed income market. For example, CMBS conduit 3.0 BBB- bonds finished the year with an approximately -1% total return [Source: GS Economics Research]. A disappointing second half of 2015 resulted in CMBS starting 2016 at attractively wide levels.
However, through the first half of 2016, spreads continued to widen in sympathy with macro concerns and Brexit. Unlike other credit sensitive assets in the second half of 2016, CMBS spreads remained stubbornly wide until the Trump election victory, when the increase in the 10-year Treasury yield brought in yield buyers. This additional sponsorship resulted in spreads tightening in the fourth quarter and is a favorable tailwind for the start of 2017. The commercial real estate headlines did little to help CMBS spreads in 2016.
Headwinds included the negative implications of e-commerce for the bricks-and-mortar retail sector and the upcoming maturity of approximately $228 billion of 2007 CMBS originations. As a result, investors began demanding higher risk premiums for deals that exhibited less favorable credit characteristics. Market participants also began to differentiate between deals.
BBB- rated bond spreads priced in a range of approximately 425 bps to 700 bps in 2016. 7 . FIGURE 10: RELATIVE VALUE – CMBS BBB- SPREAD VS. IG CORP SPREAD 750 650 550 CMBS BBB- vs. IG Corp Basis Points In our view, we are in the sixth inning of the maturity wall and this is not a new concern for the marketplace. CMBS issuance in 2005 and 2006 was $166 billion and $198 billion, respectively.
The payoff rate for loans maturing in 2016 is already 85%. There should be more than enough capacity between the CMBS lenders, banks, insurance companies, and other financial companies to absorb the remaining wave of maturities. Over the past two years, the market has moved away from relying as heavily on the CMBS market to refinance maturing loans.
CMBS lending accounted for over 25% of commercial real estate lending in 2014, but by 2016 it had fallen to approximately 7% of that market as banks filled the void. In addition, the implementation of risk retention will be a constructive development for the asset class. 450 350 Average 250 150 50 Spread Differential CMBS (BBB) vs. IG OAS - We believe well-diversified investment-grade tranches of NA CMBS offer compelling relative value in 2017 and are poised to tighten back to historical averages on the heels of a strengthening economy.
From a performance perspective, if spreads on NA CMBS retrace half of their widening from 2014 levels, this asset class could deliver attractive total returns over the next year. Average Spread Differential CMBS (BBB) vs. IG OAS - Source: BofA Merrill Lynch Global Research What is your outlook for high yield bonds in 2017 after such strong returns in 2016? After two consecutive years of subpar returns, the high yield asset class had its best annual return since 2009. Although we aren’t expecting a repeat of the double digit returns of 2016, we are expecting high yield to have a respectable year in 2017, supported by current valuations and expectations for a pickup in economic growth in an environment of rising interest rates. Interestingly, the current characteristics of the market are similar to those seen in early 2013, a year in which high yield generated a return of 7.42%.
The yield-to-worst on the index was 6.11% compared with 6.17% currently. Credit spreads were 526 bps compared with 422 bps currently, but they tightened to 400 bps during the year and continued to tighten to their post-crisis low of 335 bps in mid-2014. The yield on the 10-year Treasury was 1.76% compared with 2.45% today but rose to finish the year at 3.03%, which is at the high end of the range in which consensus estimates currently expect it to finish in 2017.
Today’s economic environment is fundamentally sounder than in early 2013, with unemployment at 4.6% and inflation trending toward the Federal Reserve’s 2% target. The incoming administration’s aggressive goals of accelerating economic growth via increased fiscal spending on infrastructure, deregulation, and tax reform appear conducive to further spread tightening in 2017 and support our return expectations. From a relative value perspective, high yield continues to look attractive. The Bank of America U.S.
High Yield index credit spread tightened 273 bps in 2016 to 422 bps. Given current employment conditions, wage gains, and expected improvement in economic growth, we think high yield spreads can continue to tighten toward their post-crisis tights of 335 bps. Relative to price-to-earnings multiples on the S&P 500, high yield valuations look very reasonable in light of our expectations for revenue and earnings.
The S&P 500’s trailing four-quarter price-to-earnings ratio is at 21x, and 17x estimated 2017 earnings. Based on consensus estimates, these valuations already reflect earnings growth of more than 9% and 12% in 2016 and 2017, respectively, which would be the strongest earnings growth since 2010 and 2011. Credit spreads on investment-grade corporate bonds as measured by the Bank of America Merrill Lynch U.S.
Corporate Index are currently 130 bps relative to a total yield of 3.40%. This is only 44 bps more than their post-crisis tights of 86 bps, leaving little room for spread compression to mitigate the negative effect of a move higher in interest rates. This compares with high yield, where the yield is currently 6.17% with a credit spread of 422 bps, the combination of which could absorb the expected increase in interest rates and still generate positive total returns.
Any credit spread tightening supports our positive outlook for high yield returns in 2017. 8 . Given the expectations of a pickup in economic growth, higher inflation, gradually rising interest rates, and a stronger U.S. dollar, we are focused on sectors and issuers that can be competitive and prosper within that environment. As an example, we are favoring sectors that are less susceptible to imports, such as telecommunications. With expectations for continued employment improvements and wage gains combined with financial deregulation and less restrictive lending requirements, we also like issuers that we believe could benefit from a pickup in new home construction, including home builders and building materials companies. Within your investment-grade corporate allocation, why are you overweight financial credits, particularly regional and community bank subordinated debt? In the wake of the financial crisis, banks are more stable FIGURE 11: BANK SUBORDINATED DEBT due to higher capital requirements and increased regulatory oversight.
In contrast to the broader 16 corporate sector, where leverage has steadily increased 15 to record levels, the banking sector today has 30% 14 more equity capital than in 2007. Banks also face far 13 more punitive requirements for taking riskier assets 12 onto their balance sheets, which has resulted in (%) 11 improved asset quality, as measured by a consistent decline in non-performing assets and charge-offs. 10 The outlook for banks is also particularly favorable. 9 First, higher interest rates are likely to have a positive 8 impact on bank earnings, especially the regional and 7 community banks. As rates rise, assets of smaller banks 6 tend to reprice faster than their liabilities, resulting Q1-96 Q3-98 Q1-01 Q3-03 Q1-06 Q3-08 Q1-11 Q3-13 Q1-16 in an increased net interest margin.
Second, with the new Trump regime, bankers are likely to see some Tier 1 Common Capital (CET1) Risk-Based Ratio Total Capital Ratio regulatory relief. The additional regulatory burden Tier 1 Leverage Ratio that bankers have had to endure since the economic Source: SNL downturn has been overwhelming and has come at a significant cost. Any regulatory relief is likely to result in cost savings and enhanced efficiencies.
Finally, as highlighted above, we expect the U.S. economic outlook to be very favorable if the Trump administration delivers on its promise of a large scale fiscal stimulus. Banks are likely to be among the biggest benefactors of such stimulus. We believe the attractive spreads available for regional and community bank sub-debt offer one of the most compelling risk-reward opportunities in fixed income today.
While super-regional and global banks tend to trade at credit spreads in the range of 100-150 bps, smaller regional and community banks of similar credit profile trade at credit spread of 350-500 bps. In the wake of the financial crisis, banks are more stable due to higher capital requirements and increased regulatory oversight. 9 . © 2017 Angel Oak Capital Advisors, which is the advisor to the Angel Oak Funds Must be preceded or accompanied by a prospectus. To obtain an electronic copy of the prospectus, please visit www.angeloakcapital.com. Mutual fund investing involves risk. Principal loss is possible. The Funds can make short sales of securities, which involves the risk that losses in securities may exceed the original amount invested.
Leverage, which may exaggerate the effect of any increase or decrease in the value of securities in a Fund’s portfolio on the Fund’s Net Asset Value and therefore may increase the volatility of a Fund. Investments in foreign securities involve greater volatility and political, economic and currency risks and differences in accounting methods. These risks are increased for emerging markets.
Investments in fixed income instruments typically decrease in value when interest rates rise. Derivatives involve risks different from and, in certain cases, greater than the risks presented by more traditional investments. Investments in asset-backed and mortgage-backed securities include additional risks that investors should be aware of, such as credit risk, prepayment risk, possible illiquidity and default, as well as increased susceptibility to adverse economic developments.
Investments in lower-rated and nonrated securities presents a greater risk of loss to principal and interest than higher-rated securities. A non-diversified fund may be more susceptible to being adversely affected by a single corporate, economic, political or regulatory occurrence than a diversified fund. Funds will incur higher and duplicative costs when they invest in mutual funds, ETFs, and other investment companies.
There is also the risk that the Funds may suffer losses due to the investment practices of the underlying funds. For more information on these risks and other risks of the Funds, please see the Prospectus. Opinions expressed are as of 12/31/16 and are subject to change at any time, are not guaranteed, and should not be considered investment advice. The Angel Oak Funds are distributed by Quasar Distributors, LLC. It is not possible to invest directly in an index. Diversification does not guarantee a profit or protect from loss in a declining market. Earnings growth is not a measure of a Fund’s future performance. Fund holdings and/or sector allocations are subject to change at any time and are not recommendations to buy or sell any security. The Funds did not hold any of the securities mentioned as of 12/31/16. ARM: Adjustable-rate mortgage. Bank of America Merrill Lynch U.S. High Yield Index: Tracks the performance of below investment grade, but not in default, U.S.
dollar denominated corporate bonds publicly issued in the U.S. domestic market, and includes issues with a credit rating of BBB or below, as rated by Moody’s and S&P. Bank of America Merrill Lynch U.S. IG Bond Index: Tracks the performance of U.S.
dollar denominated investment-grade corporate debt publicly issued in the U.S. domestic market. Qualifying securities must have an investment-grade rating (based on an average of Moody’s, S&P, and Fitch), at least 18 months to final maturity at the time of issuance, at least one year remaining term to final maturity as of the rebalancing date, a fixed coupon schedule, and a minimum amount outstanding of $250 million. Barclays Finance Baa Index: The index is the Baa component of the U.S.
Credit Bond Index. The index includes publicly issued U.S. corporate and specified foreign debentures and secured notes that meet the specified maturity, liquidity, and quality requirements.
To qualify, bonds must be SEC-registered. Basis Point (bps): One hundredth of 1%; used to denote the percentage change in a financial instrument. Beta: A measure of a security’s sensitivity to market movements. Cash Flow: The net amount of cash and cash equivalents being transferred into and out of a business, especially as affecting liquidity. Collateralized loan obligation (CLO): A security backed by a portfolio of senior-secured floating rate loans made to corporations. Commercial mortgage-backed securities (CMBS): CMBS are backed by pools of individual commercial mortgages. The payments from all of the individual commercial mortgages are distributed to the holder of the commercial mortgage security. Securities are structured into tranches with the higher rated securities receiving payments first and the lower rated securities taking losses first. Community bank sub-debt: Subordinated debentures of financial institutions with total assets of less than $20 billion. Credit spread: The difference in yield between two bonds of similar maturity but different credit quality. DTI: Debt-to-income. Duration: Measures a portfolio’s sensitivity to changes in interest rates.
Generally, the longer the effective duration, the greater the price change relative to interest rate movements. Federal Housing Finance Agency Home Price Index: A broad measure of the movement of single-family house prices in the U.S. Apart from serving as an indicator of house price trends, the House Price Index (HPI) provides an analytical tool for estimating changes in the rates of mortgage defaults, prepayments, and housing affordability. FICO: The Fair Isaac Corporation, more commonly known as FICO, is best known for producing the most widely used consumer credit scores that financial institutions use in deciding whether to lend money or issue credit. Household Debt Service Ratio: An estimate of the ratio of debt payments to disposable personal income. M&A: Mergers and acquisitions. NPL: Non-performing loan. Non-agency RMBS: Mortgage-backed securities sponsored by private companies other than government sponsored enterprises such as Fannie Mae or Freddie Mac. Securities are structured into tranches with the higher rated securities receiving payments first and the lower rated securities taking losses first. Non-prime residential loans: Loans where the borrower’s FICO score is below 680. Price-to-Earnings Ratio (P/E Ratio): The ratio for valuing a company that measures its current share price relative to its per-share earnings. RPL: Re-performing loan. S&P 500 Index: An American stock market index based on the market capitalizations of 500 large companies having common stock listed on the NYSE or NASDAQ. Swap rate: The fixed rate that a receiver demands in exchange for the uncertainty of having to pay the short-term LIBOR (floating) rate over time.
At any given time, the market’s forecast of what LIBOR will be in the future is reflected in the forward LIBOR curve. Tranche: A portion of debt or structured financing. Each portion, or tranche, is one of several related securities offered at the same time but with different risks, rewards, and maturities. WAC: Weighted average coupon. Yield-to-Worst (YTW): The lowest yield an investor can expect when investing in a callable bond. Learn more at AngelOakCapital.com info@angeloakcapital.com Toll Free: 888.685.2915 10 .


